Estimated zip code population in 2022: 2,528 Zip code population in 2010: 2,337 Zip code population in 2000: 2,106
Houses and condos: 1,084 Renter-occupied apartments: 217
% of renters here:
22%
State:
33%
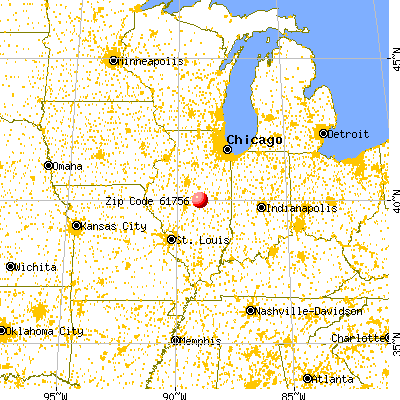
March 2022 cost of living index in zip code 61756: 84.7 (less than average, U.S. average is 100)
Land area: 82.5 sq. mi. Water area: 0.0 sq. mi.
Population density: 31 people per square mile
(very low).
OSM Map
General Map
Google Map
MSN Map
OSM Map
General Map
Google Map
MSN Map
OSM Map
General Map
Google Map
MSN Map
OSM Map
General Map
Google Map
MSN Map
Please wait while loading the map...
Real estate property taxes paid for housing units in 2022:
This zip code:
1.9% ($3,256)
Illinois:
2.0% ($4,912)
Median real estate property taxes paid for housing units with mortgages in 2022: $3,182 (1.5%) Median real estate property taxes paid for housing units with no mortgage in 2022: $3,373 (2.3%)
Business Search- 14 Million verified businesses
Males: 1,350
(53.4%)
Females: 1,178
(46.6%)
For population 25 years and over in 61756:
High school or higher: 95.5%
Bachelor's degree or higher: 30.7%
Graduate or professional degree: 9.2%
Unemployed: 3.0%
Mean travel time to work (commute): 22.7 minutes
For population 15 years and over in 61756:
Never married: 20.4%
Now married: 64.1%
Separated: 0.4%
Widowed: 4.7%
Divorced: 10.4%
Zip code 61756 compared to state average:
Black race population percentage significantly below state average.
Hispanic race population percentage significantly below state average.
Foreign-born population percentage significantly below state average.
Length of stay since moving in above state average.
Estimated median house/condo value in 2022: $172,048
61756:
$172,048
Illinois:
$251,600
According to our research of Illinois and other state lists, there were 3 registered sex offenders living in 61756 zip code as of May 30, 2024. The ratio of all residents to sex offenders in zip code 61756 is 820 to 1. The ratio of registered sex offenders to all residents in this zip code is near the state average.
Median resident age:
This zip code:
41.6 years
Illinois median age:
39.1 years
Average household size:
This zip code:
2.6 people
Illinois:
2.4 people
Averages for the 2020 tax year for zip code 61756, filed in 2021:
Average Adjusted Gross Income (AGI) in 2020: $67,456 (Individual Income Tax Returns)
Here:
$67,456
State:
$82,626
Salary/wage: $55,635 (reported on 81.4% of returns)
Here:
$55,635
State:
$66,640
(% of AGI for various income ranges: 993.0% for AGIs below $25k, 3306.7% for AGIs $25k-50k, 6851.7% for AGIs $50k-75k, 9988.3% for AGIs $75k-100k, 14068.5% for AGIs $100k-200k)
Taxable interest for individuals: $636 (reported on 38.2% of returns)
This zip code:
$636
Illinois:
$2,376
(% of AGI for various income ranges: 6.5% for AGIs below $25k, 15.0% for AGIs $25k-50k, 15.0% for AGIs $50k-75k, 61.7% for AGIs $75k-100k, 90.8% for AGIs $100k-200k)
Ordinary dividends: $2,637 (reported on 18.6% of returns)
Here:
$2,637
State:
$9,061
(% of AGI for various income ranges: 13.0% for AGIs below $25k, 20.6% for AGIs $25k-50k, 71.7% for AGIs $50k-75k, 100.0% for AGIs $75k-100k, 203.1% for AGIs $100k-200k)
Net capital gain/loss in AGI: +$6,144 (reported on 15.7% of returns)
Here:
+$6,144
State:
+$31,684
(% of AGI for various income ranges: 27.8% for AGIs below $25k, 52.5% for AGIs $50k-75k, 658.5% for AGIs $100k-200k)
Profit/loss from business: +$9,822 (reported on 8.8% of returns)
Here:
+$9,822
State:
+$12,175
(% of AGI for various income ranges: 87.0% for AGIs below $25k, 150.8% for AGIs $50k-75k, 386.9% for AGIs $100k-200k)
Taxable individual retirement arrangement distribution: $10,755 (reported on 10.8% of returns)
61756:
$10,755
Illinois:
$21,613
(% of AGI for various income ranges: 32.6% for AGIs below $25k, 98.3% for AGIs $25k-50k, 224.2% for AGIs $50k-75k, 509.2% for AGIs $100k-200k)
Total itemized deductions: $25,600 (reported on 3.9% of returns)
Here:
$25,600
State:
$34,948
(% of AGI for various income ranges: 787.7% for AGIs $100k-200k)
Charity contributions: $12,600 (reported on 2.0% of returns)
Here:
$12,600
State:
$13,122
(% of AGI for various income ranges: 193.8% for AGIs $100k-200k)
Taxes paid: $6,800 (reported on 3.9% of returns)
61756:
$6,800
State:
$8,563
(% of AGI for various income ranges: 209.2% for AGIs $100k-200k)
Earned income credit: $1,885 (reported on 12.7% of returns)
Here:
$1,885
State:
$2,311
(% of AGI for various income ranges: 59.6% for AGIs below $25k, 60.0% for AGIs $25k-50k)
Percentage of individuals using paid preparers for their 2020 taxes: 94.1%
Here:
94%
State:
93%
(% for various income ranges: 93.1% for AGIs below $25k, 95.5% for AGIs $25k-50k, 94.1% for AGIs $50k-75k, 100.0% for AGIs $75k-100k, 90.0% for AGIs $100k-200k, 100.0% for AGIs over 200k)
Averages for the 2012 tax year for zip code 61756, filed in 2013:
Average Adjusted Gross Income (AGI) in 2012: $61,435 (Individual Income Tax Returns)
Here:
$61,435
State:
$68,058
Salary/wage: $45,602 (reported on 85.0% of returns)
Here:
$45,602
State:
$55,396
(% of AGI for various income ranges: 73.2% for AGIs below $25k, 77.0% for AGIs $25k-50k, 76.4% for AGIs $50k-75k, 74.9% for AGIs $75k-100k, 92.8% for AGIs $100k-200k)
Taxable interest for individuals: $1,188 (reported on 40.2% of returns)
This zip code:
$1,188
Illinois:
$1,969
(% of AGI for various income ranges: 1.5% for AGIs below $25k, 0.9% for AGIs $25k-50k, 0.4% for AGIs $50k-75k, 0.3% for AGIs $75k-100k, 0.7% for AGIs $100k-200k, 1.1% for AGIs over 200k)
Ordinary dividends: $1,643 (reported on 21.5% of returns)
Here:
$1,643
State:
$7,786
(% of AGI for various income ranges: 0.7% for AGIs below $25k, 0.6% for AGIs $25k-50k, 0.5% for AGIs $50k-75k, 0.7% for AGIs $75k-100k, 1.0% for AGIs $100k-200k)
Net capital gain/loss in AGI: +$2,729 (reported on 13.1% of returns)
Here:
+$2,729
State:
+$22,183
(% of AGI for various income ranges: 0.1% for AGIs $50k-75k, 2.2% for AGIs $100k-200k)
Profit/loss from business: +$5,027 (reported on 10.3% of returns)
Here:
+$5,027
State:
+$12,903
(% of AGI for various income ranges: 2.5% for AGIs below $25k, 2.0% for AGIs $50k-75k, 1.3% for AGIs $100k-200k)
Taxable individual retirement arrangement distribution: $12,492 (reported on 11.2% of returns)
61756:
$12,492
Illinois:
$17,929
(% of AGI for various income ranges: 2.3% for AGIs below $25k, 2.1% for AGIs $25k-50k, 3.0% for AGIs $50k-75k, 9.6% for AGIs $75k-100k)
Total itemized deductions: $20,789 (16% of AGI, reported on 26.2% of returns)
Here:
$20,789
State:
$26,433
Here:
15.9% of AGI
State:
19.2% of AGI
(% of AGI for various income ranges: 6.8% for AGIs below $25k, 5.9% for AGIs $25k-50k, 8.4% for AGIs $50k-75k, 8.0% for AGIs $75k-100k, 12.2% for AGIs $100k-200k, 8.0% for AGIs over 200k)
Charity contributions: $4,065 (reported on 18.7% of returns)
Here:
$4,065
State:
$4,525
(% of AGI for various income ranges: 1.1% for AGIs $25k-50k, 0.8% for AGIs $50k-75k, 1.1% for AGIs $75k-100k, 3.0% for AGIs $100k-200k)
Taxes paid: $9,311 (reported on 26.2% of returns)
61756:
$9,311
State:
$11,968
(% of AGI for various income ranges: 1.2% for AGIs below $25k, 1.8% for AGIs $25k-50k, 2.8% for AGIs $50k-75k, 3.0% for AGIs $75k-100k, 5.7% for AGIs $100k-200k, 5.4% for AGIs over 200k)
Earned income credit: $2,025 (reported on 15.0% of returns)
Here:
$2,025
State:
$2,349
(% of AGI for various income ranges: 5.1% for AGIs below $25k, 1.1% for AGIs $25k-50k)
Percentage of individuals using paid preparers for their 2012 taxes: 58.9%
Here:
59%
State:
57%
(% for various income ranges: 51.3% for AGIs below $25k, 52.2% for AGIs $25k-50k, 64.7% for AGIs $50k-75k, 72.7% for AGIs $75k-100k, 64.3% for AGIs $100k-200k, 100.0% for AGIs over 200k)
Averages for the 2004 tax year for zip code 61756, filed in 2005:
Average Adjusted Gross Income (AGI) in 2004: $41,834 (Individual Income Tax Returns)
Here:
$41,834
State:
$54,625
Salary/wage: $36,668 (reported on 86.9% of returns)
Here:
$36,668
State:
$46,811
(% of AGI for various income ranges: 110.3% for AGIs below $10k, 69.8% for AGIs $10k-25k, 79.5% for AGIs $25k-50k, 78.5% for AGIs $50k-75k, 83.1% for AGIs $75k-100k, 65.4% for AGIs over 100k)
Taxable interest for individuals: $1,163 (reported on 52.9% of returns)
This zip code:
$1,163
Illinois:
$2,101
(% of AGI for various income ranges: 7.8% for AGIs below $10k, 1.8% for AGIs $10k-25k, 1.5% for AGIs $25k-50k, 1.8% for AGIs $50k-75k, 0.3% for AGIs $75k-100k, 1.3% for AGIs over 100k)
Taxable dividends: $821 (reported on 26.6% of returns)
Here:
$821
State:
$4,306
(% of AGI for various income ranges: 2.2% for AGIs below $10k, 1.0% for AGIs $10k-25k, 0.8% for AGIs $25k-50k, 0.4% for AGIs $50k-75k, 0.1% for AGIs $75k-100k, 0.4% for AGIs over 100k)
Net capital gain/loss: +$1,822 (reported on 16.5% of returns)
Here:
+$1,822
State:
+$17,321
(% of AGI for various income ranges: -3.9% for AGIs below $10k, -0.3% for AGIs $10k-25k, 0.2% for AGIs $25k-50k, 0.7% for AGIs $50k-75k, 0.4% for AGIs $75k-100k, 2.2% for AGIs over 100k)
Profit/loss from business: +$5,859 (reported on 13.0% of returns)
Here:
+$5,859
State:
+$11,771
(% of AGI for various income ranges: 5.9% for AGIs below $10k, 3.6% for AGIs $10k-25k, 1.4% for AGIs $25k-50k, 2.8% for AGIs $50k-75k, 0.3% for AGIs $75k-100k, 1.1% for AGIs over 100k)
Profit/loss from farming: +$18,256 (reported on 7.1% of returns)
Here:
+$18,256
State:
+$2,327
(% of AGI for various income ranges: 0.8% for AGIs $10k-25k, 3.9% for AGIs $25k-50k, 1.6% for AGIs $50k-75k, 2.2% for AGIs $75k-100k, 6.0% for AGIs over 100k)
IRA payment deduction: $3,593 (reported on 2.5% of returns)
61756:
$3,593
Illinois:
$3,087
Total itemized deductions: $16,065 (20% of AGI, reported on 23.8% of returns)
Here:
$16,065
State:
$20,239
Here:
19.9% of AGI
State:
19.5% of AGI
(% of AGI for various income ranges: 7.8% for AGIs $10k-25k, 6.4% for AGIs $25k-50k, 9.3% for AGIs $50k-75k, 11.5% for AGIs $75k-100k, 10.7% for AGIs over 100k)
Charity contributions deductions: $2,868 (3% of AGI, reported on 20.0% of returns)
Here:
$2,868
State:
$3,719
Here:
3.4% of AGI
State:
3.4% of AGI
(% of AGI for various income ranges: 1.0% for AGIs $10k-25k, 0.8% for AGIs $25k-50k, 1.0% for AGIs $50k-75k, 2.1% for AGIs $75k-100k, 2.0% for AGIs over 100k)
Total tax: $5,471 (reported on 76.9% of returns)
61756:
$5,471
State:
$9,882
(% of AGI for various income ranges: 2.6% for AGIs below $10k, 4.5% for AGIs $10k-25k, 6.7% for AGIs $25k-50k, 8.7% for AGIs $50k-75k, 10.7% for AGIs $75k-100k, 16.7% for AGIs over 100k)
Earned income credit: $1,702 (reported on 12.9% of returns)
Here:
$1,702
State:
$1,788
Percentage of individuals using paid preparers for their 2004 taxes: 61.3%
Here:
61%
State:
61%
(% for various income ranges: 57.9% for AGIs below $10k, 60.9% for AGIs $10k-25k, 61.1% for AGIs $25k-50k, 66.5% for AGIs $50k-75k, 62.2% for AGIs $75k-100k, 57.7% for AGIs over 100k)
Household received Food Stamps/SNAP in the past 12 months: 120 Household did not receive Food Stamps/SNAP in the past 12 months: 848
Women who had a birth in the past 12 months: 53 (53 now married, 0 unmarried) Women who did not have a birth in the past 12 months: 453 (242 now married, 207 unmarried)
Housing units in zip code 61756 with a mortgage: 465 (23 second mortgage, 17 both second mortgage and home equity loan) Houses without a mortgage: 4
Median monthly owner costs for units with a mortgage: $1,444 Median monthly owner costs for units without a mortgage: $660
Residents with income below the poverty level in 2022:
This zip code:
4.9%
Whole state:
11.9%
Residents with income below 50% of the poverty level in 2022:
This zip code:
2.8%
Whole state:
5.7%
Median number of rooms in houses and condos:
Here:
7.8
State:
6.4
Median number of rooms in apartments:
Here:
4.8
State:
4.1
Notable locations in this zip code not listed on our city pages
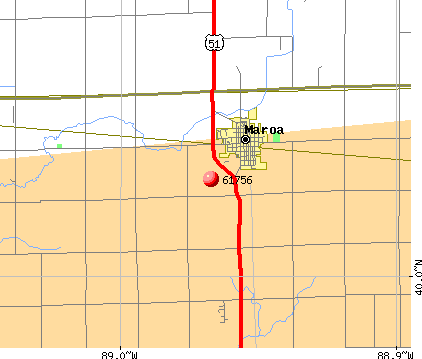
Notable locations in zip code 61756: Austin Townhall (A), Texas Townhall (B), Maroa Countryside Fire Protection District (C). Display/hide their locations on the map
Size of family households: 373 2-persons, 175 3-persons, 52 4-persons, 60 5-persons, 26 6-persons, 4 7-or-more-persons
Size of nonfamily households: 245 1-person, 23 2-persons, 5 3-persons
587 married couples with children.
102 single-parent households (20 men, 82 women).
93.5% of residents of 61756 zip code speak English at home.
3.4% of residents speak Spanish at home (52% very well, 48% well).
0.4% of residents speak other Indo-European language at home (70% very well, 30% well).
2.4% of residents speak Asian or Pacific Island language at home (100% well).
Foreign born population: 95 (3.8%) (0.0% of them are naturalized citizens)
:
3.8%
Whole state:
14.4%
60%Malaysia
38%Honduras
24%English
19%German
16%American
5%Irish
4%Italian
2%Polish
2%European
Year of entry for the foreign-born population
702010 or later
332000 to 2009
01990 to 1999
5Before 1990
Major facilities with environmental interests located in this zip code:
MASTRONARDI PRODUCE USA INC (45 AG RD in MAROA, IL)
STATE MASTER (Illinois EPA Project) - AIR PROGRAM AIR MINOR (AIRS/AFS) Business SIC classification: NONCLASSIFIABLE ESTABLISHMENTS Alternative names: MIDWEST GREENHOUSE LLC
MAROA STP (600 NORTH OAK STREET in MAROA, IL)
STATE MASTER (Illinois EPA Project) - National Pollutant Discharge Elimination System Permit National Pollutant Discharge Elimination System NON-MAJOR (Tracking pollutant discharge elimination systems) - permit National Pollutant Discharge Elimination System NON-MAJOR (Tracking pollutant discharge elimination systems) - permit Business SIC classification: SEWERAGE SYSTEMS Alternative names: MAROA STP, CITY OF, MAROA WWTF
ROGERS, THOMAS C (1804 E HAMPSHIRE RD in MAROA, IL)
STATE MASTER (Illinois EPA Project) - HAZARDOUS WASTE PROGRAM (Resource Conservation and Recovery Act (tracking hazardous waste)) Organizations: THOMAS ROGERS (CONTACT/OPERATOR)
MAROA FERTILIZER INC (RR 2 in MAROA, IL)
STATE MASTER (Illinois EPA Project) - AIR PROGRAM AIR MINOR (AIRS/AFS) CRITERIA AND HAZARDOUS AIR POLLUTANT INVENTORY (Inventory of air pollution sources) Business SIC classification: FARM SUPPLIES
MAROA WATER TOWER (WOOD & MADISON STS in MAROA, IL)
STATE MASTER (Illinois EPA Project) - SOLID WASTE PROGRAM, HAZARDOUS WASTE PROGRAM Large Quantity Generators, more that 1000 kg of hazardous waste/month (Resource Conservation and Recovery Act (tracking hazardous waste)) - notification Organizations: MAROA CITY OF (CONTACT/OWNER)
CONOCO PHILLIPS PIPE LINE COMPANY (RT. 1, BOX 377A in MAROA, IL)
STATE MASTER (Illinois EPA Project) - AIR PROGRAM AIR MINOR (AIRS/AFS) CRITERIA AND HAZARDOUS AIR POLLUTANT INVENTORY (Inventory of air pollution sources) Business SIC classification: PETROLEUM BULK STATIONS AND TERMINALS; NONCLASSIFIABLE ESTABLISHMENTS Alternative names: MAROA STATION
HIMES VARIETY AND DRY CLEANERS (215 EAST JACKSON in MAROA, IL)
STATE MASTER (Illinois EPA Project) - AIR PROGRAM AIR MINOR (AIRS/AFS) Business SIC classification: DRYCLEANING PLANTS, EXCEPT RUG CLEANING
MAROA MILLWORKS (615 NORTH WOOD STREET in MAROA, IL)
STATE MASTER (Illinois EPA Project) - AIR PROGRAM AIR MINOR (AIRS/AFS) Business SIC classification: NONCLASSIFIABLE ESTABLISHMENTS
MAROA GRADE SCHOOL (PO BOX 80 in MAROA, IL)
(Geographic Names Information System) (National Center for Education Statistics) - STATE ID-3905500202002 Organizations: MAROA FORSYTH C U SCH DIST 2 (SCHOOL DISTRICT)
MAROA-FORSYTH JUNIOR HIGH SCHOOL (PO BOX 738 in MAROA, IL)
(National Center for Education Statistics) - STATE ID-3905500201001 Organizations: MAROA FORSYTH C U SCH DIST 2 (SCHOOL DISTRICT)
MAROA-FORSYTH SENIOR HIGH SCH (PO BOX 738 in MAROA, IL)
(National Center for Education Statistics) - STATE ID-3905500200001 Organizations: MAROA FORSYTH C U SCH DIST 2 (SCHOOL DISTRICT)
CORN BELT FS INCORPORATED MAROA (389 E SCHOOL ROAD in MAROA, IL)
National Pollutant Discharge Elimination System NON-MAJOR (Tracking pollutant discharge elimination systems) - permit Organizations: CUNNINGHAM?BRIAN (CONTACT/OWNER)
Housing units lacking complete plumbing facilities: 4.7% Housing units lacking complete kitchen facilities: 3.5%
52.7%Utility gas
25.6%Electricity
19.8%Bottled, tank, or LP gas
1.2%No fuel used
0.8%Other fuel
Population in 1990: 1,883. Population change in the 1990s: +223 (+11.8%).
Place of birth for U.S.-born residents:
This state: 1,913
Northeast: 23
Midwest: 189
South: 102
West: 194
63% of the 61756 zip code residents lived in the same house 5 years ago. Out of people who lived in different houses, 62% lived in this county. Out of people who lived in different counties, 50% lived in Illinois.
88% of the 61756 zip code residents lived in the same house 1 year ago. Out of people who lived in different houses, 87% moved from this county. Out of people who lived in different houses, 3% moved from different county within same state. Out of people who lived in different houses, 4% moved from different state.
Private vs. public school enrollment:
Students in private schools in grades 1 to 8 (elementary and middle school): 9
Here:
2.1%
Illinois:
13.3%
Students in private schools in grades 9 to 12 (high school):
Here:
0.0%
Illinois:
9.9%
Students in private undergraduate colleges:
Here:
0.0%
Illinois:
27.4%
Occupation by median earnings in the past 12 months ($)
113,776Life, physical, and social science occupations
108,904Management occupations
82,657Health diagnosing and treating practitioners and other technical occupations
78,478Architecture and engineering occupations
70,959Construction and extraction occupations
66,377Business and financial operations occupations
Top industries in this zip code by the number of employees in 2005:
Detailed PMIC statistics for the following Tracts:0028.00
, 0030.00
2002 - 2018 National Fire Incident Reporting System (NFIRS) incidents
Based on the data from the years 2002 - 2018 the average number of fires per year is 19. The highest number of fires - 37 took place in 2007, and the least - 6 in 2002. The data has a rising trend.
When looking into fire subcategories, the most incidents belonged to: Structure Fires (39.4%), and Outside Fires (35.9%).
Fire incident types reported to NFIRS in Zip Code 61756


 Nearest zip codes: 62535, 61727, 62554, 62526, 62573, 61750.


 Based on the data from the years 2002 - 2018 the average number of fires per year is 19. The highest number of fires - 37 took place in 2007, and the least - 6 in 2002. The data has a rising trend.
 When looking into fire subcategories, the most incidents belonged to: Structure Fires (39.4%), and Outside Fires (35.9%).