Estimated zip code population in 2022: 1,534 Zip code population in 2010: 1,634 Zip code population in 2000: 1,746
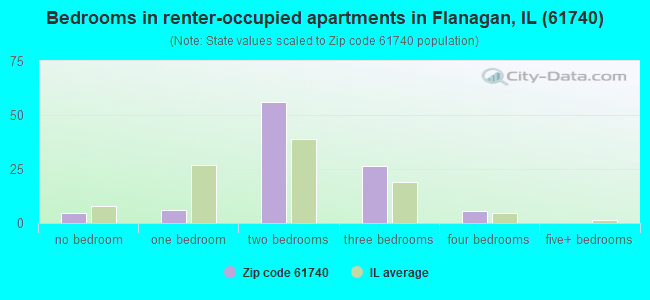
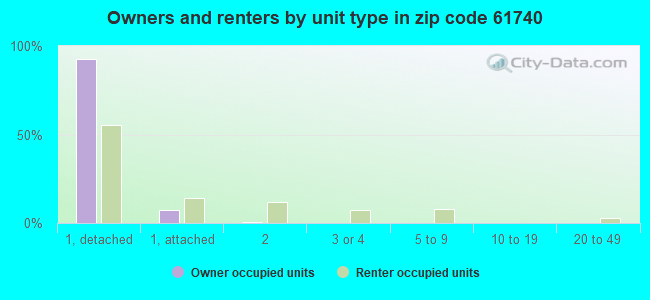
Houses and condos: 711 Renter-occupied apartments: 99
% of renters here:
16%
State:
33%
March 2022 cost of living index in zip code 61740: 84.4 (less than average, U.S. average is 100)
Land area: 73.8 sq. mi. Water area: 0.0 sq. mi.
Population density: 21 people per square mile
(very low).
OSM Map
General Map
Google Map
MSN Map
OSM Map
General Map
Google Map
MSN Map
OSM Map
General Map
Google Map
MSN Map
OSM Map
General Map
Google Map
MSN Map
Please wait while loading the map...
Real estate property taxes paid for housing units in 2022:
This zip code:
2.0% ($2,719)
Illinois:
2.0% ($4,912)
Median real estate property taxes paid for housing units with mortgages in 2022: $2,431 (2.0%) Median real estate property taxes paid for housing units with no mortgage in 2022: $2,956 (2.0%)
Business Search- 14 Million verified businesses
Males: 739
(48.2%)
Females: 795
(51.8%)
For population 25 years and over in 61740:
High school or higher: 94.8%
Bachelor's degree or higher: 22.1%
Graduate or professional degree: 6.5%
Unemployed: 4.2%
Mean travel time to work (commute): 22.5 minutes
For population 15 years and over in 61740:
Never married: 20.4%
Now married: 55.9%
Separated: 0.2%
Widowed: 11.7%
Divorced: 11.8%
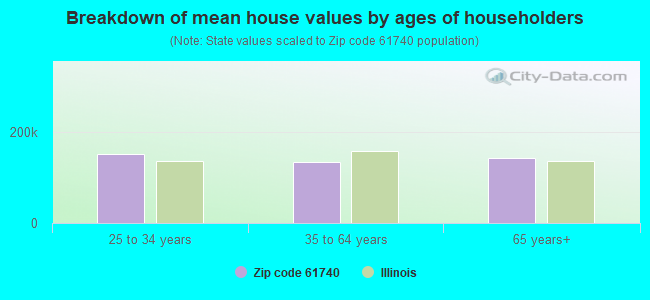
Zip code 61740 compared to state average:
Median house value below state average.
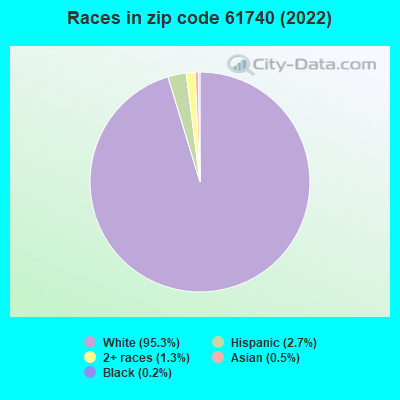
Black race population percentage significantly below state average.
Hispanic race population percentage significantly below state average.
Foreign-born population percentage significantly below state average.
Renting percentage below state average.
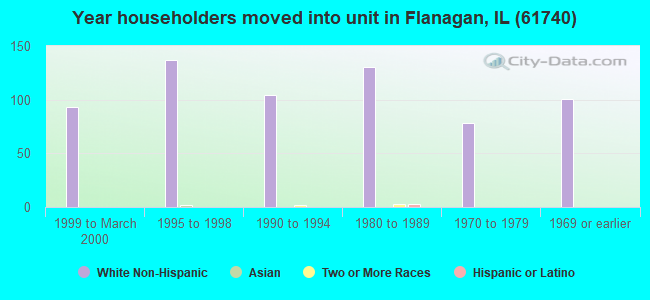
Length of stay since moving in significantly above state average.
House age above state average.
Percentage of population with a bachelor's degree or higher below state average.
Averages for the 2020 tax year for zip code 61740, filed in 2021:
Average Adjusted Gross Income (AGI) in 2020: $67,857 (Individual Income Tax Returns)
Here:
$67,857
State:
$82,626
Salary/wage: $50,640 (reported on 81.1% of returns)
Here:
$50,640
State:
$66,640
(% of AGI for various income ranges: 1062.7% for AGIs below $25k, 3649.2% for AGIs $25k-50k, 6233.3% for AGIs $50k-75k, 9026.0% for AGIs $75k-100k, 16463.3% for AGIs $100k-200k)
Taxable interest for individuals: $964 (reported on 48.6% of returns)
This zip code:
$964
Illinois:
$2,376
(% of AGI for various income ranges: 34.7% for AGIs below $25k, 50.8% for AGIs $25k-50k, 76.7% for AGIs $50k-75k, 84.0% for AGIs $75k-100k, 140.0% for AGIs $100k-200k)
Ordinary dividends: $3,800 (reported on 23.0% of returns)
Here:
$3,800
State:
$9,061
(% of AGI for various income ranges: 17.3% for AGIs below $25k, 59.2% for AGIs $25k-50k, 58.9% for AGIs $50k-75k, 134.0% for AGIs $75k-100k, 715.0% for AGIs $100k-200k)
Net capital gain/loss in AGI: +$11,364 (reported on 18.9% of returns)
Here:
+$11,364
State:
+$31,684
(% of AGI for various income ranges: 10.0% for AGIs below $25k, 25.0% for AGIs $25k-50k, 64.4% for AGIs $50k-75k, 46.0% for AGIs $75k-100k, 566.7% for AGIs $100k-200k)
Profit/loss from business: +$6,490 (reported on 13.5% of returns)
Here:
+$6,490
State:
+$12,175
(% of AGI for various income ranges: 103.3% for AGIs below $25k, 447.8% for AGIs $50k-75k, 151.7% for AGIs $100k-200k)
Taxable individual retirement arrangement distribution: $10,120 (reported on 13.5% of returns)
61740:
$10,120
Illinois:
$21,613
(% of AGI for various income ranges: 128.0% for AGIs below $25k, 494.4% for AGIs $50k-75k, 625.0% for AGIs $100k-200k)
Earned income credit: $2,575 (reported on 10.8% of returns)
Here:
$2,575
State:
$2,311
(% of AGI for various income ranges: 97.3% for AGIs below $25k, 50.0% for AGIs $25k-50k)
Percentage of individuals using paid preparers for their 2020 taxes: 93.2%
Here:
93%
State:
93%
(% for various income ranges: 90.5% for AGIs below $25k, 93.8% for AGIs $25k-50k, 92.3% for AGIs $50k-75k, 88.9% for AGIs $75k-100k, 100.0% for AGIs $100k-200k, 100.0% for AGIs over 200k)
Averages for the 2012 tax year for zip code 61740, filed in 2013:
Average Adjusted Gross Income (AGI) in 2012: $61,033 (Individual Income Tax Returns)
Here:
$61,033
State:
$68,058
Salary/wage: $42,125 (reported on 80.0% of returns)
Here:
$42,125
State:
$55,396
(% of AGI for various income ranges: 68.8% for AGIs below $25k, 70.3% for AGIs $25k-50k, 69.7% for AGIs $50k-75k, 64.5% for AGIs $75k-100k, 69.5% for AGIs $100k-200k)
Taxable interest for individuals: $1,284 (reported on 49.3% of returns)
This zip code:
$1,284
Illinois:
$1,969
(% of AGI for various income ranges: 1.6% for AGIs below $25k, 1.9% for AGIs $25k-50k, 1.0% for AGIs $50k-75k, 1.0% for AGIs $75k-100k, 1.2% for AGIs $100k-200k)
Ordinary dividends: $1,805 (reported on 26.7% of returns)
Here:
$1,805
State:
$7,786
(% of AGI for various income ranges: 1.8% for AGIs below $25k, 0.9% for AGIs $25k-50k, 1.0% for AGIs $50k-75k, 0.4% for AGIs $75k-100k, 1.2% for AGIs $100k-200k)
Net capital gain/loss in AGI: +$1,447 (reported on 20.0% of returns)
Here:
+$1,447
State:
+$22,183
(% of AGI for various income ranges: 0.4% for AGIs $50k-75k, 0.6% for AGIs $75k-100k, 1.4% for AGIs $100k-200k)
Profit/loss from business: +$4,889 (reported on 12.0% of returns)
Here:
+$4,889
State:
+$12,903
(% of AGI for various income ranges: 5.4% for AGIs below $25k, 2.4% for AGIs $25k-50k, 1.6% for AGIs $75k-100k)
Taxable individual retirement arrangement distribution: $7,350 (reported on 10.7% of returns)
61740:
$7,350
Illinois:
$17,929
(% of AGI for various income ranges: 8.4% for AGIs below $25k, 2.2% for AGIs $50k-75k, 1.4% for AGIs $100k-200k)
Total itemized deductions: $17,729 (16% of AGI, reported on 28.0% of returns)
Here:
$17,729
State:
$26,433
Here:
16.3% of AGI
State:
19.2% of AGI
(% of AGI for various income ranges: 12.6% for AGIs $25k-50k, 8.4% for AGIs $50k-75k, 8.6% for AGIs $75k-100k, 13.1% for AGIs $100k-200k)
Charity contributions: $3,156 (reported on 21.3% of returns)
Here:
$3,156
State:
$4,525
(% of AGI for various income ranges: 1.3% for AGIs $25k-50k, 0.5% for AGIs $50k-75k, 0.9% for AGIs $75k-100k, 2.5% for AGIs $100k-200k)
Taxes paid: $7,725 (reported on 26.7% of returns)
61740:
$7,725
State:
$11,968
(% of AGI for various income ranges: 3.0% for AGIs $25k-50k, 2.6% for AGIs $50k-75k, 3.7% for AGIs $75k-100k, 6.9% for AGIs $100k-200k)
Earned income credit: $2,245 (reported on 14.7% of returns)
Here:
$2,245
State:
$2,349
(% of AGI for various income ranges: 6.3% for AGIs below $25k, 0.8% for AGIs $25k-50k)
Percentage of individuals using paid preparers for their 2012 taxes: 66.7%
Here:
67%
State:
57%
(% for various income ranges: 57.7% for AGIs below $25k, 64.7% for AGIs $25k-50k, 72.7% for AGIs $50k-75k, 66.7% for AGIs $75k-100k, 100.0% for AGIs $100k-200k)
Averages for the 2004 tax year for zip code 61740, filed in 2005:
Average Adjusted Gross Income (AGI) in 2004: $39,494 (Individual Income Tax Returns)
Here:
$39,494
State:
$54,625
Salary/wage: $34,496 (reported on 81.5% of returns)
Here:
$34,496
State:
$46,811
(% of AGI for various income ranges: 96.7% for AGIs below $10k, 69.4% for AGIs $10k-25k, 70.2% for AGIs $25k-50k, 74.4% for AGIs $50k-75k, 70.3% for AGIs $75k-100k, 67.2% for AGIs over 100k)
Taxable interest for individuals: $1,489 (reported on 59.0% of returns)
This zip code:
$1,489
Illinois:
$2,101
(% of AGI for various income ranges: 10.9% for AGIs below $10k, 4.9% for AGIs $10k-25k, 3.6% for AGIs $25k-50k, 1.5% for AGIs $50k-75k, 0.5% for AGIs $75k-100k, 0.9% for AGIs over 100k)
Taxable dividends: $1,302 (reported on 30.6% of returns)
Here:
$1,302
State:
$4,306
(% of AGI for various income ranges: 4.9% for AGIs below $10k, 2.2% for AGIs $10k-25k, 1.4% for AGIs $25k-50k, 0.8% for AGIs $50k-75k, 0.6% for AGIs $75k-100k, 0.3% for AGIs over 100k)
Net capital gain/loss: +$2,540 (reported on 20.9% of returns)
Here:
+$2,540
State:
+$17,321
(% of AGI for various income ranges: -5.0% for AGIs below $10k, -0.5% for AGIs $10k-25k, 3.2% for AGIs $25k-50k, 0.9% for AGIs $50k-75k, 2.1% for AGIs $75k-100k, 0.6% for AGIs over 100k)
Profit/loss from business: +$3,637 (reported on 14.7% of returns)
Here:
+$3,637
State:
+$11,771
(% of AGI for various income ranges: -3.6% for AGIs below $10k, 5.0% for AGIs $10k-25k, 2.3% for AGIs $25k-50k, 0.2% for AGIs $50k-75k, 1.9% for AGIs $75k-100k)
Profit/loss from farming: +$12,167 (reported on 10.7% of returns)
Here:
+$12,167
State:
+$2,327
(% of AGI for various income ranges: 1.9% for AGIs below $10k, -1.7% for AGIs $10k-25k, -0.7% for AGIs $25k-50k, 5.3% for AGIs $50k-75k, 12.4% for AGIs $75k-100k)
IRA payment deduction: $2,828 (reported on 3.4% of returns)
61740:
$2,828
Illinois:
$3,087
Total itemized deductions: $16,179 (29% of AGI, reported on 25.9% of returns)
Here:
$16,179
State:
$20,239
Here:
29.2% of AGI
State:
19.5% of AGI
(% of AGI for various income ranges: 40.6% for AGIs below $10k, 15.6% for AGIs $10k-25k, 11.6% for AGIs $25k-50k, 9.9% for AGIs $50k-75k, 8.9% for AGIs $75k-100k, 6.3% for AGIs over 100k)
Charity contributions deductions: $2,544 (4% of AGI, reported on 21.4% of returns)
Here:
$2,544
State:
$3,719
Here:
4.3% of AGI
State:
3.4% of AGI
(% of AGI for various income ranges: 1.7% for AGIs $10k-25k, 1.1% for AGIs $25k-50k, 1.4% for AGIs $50k-75k, 1.7% for AGIs $75k-100k, 1.4% for AGIs over 100k)
Total tax: $5,186 (reported on 77.1% of returns)
61740:
$5,186
State:
$9,882
(% of AGI for various income ranges: 1.9% for AGIs below $10k, 4.8% for AGIs $10k-25k, 6.8% for AGIs $25k-50k, 9.2% for AGIs $50k-75k, 11.4% for AGIs $75k-100k, 17.6% for AGIs over 100k)
Earned income credit: $1,797 (reported on 9.4% of returns)
Here:
$1,797
State:
$1,788
Percentage of individuals using paid preparers for their 2004 taxes: 72.9%
Here:
73%
State:
61%
(% for various income ranges: 68.9% for AGIs below $10k, 75.6% for AGIs $10k-25k, 70.0% for AGIs $25k-50k, 76.3% for AGIs $50k-75k, 80.0% for AGIs $75k-100k, 72.5% for AGIs over 100k)
Household received Food Stamps/SNAP in the past 12 months: 84 Household did not receive Food Stamps/SNAP in the past 12 months: 530
Women who had a birth in the past 12 months: 16 (8 now married, 7 unmarried) Women who did not have a birth in the past 12 months: 244 (119 now married, 124 unmarried)
Housing units in zip code 61740 with a mortgage: 246 (8 second mortgage, 4 home equity loan, 1 both second mortgage and home equity loan) Houses without a mortgage: 6
Median monthly owner costs for units with a mortgage: $1,072 Median monthly owner costs for units without a mortgage: $641
Residents with income below the poverty level in 2022:
This zip code:
6.9%
Whole state:
11.9%
Residents with income below 50% of the poverty level in 2022:
This zip code:
2.7%
Whole state:
5.7%
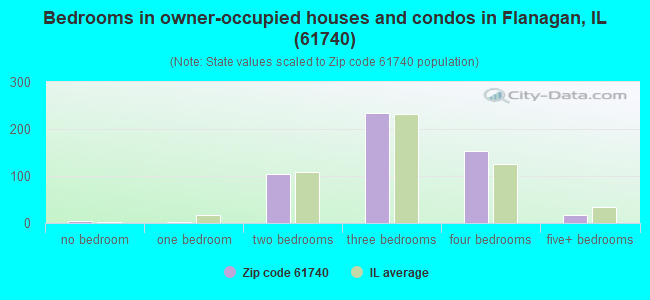
Median number of rooms in houses and condos:
Here:
6.8
State:
6.4
Median number of rooms in apartments:
Here:
4.6
State:
4.1
Notable locations in this zip code not listed on our city pages
Notable locations in zip code 61740: Flanagan Graymont Fire Protection District (A), Salem Childrens Home (B), Flanagan - Graymont Emergency Ambulance Service (C). Display/hide their locations on the map
Churches in zip code 61740 include: Saint Petri Lutheran Church (A), Flanagan Church (B), Waldo Church (C), Flanagan United Methodist Church (D). Display/hide their locations on the map
Cemeteries: Mount Zion Cemetery (1), Saint Joseph's Catholic Cemetery (2), Saint Petri Evangelical Cemetery (3), Pike Cemetery (4), Center Cemetery (5). Display/hide their locations on the map
In group quarters: 93 (-1 institutionalized population)
Size of family households: 224 2-persons, 57 3-persons, 96 4-persons, 31 5-persons, 16 6-persons, 9 7-or-more-persons
Size of nonfamily households: 170 1-person, 7 2-persons
212 married couples with children.
117 single-parent households (64 men, 53 women).
97.6% of residents of 61740 zip code speak English at home.
1.9% of residents speak Spanish at home (25% very well, 75% well).
0.4% of residents speak other Indo-European language at home (100% very well).
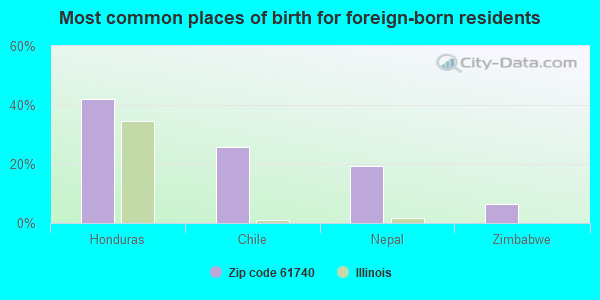
Foreign born population: 31 (2.0%) (55.0% of them are naturalized citizens)
This zip code:
2.0%
Whole state:
14.4%
42%Honduras
26%Chile
19%Nepal
6%Zimbabwe
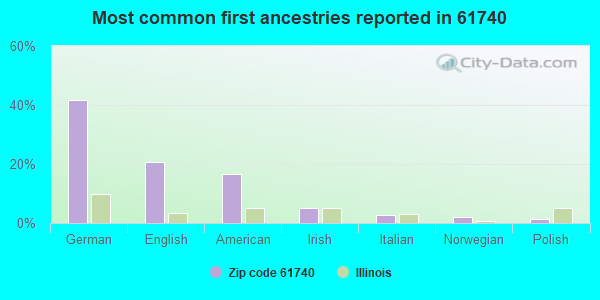
42%German
21%English
17%American
5%Irish
3%Italian
2%Norwegian
2%Polish
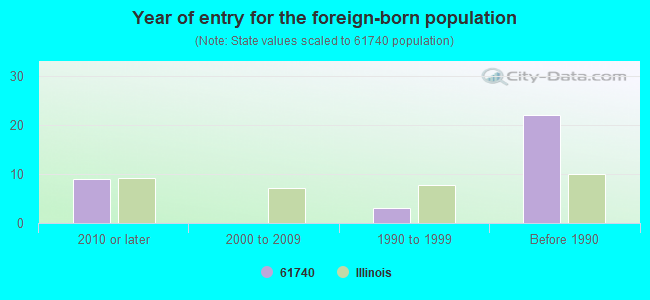
Year of entry for the foreign-born population
92010 or later
02000 to 2009
31990 to 1999
22Before 1990
Facilities with environmental interests located in this zip code:
MEILS GARAGE (EAST LUMBER ST in FLANAGAN, IL)
STATE MASTER (Illinois EPA Project) - AIR PROGRAM AIR MINOR (AIRS/AFS) Business SIC classification: PETROLEUM BULK STATIONS AND TERMINALS
PRAIRIE CENTRAL COOPERATIVE INC (101 S MAIN ST in FLANAGAN, IL)
STATE MASTER (Illinois EPA Project) - AIR PROGRAM AIR MINOR (AIRS/AFS) CRITERIA AND HAZARDOUS AIR POLLUTANT INVENTORY (Inventory of air pollution sources) Business SIC classification: GRAIN AND FIELD BEANS
HAPS OIL CO (CORNER E LUMBER S PARK in FLANAGAN, IL)
STATE MASTER (Illinois EPA Project) - AIR PROGRAM AIR MINOR (AIRS/AFS) Business SIC classification: PETROLEUM BULK STATIONS AND TERMINALS
SALEM CHILDRENS HOME (15161 N 400 EAST ROAD in FLANAGAN, IL)
STATE MASTER (Illinois EPA Project) - National Pollutant Discharge Elimination System Permit National Pollutant Discharge Elimination System NON-MAJOR (Tracking pollutant discharge elimination systems) - permit Business SIC classification: RESIDENTIAL CARE Alternative names: SALEM CHILDREN'S HOME-FLANAGAN, SALEM CHILDREN'S HOME-FLANNAGN
Housing units lacking complete plumbing facilities: 1.7% Housing units lacking complete kitchen facilities: 2.1%
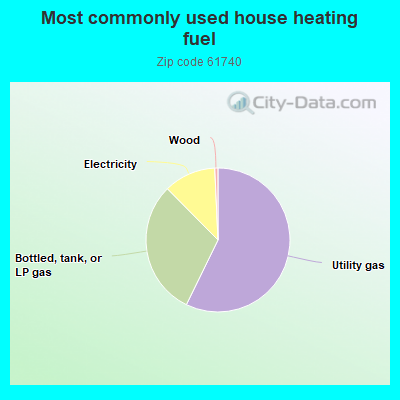
57.3%Utility gas
30.4%Bottled, tank, or LP gas
11.7%Electricity
0.7%Wood
Population in 1990: 1,424. Population change in the 1990s: +322 (+22.6%).
Place of birth for U.S.-born residents:
This state: 1,381
Northeast: 3
Midwest: 68
South: 19
West: 20
63% of the 61740 zip code residents lived in the same house 5 years ago. Out of people who lived in different houses, 58% lived in this county. Out of people who lived in different counties, 50% lived in Illinois.
94% of the 61740 zip code residents lived in the same house 1 year ago. Out of people who lived in different houses, 56% moved from this county. Out of people who lived in different houses, 6% moved from different county within same state. Out of people who lived in different houses, 35% moved from different state.
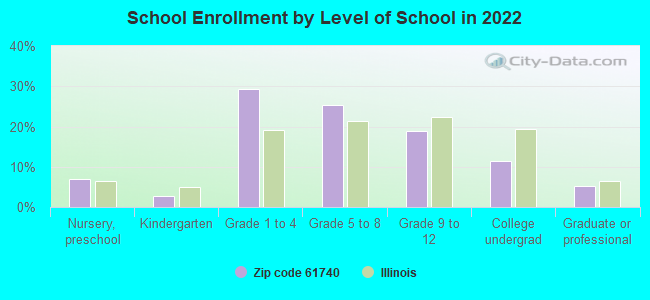
Private vs. public school enrollment:
Students in private schools in grades 1 to 8 (elementary and middle school): 3
Here:
1.4%
Illinois:
13.3%
Students in private schools in grades 9 to 12 (high school):
Here:
0.0%
Illinois:
9.9%
Students in private undergraduate colleges: 6
Here:
14.0%
Illinois:
27.4%
Occupation by median earnings in the past 12 months ($)
95,082Transportation occupations
85,082Sales and related occupations
74,264Business and financial operations occupations
70,310Architecture and engineering occupations
61,636Production occupations
59,204Construction and extraction occupations
Top industries in this zip code by the number of employees in 2005:
Health Care and Social Assistance: Continuing Care Retirement Communities (100-249 employees: 1 establishment)
Health Care and Social Assistance: Nursing Care Facilities (50-99: 1)
Health Care and Social Assistance: Other Residential Care Facilities (20-49: 1)
Finance and Insurance: Commercial Banking (10-19: 1)
Accommodation and Food Services: Drinking Places (Alcoholic Beverages) (10-19: 1)
Other Services (except Public Administration): Religious Organizations (5-9: 1, 1-4: 2)
Wholesale Trade: Farm and Garden Machinery and Equipment Merchant Wholesalers (5-9: 1, 1-4: 1)
People in group quarters in 2010:
92 people in nursing facilities/skilled-nursing facilities
28 people in workers' group living quarters and job corps centers
People in group quarters in 2000:
119 people in other noninstitutional group quarters
27 people in homes for abused, dependent, and neglected children
2002 - 2018 National Fire Incident Reporting System (NFIRS) incidents
Based on the data from the years 2002 - 2018 the average number of fires per year is 9. The highest number of fires - 20 took place in 2009, and the least - 0 in 2017. The data has a declining trend.
When looking into fire subcategories, the most incidents belonged to: Structure Fires (41.8%), and Outside Fires (41.2%).
Fire incident types reported to NFIRS in Zip Code 61740

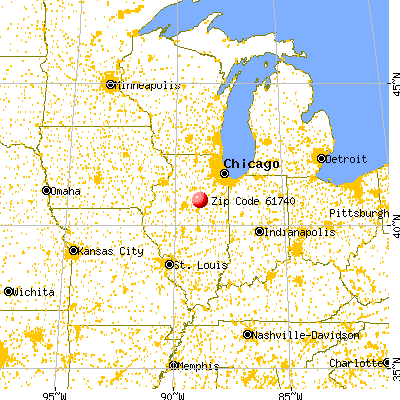


 Nearest zip codes: 61743, 61333, 61321, 61744, 61311, 61760.
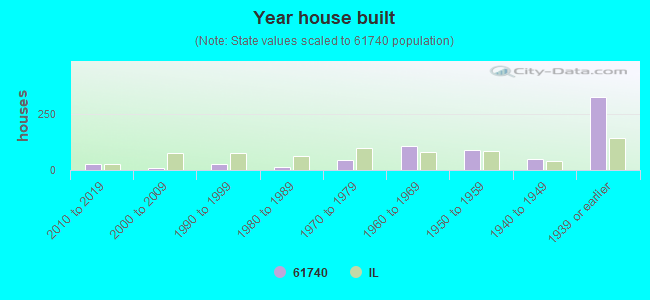


 Based on the data from the years 2002 - 2018 the average number of fires per year is 9. The highest number of fires - 20 took place in 2009, and the least - 0 in 2017. The data has a declining trend.
 When looking into fire subcategories, the most incidents belonged to: Structure Fires (41.8%), and Outside Fires (41.2%).