Estimated zip code population in 2022: 2,542 Zip code population in 2010: 1,808 Zip code population in 2000: 1,335
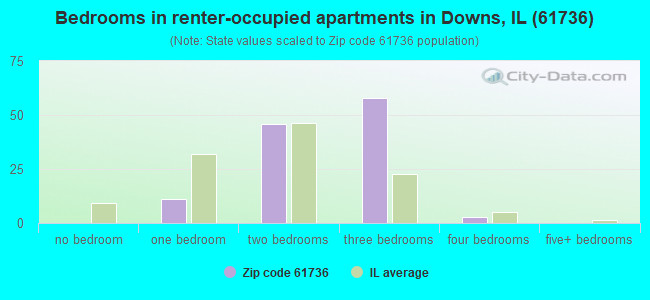
Houses and condos: 939 Renter-occupied apartments: 120
% of renters here:
13%
State:
33%
March 2022 cost of living index in zip code 61736: 86.4 (less than average, U.S. average is 100)
Land area: 36.8 sq. mi. Water area: 0.0 sq. mi.
Population density: 69 people per square mile
(very low).
OSM Map
General Map
Google Map
MSN Map
OSM Map
General Map
Google Map
MSN Map
OSM Map
General Map
Google Map
MSN Map
OSM Map
General Map
Google Map
MSN Map
Please wait while loading the map...
Real estate property taxes paid for housing units in 2022:
This zip code:
2.0% ($6,110)
Illinois:
2.0% ($4,912)
Median real estate property taxes paid for housing units with mortgages in 2022: $7,197 (2.1%) Median real estate property taxes paid for housing units with no mortgage in 2022: $4,841 (1.9%)
Business Search- 14 Million verified businesses
Males: 1,228
(48.3%)
Females: 1,314
(51.7%)
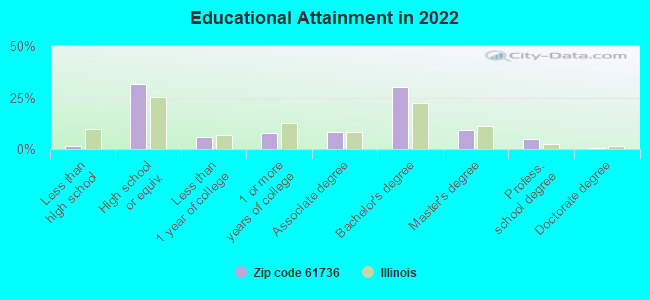
For population 25 years and over in 61736:
High school or higher: 98.9%
Bachelor's degree or higher: 45.1%
Graduate or professional degree: 15.1%
Unemployed: 0.9%
Mean travel time to work (commute): 22.3 minutes
For population 15 years and over in 61736:
Never married: 21.9%
Now married: 57.3%
Separated: 0.4%
Widowed: 11.1%
Divorced: 9.3%
Zip code 61736 compared to state average:
Unemployed percentage significantly below state average.
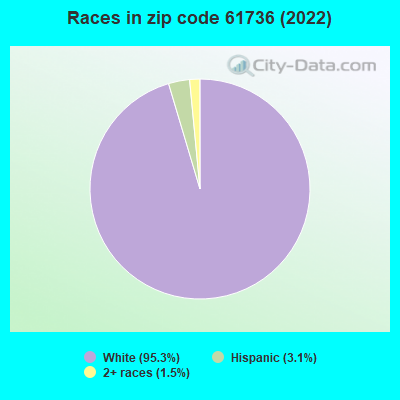
Black race population percentage significantly below state average.
Hispanic race population percentage significantly below state average.
Foreign-born population percentage significantly below state average.
Renting percentage significantly below state average.
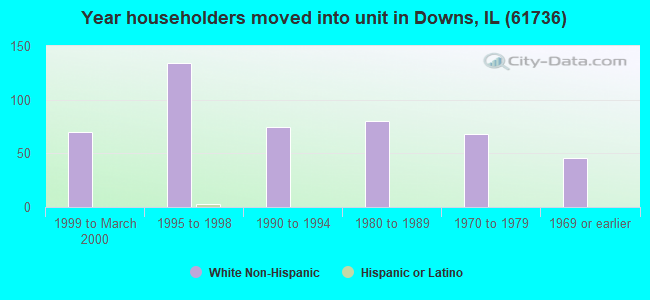
Length of stay since moving in above state average.
Averages for the 2020 tax year for zip code 61736, filed in 2021:
Average Adjusted Gross Income (AGI) in 2020: $104,905 (Individual Income Tax Returns)
Here:
$104,905
State:
$82,626
Salary/wage: $84,143 (reported on 83.8% of returns)
Here:
$84,143
State:
$66,640
(% of AGI for various income ranges: 1276.9% for AGIs below $25k, 3702.5% for AGIs $25k-50k, 5908.8% for AGIs $50k-75k, 8484.3% for AGIs $75k-100k, 19999.3% for AGIs $100k-200k, 61720.0% for AGIs over 200k)
Taxable interest for individuals: $1,173 (reported on 55.6% of returns)
This zip code:
$1,173
Illinois:
$2,376
(% of AGI for various income ranges: 23.1% for AGIs below $25k, 29.2% for AGIs $25k-50k, 83.8% for AGIs $50k-75k, 55.7% for AGIs $75k-100k, 103.6% for AGIs $100k-200k, 805.0% for AGIs over 200k)
Ordinary dividends: $3,882 (reported on 28.3% of returns)
Here:
$3,882
State:
$9,061
(% of AGI for various income ranges: 31.9% for AGIs below $25k, 32.5% for AGIs $25k-50k, 100.0% for AGIs $50k-75k, 70.0% for AGIs $75k-100k, 258.6% for AGIs $100k-200k, 1265.0% for AGIs over 200k)
Net capital gain/loss in AGI: +$9,750 (reported on 24.2% of returns)
Here:
+$9,750
State:
+$31,684
(% of AGI for various income ranges: 16.9% for AGIs below $25k, 182.5% for AGIs $50k-75k, 188.6% for AGIs $100k-200k, 4757.5% for AGIs over 200k)
Profit/loss from business: +$20,450 (reported on 12.1% of returns)
Here:
+$20,450
State:
+$12,175
(% of AGI for various income ranges: 111.2% for AGIs below $25k, 243.3% for AGIs $25k-50k, 1417.1% for AGIs $100k-200k)
Taxable individual retirement arrangement distribution: $26,033 (reported on 9.1% of returns)
61736:
$26,033
Illinois:
$21,613
(% of AGI for various income ranges: 83.8% for AGIs below $25k, 477.5% for AGIs $50k-75k, 1305.0% for AGIs $100k-200k)
Total itemized deductions: $31,212 (reported on 8.1% of returns)
Here:
$31,212
State:
$34,948
(% of AGI for various income ranges: 1395.7% for AGIs $75k-100k, 3800.0% for AGIs over 200k)
Charity contributions: $15,333 (reported on 6.1% of returns)
Here:
$15,333
State:
$13,122
(% of AGI for various income ranges: 225.7% for AGIs $75k-100k, 1905.0% for AGIs over 200k)
Taxes paid: $8,000 (reported on 8.1% of returns)
61736:
$8,000
State:
$8,563
(% of AGI for various income ranges: 418.6% for AGIs $75k-100k, 867.5% for AGIs over 200k)
Earned income credit: $1,838 (reported on 8.1% of returns)
Here:
$1,838
State:
$2,311
(% of AGI for various income ranges: 58.8% for AGIs below $25k, 44.2% for AGIs $25k-50k)
Percentage of individuals using paid preparers for their 2020 taxes: 91.9%
Here:
92%
State:
93%
(% for various income ranges: 88.5% for AGIs below $25k, 93.8% for AGIs $25k-50k, 90.0% for AGIs $50k-75k, 90.0% for AGIs $75k-100k, 92.3% for AGIs $100k-200k, 100.0% for AGIs over 200k)
Averages for the 2012 tax year for zip code 61736, filed in 2013:
Average Adjusted Gross Income (AGI) in 2012: $77,271 (Individual Income Tax Returns)
Here:
$77,271
State:
$68,058
Salary/wage: $64,608 (reported on 88.4% of returns)
Here:
$64,608
State:
$55,396
(% of AGI for various income ranges: 77.6% for AGIs below $25k, 80.5% for AGIs $25k-50k, 75.2% for AGIs $50k-75k, 75.2% for AGIs $75k-100k, 77.9% for AGIs $100k-200k, 64.5% for AGIs over 200k)
Taxable interest for individuals: $728 (reported on 53.5% of returns)
This zip code:
$728
Illinois:
$1,969
(% of AGI for various income ranges: 0.6% for AGIs below $25k, 0.6% for AGIs $25k-50k, 0.4% for AGIs $50k-75k, 0.3% for AGIs $75k-100k, 0.3% for AGIs $100k-200k, 0.9% for AGIs over 200k)
Ordinary dividends: $2,404 (reported on 29.1% of returns)
Here:
$2,404
State:
$7,786
(% of AGI for various income ranges: 0.6% for AGIs below $25k, 0.4% for AGIs $25k-50k, 0.3% for AGIs $50k-75k, 0.6% for AGIs $75k-100k, 1.1% for AGIs $100k-200k, 1.3% for AGIs over 200k)
Net capital gain/loss in AGI: +$3,193 (reported on 17.4% of returns)
Here:
+$3,193
State:
+$22,183
(% of AGI for various income ranges: 0.3% for AGIs $100k-200k, 2.4% for AGIs over 200k)
Profit/loss from business: +$10,227 (reported on 12.8% of returns)
Here:
+$10,227
State:
+$12,903
(% of AGI for various income ranges: 5.5% for AGIs $25k-50k, 2.2% for AGIs $75k-100k, 2.4% for AGIs $100k-200k)
Taxable individual retirement arrangement distribution: $16,025 (reported on 9.3% of returns)
61736:
$16,025
Illinois:
$17,929
(% of AGI for various income ranges: 6.2% for AGIs below $25k, 6.9% for AGIs $50k-75k, 3.0% for AGIs $100k-200k)
Total itemized deductions: $22,164 (18% of AGI, reported on 45.3% of returns)
Here:
$22,164
State:
$26,433
Here:
17.9% of AGI
State:
19.2% of AGI
(% of AGI for various income ranges: 15.7% for AGIs $25k-50k, 11.1% for AGIs $50k-75k, 13.7% for AGIs $75k-100k, 15.1% for AGIs $100k-200k, 11.7% for AGIs over 200k)
Charity contributions: $4,683 (reported on 34.9% of returns)
Here:
$4,683
State:
$4,525
(% of AGI for various income ranges: 1.1% for AGIs $25k-50k, 0.9% for AGIs $50k-75k, 1.9% for AGIs $75k-100k, 2.6% for AGIs $100k-200k, 2.8% for AGIs over 200k)
Taxes paid: $10,869 (reported on 45.3% of returns)
61736:
$10,869
State:
$11,968
(% of AGI for various income ranges: 5.5% for AGIs $25k-50k, 5.0% for AGIs $50k-75k, 6.7% for AGIs $75k-100k, 7.4% for AGIs $100k-200k, 6.7% for AGIs over 200k)
Earned income credit: $1,757 (reported on 8.1% of returns)
Here:
$1,757
State:
$2,349
(% of AGI for various income ranges: 2.7% for AGIs below $25k, 0.8% for AGIs $25k-50k)
Percentage of individuals using paid preparers for their 2012 taxes: 43.0%
Here:
43%
State:
57%
(% for various income ranges: 32.0% for AGIs below $25k, 50.0% for AGIs $25k-50k, 50.0% for AGIs $50k-75k, 46.2% for AGIs $75k-100k, 41.2% for AGIs $100k-200k, 60.0% for AGIs over 200k)
Averages for the 2004 tax year for zip code 61736, filed in 2005:
Average Adjusted Gross Income (AGI) in 2004: $53,843 (Individual Income Tax Returns)
Here:
$53,843
State:
$54,625
Salary/wage: $49,083 (reported on 90.7% of returns)
Here:
$49,083
State:
$46,811
(% of AGI for various income ranges: 116.9% for AGIs below $10k, 76.6% for AGIs $10k-25k, 84.8% for AGIs $25k-50k, 79.6% for AGIs $50k-75k, 87.5% for AGIs $75k-100k, 80.6% for AGIs over 100k)
Taxable interest for individuals: $923 (reported on 59.9% of returns)
This zip code:
$923
Illinois:
$2,101
(% of AGI for various income ranges: 6.4% for AGIs below $10k, 1.9% for AGIs $10k-25k, 0.7% for AGIs $25k-50k, 1.0% for AGIs $50k-75k, 1.0% for AGIs $75k-100k, 0.9% for AGIs over 100k)
Taxable dividends: $1,392 (reported on 26.8% of returns)
Here:
$1,392
State:
$4,306
(% of AGI for various income ranges: 1.8% for AGIs below $10k, 1.1% for AGIs $10k-25k, 0.4% for AGIs $25k-50k, 0.8% for AGIs $50k-75k, 0.4% for AGIs $75k-100k, 0.8% for AGIs over 100k)
Net capital gain/loss: +$236 (reported on 16.5% of returns)
Here:
+$236
State:
+$17,321
(% of AGI for various income ranges: 4.4% for AGIs below $10k, -0.2% for AGIs $25k-50k, 0.1% for AGIs $50k-75k, -0.3% for AGIs $75k-100k, 0.3% for AGIs over 100k)
Profit/loss from business: +$9,874 (reported on 15.9% of returns)
Here:
+$9,874
State:
+$11,771
(% of AGI for various income ranges: -0.7% for AGIs below $10k, 2.8% for AGIs $25k-50k, 2.2% for AGIs $50k-75k, 3.1% for AGIs $75k-100k, 3.8% for AGIs over 100k)
IRA payment deduction: $2,950 (reported on 2.4% of returns)
61736:
$2,950
Illinois:
$3,087
Total itemized deductions: $16,521 (19% of AGI, reported on 42.8% of returns)
Here:
$16,521
State:
$20,239
Here:
19.2% of AGI
State:
19.5% of AGI
(% of AGI for various income ranges: 12.8% for AGIs $10k-25k, 10.9% for AGIs $25k-50k, 13.3% for AGIs $50k-75k, 14.3% for AGIs $75k-100k, 13.7% for AGIs over 100k)
Charity contributions deductions: $2,977 (3% of AGI, reported on 35.6% of returns)
Here:
$2,977
State:
$3,719
Here:
3.2% of AGI
State:
3.4% of AGI
(% of AGI for various income ranges: 4.2% for AGIs below $10k, 1.3% for AGIs $25k-50k, 1.8% for AGIs $50k-75k, 1.9% for AGIs $75k-100k, 2.6% for AGIs over 100k)
Total tax: $7,473 (reported on 81.8% of returns)
61736:
$7,473
State:
$9,882
(% of AGI for various income ranges: 2.9% for AGIs below $10k, 4.9% for AGIs $10k-25k, 7.5% for AGIs $25k-50k, 8.5% for AGIs $50k-75k, 10.2% for AGIs $75k-100k, 16.6% for AGIs over 100k)
Earned income credit: $1,843 (reported on 8.3% of returns)
Here:
$1,843
State:
$1,788
Percentage of individuals using paid preparers for their 2004 taxes: 47.2%
Here:
47%
State:
61%
(% for various income ranges: 39.1% for AGIs below $10k, 47.5% for AGIs $10k-25k, 48.1% for AGIs $25k-50k, 52.4% for AGIs $50k-75k, 47.8% for AGIs $75k-100k, 47.7% for AGIs over 100k)
Household received Food Stamps/SNAP in the past 12 months: 48 Household did not receive Food Stamps/SNAP in the past 12 months: 874
Women who had a birth in the past 12 months: 4 (4 now married, 0 unmarried) Women who did not have a birth in the past 12 months: 576 (316 now married, 256 unmarried)
Housing units in zip code 61736 with a mortgage: 460 (26 second mortgage, 26 both second mortgage and home equity loan) Houses without a mortgage: 3
Median monthly owner costs for units with a mortgage: $2,061 Median monthly owner costs for units without a mortgage: $781
Residents with income below the poverty level in 2022:
This zip code:
10.0%
Whole state:
11.9%
Residents with income below 50% of the poverty level in 2022:
This zip code:
0.2%
Whole state:
5.7%
Median number of rooms in houses and condos:
Here:
7.5
State:
6.4
Median number of rooms in apartments:
Here:
5.9
State:
4.1
Notable locations in this zip code not listed on our city pages
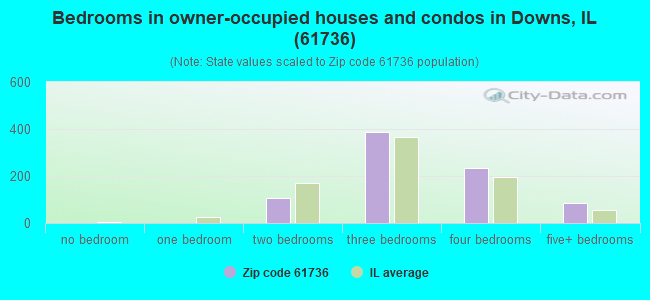
Size of family households: 300 2-persons, 127 3-persons, 179 4-persons, 77 5-persons, 6 6-persons, 3 7-or-more-persons
Size of nonfamily households: 171 1-person, 62 2-persons
656 married couples with children.
139 single-parent households (42 men, 97 women).
99.1% of residents of 61736 zip code speak English at home.
0.3% of residents speak Spanish at home (100% very well).
Foreign born population: 30 (1.2%) (60.2% of them are naturalized citizens)
This zip code:
1.2%
Whole state:
14.4%
17%Guyana
13%Greece
13%Czechoslovakia (includes Czech Republic and Slovakia)
10%North Macedonia (Macedonia)
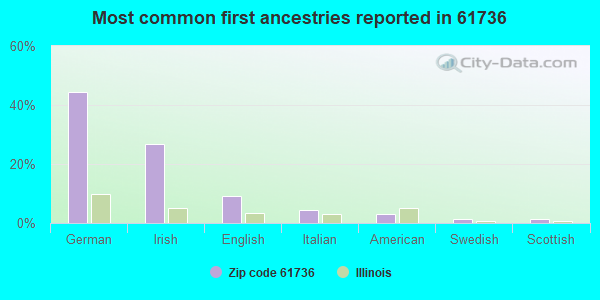
45%German
27%Irish
9%English
4%Italian
3%American
1%Swedish
1%Scottish
Year of entry for the foreign-born population
02010 or later
102000 to 2009
01990 to 1999
23Before 1990
Major facilities with environmental interests located in this zip code:
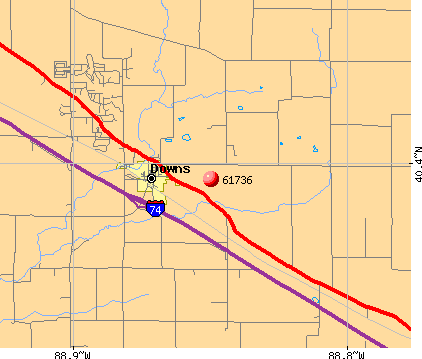
ROWE CONSTRUCTION CO (COUNTY HWY 36 in DOWNS, IL)
STATE MASTER (Illinois EPA Project) - AIR PROGRAM STATE MASTER (Illinois EPA Project) - National Pollutant Discharge Elimination System Permit AIR MINOR (AIRS/AFS) CRITERIA AND HAZARDOUS AIR POLLUTANT INVENTORY (Inventory of air pollution sources) National Pollutant Discharge Elimination System NON-MAJOR (Tracking pollutant discharge elimination systems) - permit Business SIC classification: CONSTRUCTION SAND AND GRAVEL Alternative names: ROWE CONSTRUCTION CO-ROWE PIT 95, ROWE CONSTRUCTION-HALL GRVL 8
ROWE CONSTRUCTION CO-PIT 75 (JUST OFF I 74 in DOWNS, IL)
STATE MASTER (Illinois EPA Project) - AIR PROGRAM AIR MINOR (AIRS/AFS) CRITERIA AND HAZARDOUS AIR POLLUTANT INVENTORY (Inventory of air pollution sources) Business SIC classification: CONSTRUCTION SAND AND GRAVEL Alternative names: ROWE CONSTRUCTION COMPANY, ROWE CONSTRUCTION CO.-ROWE PIT 95
MALLARD POINT DEVELOPMENT (P.O. BOX 83 in DOWNS, IL)
STATE MASTER (Illinois EPA Project) - AIR PROGRAM AIR MINOR (AIRS/AFS) Business SIC classification: NONCLASSIFIABLE ESTABLISHMENTS
MALLARD POINT SUBDIVISION (WEST MAIN STREET in DOWNS, IL)
STATE MASTER (Illinois EPA Project) - National Pollutant Discharge Elimination System Permit National Pollutant Discharge Elimination System NON-MAJOR (Tracking pollutant discharge elimination systems) - permit Business SIC classification: PRIVATE HOUSEHOLDS
MALLINGHAM HOMEOWNERS ASSN (19851 WESLEY STREET in DOWNS, IL)
STATE MASTER (Illinois EPA Project) - National Pollutant Discharge Elimination System Permit National Pollutant Discharge Elimination System NON-MAJOR (Tracking pollutant discharge elimination systems) - permit Business SIC classification: PRIVATE HOUSEHOLDS
MCLEAN COUNTY SERVICE CO (OLDTOWN TWP. in HOLDER, IL)
STATE MASTER (Illinois EPA Project) - AIR PROGRAM AIR MINOR (AIRS/AFS) Business SIC classification: NONCLASSIFIABLE ESTABLISHMENTS
OLD TOWN TIMBERS STP (RURAL ROUTE 200 EAST in DOWNS, IL)
STATE MASTER (Illinois EPA Project) - National Pollutant Discharge Elimination System Permit National Pollutant Discharge Elimination System NON-MAJOR (Tracking pollutant discharge elimination systems) - permit Business SIC classification: OPERATORS OF DWELLINGS OTHER THAN APARTMENT BUILDINGS Alternative names: OLD TOWN TIMBER HOMEOWNERS, OLD TOWN TIMBER SUBD-DOWNS
PILLSBURY CO (CITY OF in DOWNS, IL)
STATE MASTER (Illinois EPA Project) - AIR PROGRAM AIR MINOR (AIRS/AFS) Business SIC classification: GRAIN AND FIELD BEANS
ROBERTS OIL (513 E WASHINGTON in DOWNS, IL)
STATE MASTER (Illinois EPA Project) - AIR PROGRAM AIR MINOR (AIRS/AFS) Business SIC classification: PETROLEUM BULK STATIONS AND TERMINALS
ROWE CONSTRUCTION CO (DOWNS TWP. in DOWNS, IL)
STATE MASTER (Illinois EPA Project) - AIR PROGRAM AIR MINOR (AIRS/AFS) Business SIC classification: CONSTRUCTION SAND AND GRAVEL
HEAP TRUCKING (CR-2100 E & 500 N TOWNSHIP RD in DOWNS, IL)
National Pollutant Discharge Elimination System NON-MAJOR (Tracking pollutant discharge elimination systems) - permit
HOOD ROBERT G (301 E. DOOLEY in DOWNS, IL)
National Pollutant Discharge Elimination System NON-MAJOR (Tracking pollutant discharge elimination systems) - permit
IDOT (BRG 057-0127, 0122, 0123, 0124 in DOWNS, IL)
Small Quantity Generators, between 100 kg and 1000 kg of hazardous waste/month (Resource Conservation and Recovery Act (tracking hazardous waste))
Housing units lacking complete kitchen facilities: 1.5%
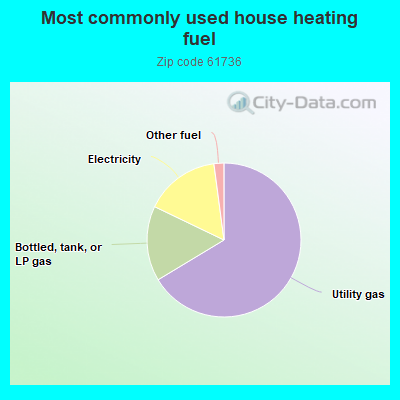
66.5%Utility gas
15.8%Bottled, tank, or LP gas
15.8%Electricity
2.1%Other fuel
Population in 1990: 992. Population change in the 1990s: +343 (+34.6%).
Place of birth for U.S.-born residents:
This state: 1,974
Northeast: 88
Midwest: 75
South: 285
West: 66
59% of the 61736 zip code residents lived in the same house 5 years ago. Out of people who lived in different houses, 80% lived in this county. Out of people who lived in different counties, 50% lived in Illinois.
91% of the 61736 zip code residents lived in the same house 1 year ago. Out of people who lived in different houses, 55% moved from this county. Out of people who lived in different houses, 30% moved from different county within same state. Out of people who lived in different houses, 15% moved from different state.
Private vs. public school enrollment:
Students in private schools in grades 1 to 8 (elementary and middle school): 68
Here:
15.6%
Illinois:
13.3%
Students in private schools in grades 9 to 12 (high school): 1
Here:
1.6%
Illinois:
9.9%
Students in private undergraduate colleges:
Here:
0.0%
Illinois:
27.4%
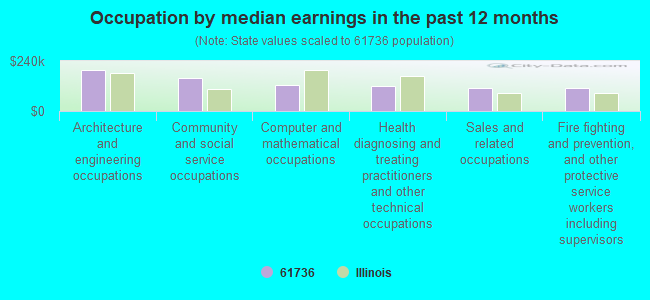
Occupation by median earnings in the past 12 months ($)
198,773Architecture and engineering occupations
158,861Community and social service occupations
125,744Computer and mathematical occupations
119,811Health diagnosing and treating practitioners and other technical occupations
112,384Sales and related occupations
110,202Fire fighting and prevention, and other protective service workers including supervisors
Top industries in this zip code by the number of employees in 2005:
Administrative and Support and Waste Management and Remediation Services: Janitorial Services (10-19 employees: 2 establishments, 5-9 employees: 2 establishments)
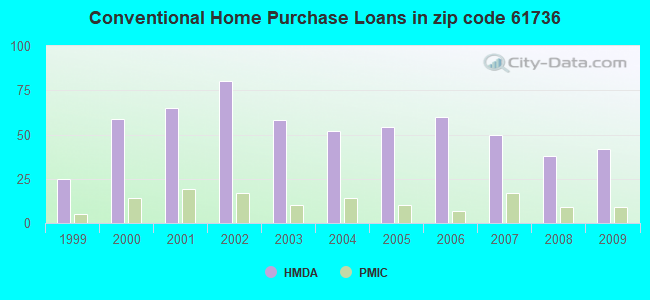
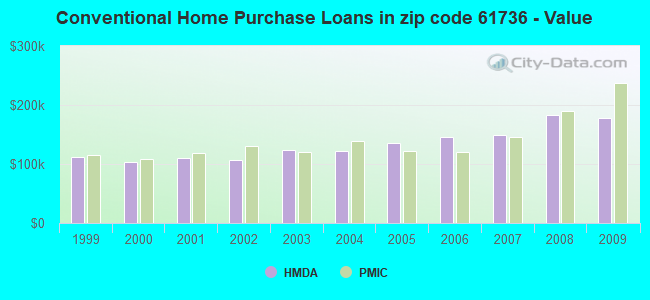
Detailed PMIC statistics for the following Tracts:0054.00
2002 - 2018 National Fire Incident Reporting System (NFIRS) incidents
Based on the data from the years 2002 - 2018 the average number of fire incidents per year is 13. The highest number of fires - 39 took place in 2015, and the least - 1 in 2018. The data has a decreasing trend.
When looking into fire subcategories, the most incidents belonged to: Outside Fires (43.5%), and Structure Fires (35.6%).
Fire incident types reported to NFIRS in Zip Code 61736

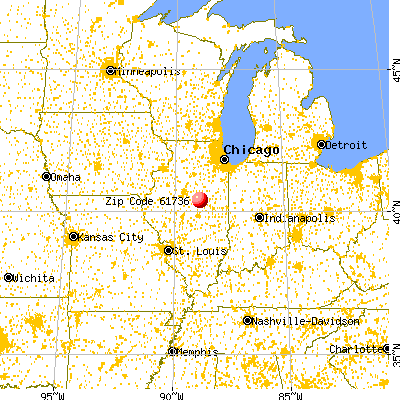


 Nearest zip codes: 61705, 61752, 61737, 61704, 61745, 61776.


 Based on the data from the years 2002 - 2018 the average number of fire incidents per year is 13. The highest number of fires - 39 took place in 2015, and the least - 1 in 2018. The data has a decreasing trend.
 When looking into fire subcategories, the most incidents belonged to: Outside Fires (43.5%), and Structure Fires (35.6%).