Estimated zip code population in 2022: 2,330 Zip code population in 2010: 2,427 Zip code population in 2000: 2,247
Houses and condos: 966 Renter-occupied apartments: 171
% of renters here:
19%
State:
33%
March 2022 cost of living index in zip code 61533: 84.5 (less than average, U.S. average is 100)
Land area: 41.0 sq. mi. Water area: 0.8 sq. mi.
Population density: 57 people per square mile
(very low).
OSM Map
General Map
Google Map
MSN Map
OSM Map
General Map
Google Map
MSN Map
OSM Map
General Map
Google Map
MSN Map
OSM Map
General Map
Google Map
MSN Map
Please wait while loading the map...
Real estate property taxes paid for housing units in 2022:
This zip code:
2.1% ($3,199)
Illinois:
2.0% ($4,912)
Median real estate property taxes paid for housing units with mortgages in 2022: $3,202 (2.2%) Median real estate property taxes paid for housing units with no mortgage in 2022: $3,010 (2.0%)
Business Search- 14 Million verified businesses
Males: 1,179
(50.6%)
Females: 1,151
(49.4%)
For population 25 years and over in 61533:
High school or higher: 93.8%
Bachelor's degree or higher: 13.6%
Graduate or professional degree: 4.7%
Unemployed: 4.4%
Mean travel time to work (commute): 25.3 minutes
For population 15 years and over in 61533:
Never married: 34.9%
Now married: 51.2%
Separated: 0.7%
Widowed: 3.2%
Divorced: 10.0%
Zip code 61533 compared to state average:
Median house value below state average.
Black race population percentage significantly below state average.
Hispanic race population percentage significantly below state average.
Foreign-born population percentage significantly below state average.
Renting percentage below state average.
Length of stay since moving in significantly above state average.
Number of college students below state average.
Percentage of population with a bachelor's degree or higher significantly below state average.
Estimated median house/condo value in 2022: $149,634
61533:
$149,634
Illinois:
$251,600
According to our research of Illinois and other state lists, there were 3 registered sex offenders living in 61533 zip code as of May 23, 2024. The ratio of all residents to sex offenders in zip code 61533 is 888 to 1. The ratio of registered sex offenders to all residents in this zip code is near the state average.
Median resident age:
This zip code:
36.0 years
Illinois median age:
39.1 years
Average household size:
This zip code:
2.6 people
Illinois:
2.4 people
Averages for the 2020 tax year for zip code 61533, filed in 2021:
Average Adjusted Gross Income (AGI) in 2020: $64,579 (Individual Income Tax Returns)
Here:
$64,579
State:
$82,626
Salary/wage: $57,283 (reported on 79.3% of returns)
Here:
$57,283
State:
$66,640
(% of AGI for various income ranges: 919.5% for AGIs below $25k, 3009.2% for AGIs $25k-50k, 5278.0% for AGIs $50k-75k, 9071.1% for AGIs $75k-100k, 13533.6% for AGIs $100k-200k)
Taxable interest for individuals: $679 (reported on 55.9% of returns)
This zip code:
$679
Illinois:
$2,376
(% of AGI for various income ranges: 26.7% for AGIs below $25k, 19.2% for AGIs $25k-50k, 77.3% for AGIs $50k-75k, 56.7% for AGIs $75k-100k, 97.9% for AGIs $100k-200k)
Ordinary dividends: $2,447 (reported on 17.1% of returns)
Here:
$2,447
State:
$9,061
(% of AGI for various income ranges: 8.6% for AGIs below $25k, 10.8% for AGIs $25k-50k, 37.3% for AGIs $50k-75k, 56.7% for AGIs $75k-100k, 224.3% for AGIs $100k-200k)
Net capital gain/loss in AGI: +$3,712 (reported on 15.3% of returns)
Here:
+$3,712
State:
+$31,684
(% of AGI for various income ranges: 3.8% for AGIs below $25k, 50.7% for AGIs $50k-75k, 130.0% for AGIs $75k-100k, 307.1% for AGIs $100k-200k)
Profit/loss from business: +$9,100 (reported on 9.9% of returns)
Here:
+$9,100
State:
+$12,175
(% of AGI for various income ranges: 74.3% for AGIs below $25k, 175.8% for AGIs $25k-50k, 84.4% for AGIs $75k-100k, 247.9% for AGIs $100k-200k)
Taxable individual retirement arrangement distribution: $11,515 (reported on 11.7% of returns)
61533:
$11,515
Illinois:
$21,613
(% of AGI for various income ranges: 99.2% for AGIs $25k-50k, 164.7% for AGIs $50k-75k, 352.2% for AGIs $75k-100k, 496.4% for AGIs $100k-200k)
Total itemized deductions: $29,025 (reported on 3.6% of returns)
Here:
$29,025
State:
$34,948
(% of AGI for various income ranges: 829.3% for AGIs $100k-200k)
Charity contributions: $8,200 (reported on 1.8% of returns)
Here:
$8,200
State:
$13,122
(% of AGI for various income ranges: 182.2% for AGIs $75k-100k)
Taxes paid: $8,475 (reported on 3.6% of returns)
61533:
$8,475
State:
$8,563
(% of AGI for various income ranges: 55.2% for AGIs below $25k, 159.3% for AGIs $100k-200k)
Earned income credit: $2,133 (reported on 10.8% of returns)
Here:
$2,133
State:
$2,311
(% of AGI for various income ranges: 62.4% for AGIs below $25k, 52.1% for AGIs $25k-50k)
Percentage of individuals using paid preparers for their 2020 taxes: 93.7%
Here:
94%
State:
93%
(% for various income ranges: 92.9% for AGIs below $25k, 96.4% for AGIs $25k-50k, 94.7% for AGIs $50k-75k, 92.3% for AGIs $75k-100k, 90.0% for AGIs $100k-200k, 100.0% for AGIs over 200k)
Averages for the 2012 tax year for zip code 61533, filed in 2013:
Average Adjusted Gross Income (AGI) in 2012: $53,368 (Individual Income Tax Returns)
Here:
$53,368
State:
$68,058
Salary/wage: $46,932 (reported on 82.5% of returns)
Here:
$46,932
State:
$55,396
(% of AGI for various income ranges: 66.9% for AGIs below $25k, 71.8% for AGIs $25k-50k, 73.3% for AGIs $50k-75k, 76.1% for AGIs $75k-100k, 71.5% for AGIs $100k-200k)
Taxable interest for individuals: $671 (reported on 51.8% of returns)
This zip code:
$671
Illinois:
$1,969
(% of AGI for various income ranges: 1.5% for AGIs below $25k, 0.8% for AGIs $25k-50k, 0.5% for AGIs $50k-75k, 0.5% for AGIs $75k-100k, 0.6% for AGIs $100k-200k)
Ordinary dividends: $1,295 (reported on 19.3% of returns)
Here:
$1,295
State:
$7,786
(% of AGI for various income ranges: 0.8% for AGIs below $25k, 0.4% for AGIs $25k-50k, 0.4% for AGIs $50k-75k, 0.4% for AGIs $75k-100k, 0.4% for AGIs $100k-200k)
Net capital gain/loss in AGI: +$3,283 (reported on 10.5% of returns)
Here:
+$3,283
State:
+$22,183
(% of AGI for various income ranges: 0.4% for AGIs below $25k, 0.7% for AGIs $75k-100k, 1.3% for AGIs $100k-200k)
Profit/loss from business: +$6,447 (reported on 13.2% of returns)
Here:
+$6,447
State:
+$12,903
(% of AGI for various income ranges: 4.3% for AGIs below $25k, 1.0% for AGIs $25k-50k, 1.8% for AGIs $50k-75k, 2.5% for AGIs $75k-100k, 0.6% for AGIs $100k-200k)
Taxable individual retirement arrangement distribution: $8,300 (reported on 11.4% of returns)
61533:
$8,300
Illinois:
$17,929
(% of AGI for various income ranges: 4.0% for AGIs below $25k, 2.5% for AGIs $25k-50k, 1.9% for AGIs $50k-75k, 2.0% for AGIs $75k-100k, 0.8% for AGIs $100k-200k)
Total itemized deductions: $17,667 (19% of AGI, reported on 28.9% of returns)
Here:
$17,667
State:
$26,433
Here:
19.0% of AGI
State:
19.2% of AGI
(% of AGI for various income ranges: 10.1% for AGIs $25k-50k, 8.8% for AGIs $50k-75k, 11.1% for AGIs $75k-100k, 10.9% for AGIs $100k-200k)
Charity contributions: $2,945 (reported on 19.3% of returns)
Here:
$2,945
State:
$4,525
(% of AGI for various income ranges: 0.9% for AGIs $25k-50k, 1.0% for AGIs $50k-75k, 1.0% for AGIs $75k-100k, 1.5% for AGIs $100k-200k)
Taxes paid: $7,636 (reported on 28.9% of returns)
61533:
$7,636
State:
$11,968
(% of AGI for various income ranges: 2.8% for AGIs $25k-50k, 3.4% for AGIs $50k-75k, 4.7% for AGIs $75k-100k, 5.7% for AGIs $100k-200k)
Earned income credit: $1,964 (reported on 12.3% of returns)
Here:
$1,964
State:
$2,349
(% of AGI for various income ranges: 4.6% for AGIs below $25k, 0.6% for AGIs $25k-50k)
Percentage of individuals using paid preparers for their 2012 taxes: 57.0%
Here:
57%
State:
57%
(% for various income ranges: 46.2% for AGIs below $25k, 55.6% for AGIs $25k-50k, 68.4% for AGIs $50k-75k, 66.7% for AGIs $75k-100k, 64.3% for AGIs $100k-200k)
Averages for the 2004 tax year for zip code 61533, filed in 2005:
Average Adjusted Gross Income (AGI) in 2004: $39,735 (Individual Income Tax Returns)
Here:
$39,735
State:
$54,625
Salary/wage: $37,699 (reported on 85.7% of returns)
Here:
$37,699
State:
$46,811
(% of AGI for various income ranges: 111.2% for AGIs below $10k, 70.7% for AGIs $10k-25k, 72.7% for AGIs $25k-50k, 82.3% for AGIs $50k-75k, 87.3% for AGIs $75k-100k, 87.5% for AGIs over 100k)
Taxable interest for individuals: $897 (reported on 52.6% of returns)
This zip code:
$897
Illinois:
$2,101
(% of AGI for various income ranges: 4.3% for AGIs below $10k, 2.5% for AGIs $10k-25k, 1.7% for AGIs $25k-50k, 0.8% for AGIs $50k-75k, 0.7% for AGIs $75k-100k, 0.7% for AGIs over 100k)
Taxable dividends: $745 (reported on 20.5% of returns)
Here:
$745
State:
$4,306
(% of AGI for various income ranges: 0.9% for AGIs below $10k, 0.8% for AGIs $10k-25k, 0.4% for AGIs $25k-50k, 0.1% for AGIs $50k-75k, 0.6% for AGIs $75k-100k, 0.2% for AGIs over 100k)
Net capital gain/loss: +$3,688 (reported on 14.9% of returns)
Here:
+$3,688
State:
+$17,321
(% of AGI for various income ranges: -0.1% for AGIs below $10k, 0.5% for AGIs $10k-25k, 1.6% for AGIs $25k-50k, 1.4% for AGIs $50k-75k, 2.0% for AGIs $75k-100k, 0.8% for AGIs over 100k)
Profit/loss from business: +$5,274 (reported on 13.5% of returns)
Here:
+$5,274
State:
+$11,771
(% of AGI for various income ranges: 4.3% for AGIs below $10k, 1.4% for AGIs $10k-25k, 3.2% for AGIs $25k-50k, 2.4% for AGIs $50k-75k, 0.5% for AGIs $75k-100k, 0.3% for AGIs over 100k)
IRA payment deduction: $3,136 (reported on 1.9% of returns)
61533:
$3,136
Illinois:
$3,087
Total itemized deductions: $14,311 (21% of AGI, reported on 22.9% of returns)
Here:
$14,311
State:
$20,239
Here:
20.5% of AGI
State:
19.5% of AGI
(% of AGI for various income ranges: 4.4% for AGIs $10k-25k, 6.8% for AGIs $25k-50k, 7.9% for AGIs $50k-75k, 11.4% for AGIs $75k-100k, 10.0% for AGIs over 100k)
Charity contributions deductions: $1,986 (3% of AGI, reported on 17.9% of returns)
Here:
$1,986
State:
$3,719
Here:
2.7% of AGI
State:
3.4% of AGI
(% of AGI for various income ranges: 0.2% for AGIs $10k-25k, 0.6% for AGIs $25k-50k, 0.6% for AGIs $50k-75k, 1.5% for AGIs $75k-100k, 1.4% for AGIs over 100k)
Total tax: $4,616 (reported on 78.2% of returns)
61533:
$4,616
State:
$9,882
(% of AGI for various income ranges: 3.7% for AGIs below $10k, 4.3% for AGIs $10k-25k, 6.6% for AGIs $25k-50k, 8.9% for AGIs $50k-75k, 10.4% for AGIs $75k-100k, 14.8% for AGIs over 100k)
Earned income credit: $1,611 (reported on 11.3% of returns)
Here:
$1,611
State:
$1,788
Percentage of individuals using paid preparers for their 2004 taxes: 64.3%
Here:
64%
State:
61%
(% for various income ranges: 54.2% for AGIs below $10k, 65.6% for AGIs $10k-25k, 68.9% for AGIs $25k-50k, 66.2% for AGIs $50k-75k, 64.6% for AGIs $75k-100k, 68.4% for AGIs over 100k)
Likely homosexual households (counted as self-reported same-sex unmarried-partner households)
Lesbian couples: 0.0% of all households
Gay men: 0.8% of all households
Household received Food Stamps/SNAP in the past 12 months: 221 Household did not receive Food Stamps/SNAP in the past 12 months: 683
Women who had a birth in the past 12 months: 26 (18 now married, 8 unmarried) Women who did not have a birth in the past 12 months: 482 (142 now married, 342 unmarried)
Housing units in zip code 61533 with a mortgage: 492 (27 second mortgage, 4 home equity loan, 10 both second mortgage and home equity loan) Houses without a mortgage: 22
Median monthly owner costs for units with a mortgage: $1,202 Median monthly owner costs for units without a mortgage: $645
Residents with income below the poverty level in 2022:
This zip code:
20.2%
Whole state:
11.9%
Residents with income below 50% of the poverty level in 2022:
This zip code:
17.1%
Whole state:
5.7%
Median number of rooms in houses and condos:
Here:
6.1
State:
6.4
Median number of rooms in apartments:
Here:
6.3
State:
4.1
Notable locations in this zip code not listed on our city pages
Size of family households: 353 2-persons, 142 3-persons, 82 4-persons, 102 5-persons, 12 6-persons
Size of nonfamily households: 152 1-person, 39 2-persons
186 married couples with children.
317 single-parent households (172 men, 145 women).
98.9% of residents of 61533 zip code speak English at home.
0.1% of residents speak Spanish at home (100% well).
0.2% of residents speak Asian or Pacific Island language at home (100% very well).
Foreign born population: 0 (0.0%)
:
0.0%
Whole state:
14.4%
51%American
16%German
11%English
4%Dutch
4%European
3%Scottish
2%Polish
Year of entry for the foreign-born population
02010 or later
02000 to 2009
01990 to 1999
9Before 1990
Facilities with environmental interests located in this zip code:
J&C COMPLETE (111 S GLASFORD RD in GLASFORD, IL)
STATE MASTER (Illinois EPA Project) - HAZARDOUS WASTE PROGRAM Conditionally Exempt Small Quantity Generators, less than 100 kg/month of hazardous waste (Resource Conservation and Recovery Act (tracking hazardous waste)) Organizations: JOHN WALL (CONTACT/OWNER)
ILLINI BLUFFS HIGH SCHOOL (PO BOX 320 in GLASFORD, IL)
(Geographic Names Information System) (National Center for Education Statistics) - STATE ID-4807232700008 Organizations: ILLINI BLUFFS CU SCH DIST 327 (SCHOOL DISTRICT)
ILLINI BLUFFS ELEMENTARY SCHOOL (9611 HANNA CITY-GLAS in GLASFORD, IL)
(National Center for Education Statistics) - STATE ID-4807232702004 Organizations: ILLINI BLUFFS CU SCH DIST 327 (SCHOOL DISTRICT)
ILLINI BLUFFS MIDDLE SCHOOL (212 N SAYLOR in GLASFORD, IL)
(National Center for Education Statistics) - STATE ID-4807232702006 Organizations: ILLINI BLUFFS CU SCH DIST 327 (SCHOOL DISTRICT)
PANHANDLE EASTERN GLASFORD (HWY 9 ND 24 9100 TO 13300 W in GLASFORD, IL)
(Resource Conservation and Recovery Act (tracking hazardous waste)) Organizations: PANHANDLE EASTERN GAS PIPELINE (CONTACT/OWNER)
AMEREN CILCO GLASFORD GAS STORAGE FLD (COWSER & LIGHTBODY in GLASFORD, IL)
Small Quantity Generators, between 100 kg and 1000 kg of hazardous waste/month (Resource Conservation and Recovery Act (tracking hazardous waste)) Business NAICS classification: ELECTRIC BULK POWER TRANSMISSION AND CONTROL. Organizations: CENTRAL ILL LIGHT CO DBA AMEREN CILCO (CONTACT/OWNER)
Alternative names: GEN ILL LIGHT CO GLASFORD GAS STRG FLD
K& R CO (15922 GLASFORD CANTON RD in GLASFORD, IL)
Conditionally Exempt Small Quantity Generators, less than 100 kg/month of hazardous waste (Resource Conservation and Recovery Act (tracking hazardous waste)) - notification TRANSPORTER (Resource Conservation and Recovery Act (tracking hazardous waste)) - notification Organizations: RAY RICHARD (CONTACT/OWNER)
Housing units lacking complete plumbing facilities: 5.4% Housing units lacking complete kitchen facilities: 4.4%
61.3%Utility gas
18.2%Bottled, tank, or LP gas
10.9%Wood
9.0%Electricity
0.9%Other fuel
Population in 1990: 2,531.
Place of birth for U.S.-born residents:
This state: 2,153
Northeast: 24
Midwest: 33
South: 59
West: 37
72% of the 61533 zip code residents lived in the same house 5 years ago. Out of people who lived in different houses, 63% lived in this county. Out of people who lived in different counties, 50% lived in Illinois.
97% of the 61533 zip code residents lived in the same house 1 year ago. Out of people who lived in different houses, 47% moved from this county. Out of people who lived in different houses, 53% moved from different county within same state.
Private vs. public school enrollment:
Students in private schools in grades 1 to 8 (elementary and middle school): 17
Here:
5.0%
Illinois:
13.3%
Students in private schools in grades 9 to 12 (high school):
Here:
0.0%
Illinois:
9.9%
Students in private undergraduate colleges:
Here:
0.0%
Illinois:
27.4%
Occupation by median earnings in the past 12 months ($)
68,329Business and financial operations occupations
65,948Management occupations
61,133Installation, maintenance, and repair occupations
59,740Health diagnosing and treating practitioners and other technical occupations
58,593Life, physical, and social science occupations
55,726Community and social service occupations
Companies with federal contracts located in this zip code:
HEATHER PALMER (305 W SECOND ST in GLASFORD, CA; small business) : $3,600 in 2 contractsin 2001
$3,600 with Army for Other Professional Services. Taking place in CA. Signed on 2001-11-15. Completion date: 2002-09-30.
$0, same as above.Signed on 2001-11-15. Completion date: 2002-09-30.
Top industries in this zip code by the number of employees in 2005:
Construction: Site Preparation Contractors (10-19 employees: 1 establishment)
Finance and Insurance: Commercial Banking (10-19: 1)
Construction: New Single-Family Housing Construction (except Operative Builders) (5-9: 1)
Wholesale Trade: Grain and Field Bean Merchant Wholesalers (5-9: 1)
Detailed PMIC statistics for the following Tracts:0049.01
, 0049.02
2002 - 2018 National Fire Incident Reporting System (NFIRS) incidents
According to the data from the years 2002 - 2018 the average number of fire incidents per year is 14. The highest number of fires - 32 took place in 2012, and the least - 1 in 2007. The data has an increasing trend.
When looking into fire subcategories, the most incidents belonged to: Outside Fires (41.3%), and Structure Fires (40.0%).
Fire incident types reported to NFIRS in Zip Code 61533

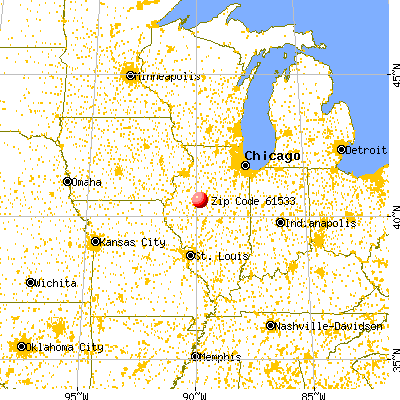


 Nearest zip codes: 61539, 61569, 61536, 61547, 61546, 61607.


 According to the data from the years 2002 - 2018 the average number of fire incidents per year is 14. The highest number of fires - 32 took place in 2012, and the least - 1 in 2007. The data has an increasing trend.
 When looking into fire subcategories, the most incidents belonged to: Outside Fires (41.3%), and Structure Fires (40.0%).