Estimated zip code population in 2022: 2,244 Zip code population in 2010: 2,197 Zip code population in 2000: 2,136
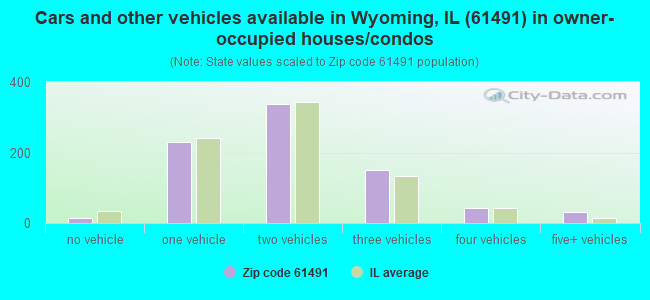
Houses and condos: 1,091 Renter-occupied apartments: 232
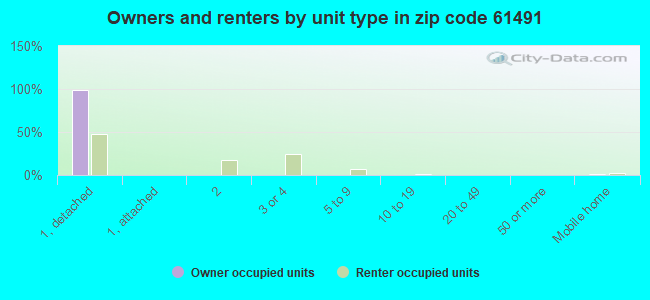
% of renters here:
22%
State:
33%
March 2022 cost of living index in zip code 61491: 83.8 (less than average, U.S. average is 100)
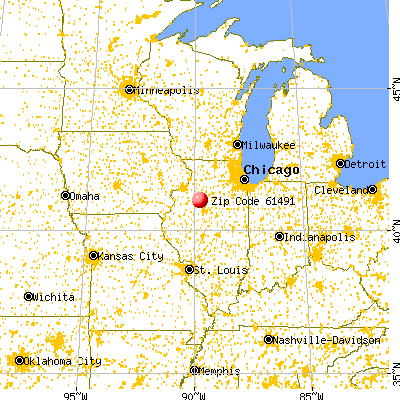
Land area: 99.7 sq. mi. Water area: 0.2 sq. mi.
Population density: 23 people per square mile
(very low).
OSM Map
General Map
Google Map
MSN Map
OSM Map
General Map
Google Map
MSN Map
OSM Map
General Map
Google Map
MSN Map
OSM Map
General Map
Google Map
MSN Map
Please wait while loading the map...
Real estate property taxes paid for housing units in 2022:
This zip code:
1.6% ($1,925)
Illinois:
2.0% ($4,912)
Median real estate property taxes paid for housing units with mortgages in 2022: $2,025 (1.6%) Median real estate property taxes paid for housing units with no mortgage in 2022: $1,753 (1.6%)
Business Search- 14 Million verified businesses
Males: 1,112
(49.5%)
Females: 1,132
(50.5%)
For population 25 years and over in 61491:
High school or higher: 93.0%
Bachelor's degree or higher: 23.2%
Graduate or professional degree: 6.2%
Unemployed: 3.5%
Mean travel time to work (commute): 20.5 minutes
For population 15 years and over in 61491:
Never married: 26.5%
Now married: 55.1%
Separated: 1.4%
Widowed: 9.4%
Divorced: 7.6%
Zip code 61491 compared to state average:
Median house value below state average.
Black race population percentage significantly below state average.
Hispanic race population percentage significantly below state average.
Median age above state average.
Foreign-born population percentage significantly below state average.
Length of stay since moving in significantly above state average.
Percentage of population with a bachelor's degree or higher below state average.
Averages for the 2020 tax year for zip code 61491, filed in 2021:
Average Adjusted Gross Income (AGI) in 2020: $65,744 (Individual Income Tax Returns)
Here:
$65,744
State:
$82,626
Salary/wage: $46,859 (reported on 79.0% of returns)
Here:
$46,859
State:
$66,640
(% of AGI for various income ranges: 1015.2% for AGIs below $25k, 3663.3% for AGIs $25k-50k, 5990.0% for AGIs $50k-75k, 9498.3% for AGIs $75k-100k, 12361.2% for AGIs $100k-200k)
Taxable interest for individuals: $1,671 (reported on 49.0% of returns)
This zip code:
$1,671
Illinois:
$2,376
(% of AGI for various income ranges: 23.9% for AGIs below $25k, 24.4% for AGIs $25k-50k, 94.2% for AGIs $50k-75k, 120.0% for AGIs $75k-100k, 247.5% for AGIs $100k-200k)
Ordinary dividends: $7,556 (reported on 18.0% of returns)
Here:
$7,556
State:
$9,061
(% of AGI for various income ranges: 13.9% for AGIs below $25k, 27.8% for AGIs $25k-50k, 79.2% for AGIs $50k-75k, 171.2% for AGIs $100k-200k)
Net capital gain/loss in AGI: +$22,212 (reported on 16.0% of returns)
Here:
+$22,212
State:
+$31,684
(% of AGI for various income ranges: 2.6% for AGIs below $25k, 5.6% for AGIs $25k-50k, 221.7% for AGIs $50k-75k, 192.5% for AGIs $100k-200k)
Profit/loss from business: +$14,769 (reported on 13.0% of returns)
Here:
+$14,769
State:
+$12,175
(% of AGI for various income ranges: 118.7% for AGIs below $25k, 97.8% for AGIs $25k-50k, 657.5% for AGIs $50k-75k, 852.5% for AGIs $100k-200k)
Taxable individual retirement arrangement distribution: $12,722 (reported on 9.0% of returns)
61491:
$12,722
Illinois:
$21,613
(% of AGI for various income ranges: 61.3% for AGIs below $25k, 91.1% for AGIs $25k-50k, 368.3% for AGIs $50k-75k, 497.5% for AGIs $100k-200k)
Total itemized deductions: $43,633 (reported on 3.0% of returns)
Here:
$43,633
State:
$34,948
(% of AGI for various income ranges: 2181.7% for AGIs $75k-100k)
Taxes paid: $6,567 (reported on 3.0% of returns)
61491:
$6,567
State:
$8,563
(% of AGI for various income ranges: 328.3% for AGIs $75k-100k)
Earned income credit: $2,157 (reported on 14.0% of returns)
Here:
$2,157
State:
$2,311
(% of AGI for various income ranges: 94.3% for AGIs below $25k, 47.2% for AGIs $25k-50k)
Percentage of individuals using paid preparers for their 2020 taxes: 93.0%
Here:
93%
State:
93%
(% for various income ranges: 90.6% for AGIs below $25k, 91.7% for AGIs $25k-50k, 94.1% for AGIs $50k-75k, 100.0% for AGIs $75k-100k, 92.3% for AGIs $100k-200k, 100.0% for AGIs over 200k)
Averages for the 2012 tax year for zip code 61491, filed in 2013:
Average Adjusted Gross Income (AGI) in 2012: $57,936 (Individual Income Tax Returns)
Here:
$57,936
State:
$68,058
Salary/wage: $42,424 (reported on 78.4% of returns)
Here:
$42,424
State:
$55,396
(% of AGI for various income ranges: 62.7% for AGIs below $25k, 72.1% for AGIs $25k-50k, 72.2% for AGIs $50k-75k, 68.0% for AGIs $75k-100k, 54.6% for AGIs $100k-200k, 29.0% for AGIs over 200k)
Taxable interest for individuals: $1,070 (reported on 52.9% of returns)
This zip code:
$1,070
Illinois:
$1,969
(% of AGI for various income ranges: 2.4% for AGIs below $25k, 1.0% for AGIs $25k-50k, 0.7% for AGIs $50k-75k, 0.7% for AGIs $75k-100k, 0.9% for AGIs $100k-200k, 1.0% for AGIs over 200k)
Ordinary dividends: $2,830 (reported on 19.6% of returns)
Here:
$2,830
State:
$7,786
(% of AGI for various income ranges: 2.8% for AGIs below $25k, 0.7% for AGIs $25k-50k, 0.4% for AGIs $50k-75k, 0.5% for AGIs $75k-100k, 0.8% for AGIs $100k-200k, 1.4% for AGIs over 200k)
Net capital gain/loss in AGI: +$3,279 (reported on 13.7% of returns)
Here:
+$3,279
State:
+$22,183
(% of AGI for various income ranges: 1.3% for AGIs $50k-75k, 2.5% for AGIs $100k-200k)
Profit/loss from business: +$11,129 (reported on 13.7% of returns)
Here:
+$11,129
State:
+$12,903
(% of AGI for various income ranges: 4.8% for AGIs below $25k, 3.2% for AGIs $25k-50k, 7.0% for AGIs $50k-75k, 2.7% for AGIs $100k-200k)
Taxable individual retirement arrangement distribution: $8,820 (reported on 9.8% of returns)
61491:
$8,820
Illinois:
$17,929
(% of AGI for various income ranges: 2.3% for AGIs below $25k, 4.1% for AGIs $25k-50k, 4.4% for AGIs $75k-100k)
Total itemized deductions: $19,510 (16% of AGI, reported on 19.6% of returns)
Here:
$19,510
State:
$26,433
Here:
15.8% of AGI
State:
19.2% of AGI
(% of AGI for various income ranges: 6.1% for AGIs $25k-50k, 6.5% for AGIs $50k-75k, 6.9% for AGIs $75k-100k, 14.8% for AGIs $100k-200k)
Charity contributions: $4,369 (reported on 12.7% of returns)
Here:
$4,369
State:
$4,525
(% of AGI for various income ranges: 1.6% for AGIs below $25k, 0.6% for AGIs $50k-75k, 1.0% for AGIs $75k-100k, 2.5% for AGIs $100k-200k)
Taxes paid: $7,715 (reported on 19.6% of returns)
61491:
$7,715
State:
$11,968
(% of AGI for various income ranges: 1.6% for AGIs $25k-50k, 2.0% for AGIs $50k-75k, 2.5% for AGIs $75k-100k, 7.0% for AGIs $100k-200k)
Earned income credit: $2,079 (reported on 13.7% of returns)
Here:
$2,079
State:
$2,349
(% of AGI for various income ranges: 4.8% for AGIs below $25k, 1.0% for AGIs $25k-50k)
Percentage of individuals using paid preparers for their 2012 taxes: 62.7%
Here:
63%
State:
57%
(% for various income ranges: 56.8% for AGIs below $25k, 60.0% for AGIs $25k-50k, 62.5% for AGIs $50k-75k, 72.7% for AGIs $75k-100k, 70.0% for AGIs $100k-200k, 100.0% for AGIs over 200k)
Averages for the 2004 tax year for zip code 61491, filed in 2005:
Average Adjusted Gross Income (AGI) in 2004: $38,107 (Individual Income Tax Returns)
Here:
$38,107
State:
$54,625
Salary/wage: $31,467 (reported on 77.4% of returns)
Here:
$31,467
State:
$46,811
(% of AGI for various income ranges: 117.2% for AGIs below $10k, 58.3% for AGIs $10k-25k, 72.1% for AGIs $25k-50k, 69.0% for AGIs $50k-75k, 77.4% for AGIs $75k-100k, 37.1% for AGIs over 100k)
Taxable interest for individuals: $1,724 (reported on 58.8% of returns)
This zip code:
$1,724
Illinois:
$2,101
(% of AGI for various income ranges: 12.7% for AGIs below $10k, 6.6% for AGIs $10k-25k, 2.6% for AGIs $25k-50k, 1.7% for AGIs $50k-75k, 0.9% for AGIs $75k-100k, 2.5% for AGIs over 100k)
Taxable dividends: $1,524 (reported on 25.8% of returns)
Here:
$1,524
State:
$4,306
(% of AGI for various income ranges: 2.8% for AGIs below $10k, 0.8% for AGIs $10k-25k, 0.6% for AGIs $25k-50k, 0.5% for AGIs $50k-75k, 0.5% for AGIs $75k-100k, 2.5% for AGIs over 100k)
Net capital gain/loss: +$4,213 (reported on 17.6% of returns)
Here:
+$4,213
State:
+$17,321
(% of AGI for various income ranges: -3.4% for AGIs below $10k, 0.9% for AGIs $10k-25k, 1.2% for AGIs $25k-50k, 0.5% for AGIs $50k-75k, 0.3% for AGIs $75k-100k, 6.7% for AGIs over 100k)
Profit/loss from business: +$6,818 (reported on 15.8% of returns)
Here:
+$6,818
State:
+$11,771
(% of AGI for various income ranges: -0.7% for AGIs below $10k, 3.7% for AGIs $10k-25k, 6.7% for AGIs $25k-50k, 1.6% for AGIs $50k-75k, 1.9% for AGIs $75k-100k, 0.8% for AGIs over 100k)
Profit/loss from farming: +$11,491 (reported on 10.4% of returns)
Here:
+$11,491
State:
+$2,327
(% of AGI for various income ranges: -10.1% for AGIs below $10k, 0.3% for AGIs $10k-25k, 1.5% for AGIs $25k-50k, 4.0% for AGIs $50k-75k, 1.2% for AGIs $75k-100k, 7.6% for AGIs over 100k)
IRA payment deduction: $2,730 (reported on 3.6% of returns)
61491:
$2,730
Illinois:
$3,087
Total itemized deductions: $14,406 (20% of AGI, reported on 16.3% of returns)
Here:
$14,406
State:
$20,239
Here:
19.6% of AGI
State:
19.5% of AGI
(% of AGI for various income ranges: 8.8% for AGIs $10k-25k, 6.1% for AGIs $25k-50k, 6.6% for AGIs $50k-75k, 4.6% for AGIs $75k-100k, 6.1% for AGIs over 100k)
Charity contributions deductions: $3,328 (4% of AGI, reported on 12.6% of returns)
Here:
$3,328
State:
$3,719
Here:
4.4% of AGI
State:
3.4% of AGI
(% of AGI for various income ranges: 0.4% for AGIs $10k-25k, 0.7% for AGIs $25k-50k, 1.1% for AGIs $50k-75k, 1.0% for AGIs $75k-100k, 2.0% for AGIs over 100k)
Total tax: $5,308 (reported on 75.6% of returns)
61491:
$5,308
State:
$9,882
(% of AGI for various income ranges: 4.0% for AGIs below $10k, 4.3% for AGIs $10k-25k, 7.2% for AGIs $25k-50k, 9.4% for AGIs $50k-75k, 11.7% for AGIs $75k-100k, 18.3% for AGIs over 100k)
Earned income credit: $1,472 (reported on 11.8% of returns)
Here:
$1,472
State:
$1,788
Percentage of individuals using paid preparers for their 2004 taxes: 68.5%
Here:
69%
State:
61%
(% for various income ranges: 64.4% for AGIs below $10k, 69.8% for AGIs $10k-25k, 69.2% for AGIs $25k-50k, 69.5% for AGIs $50k-75k, 62.5% for AGIs $75k-100k, 83.7% for AGIs over 100k)
Household received Food Stamps/SNAP in the past 12 months: 138 Household did not receive Food Stamps/SNAP in the past 12 months: 899
Women who had a birth in the past 12 months: 19 (15 now married, 3 unmarried) Women who did not have a birth in the past 12 months: 425 (205 now married, 218 unmarried)
Housing units in zip code 61491 with a mortgage: 380 (61 second mortgage, 56 both second mortgage and home equity loan) Houses without a mortgage: 6
Median monthly owner costs for units with a mortgage: $1,219 Median monthly owner costs for units without a mortgage: $468
Residents with income below the poverty level in 2022:
This zip code:
11.7%
Whole state:
11.9%
Residents with income below 50% of the poverty level in 2022:
This zip code:
8.7%
Whole state:
5.7%
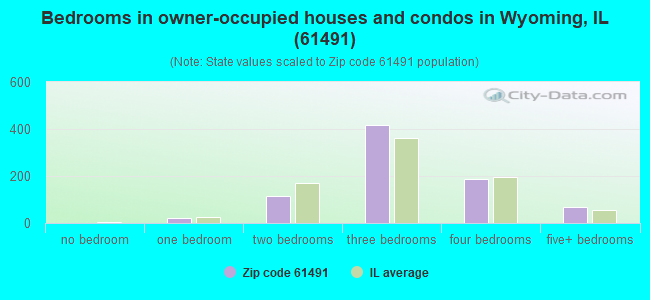
Median number of rooms in houses and condos:
Here:
6.7
State:
6.4
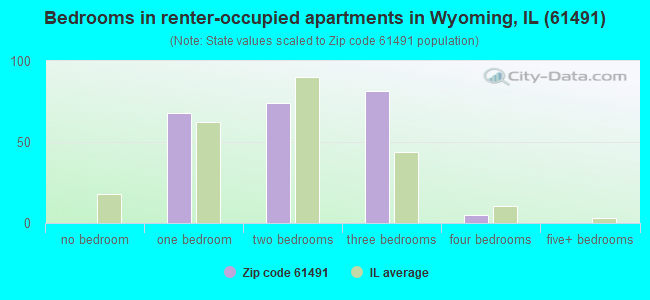
Median number of rooms in apartments:
Here:
4.3
State:
4.1
Notable locations in this zip code not listed on our city pages
Churches in zip code 61491 include: First Congregational United Church of Christ (A), Saint Dominic Church (B), Wyoming First Baptist Church (C), Wyoming Methodist Church (D), Saint Timothy Lutheran Church (E). Display/hide their locations on the map
Cemeteries: Schiebel Cemetery (1), Pleasant Valley Cemetery (2), Wyoming Cemetery (3), Grant Cemetery (4), Sheets Cemetery (5), Eagleston Cemetery (6), Mawbey Cemetery (7). Display/hide their locations on the map
Streams, rivers, and creeks: Mud Run (A), Camp Run (B), East Fork Spoon River (C), West Fork Spoon River (D), Jug Run (E), Jack Creek (F), Indian Creek (G). Display/hide their locations on the map
Size of family households: 350 2-persons, 107 3-persons, 80 4-persons, 56 5-persons, 43 6-persons
Size of nonfamily households: 367 1-person, 26 2-persons, 3 6-persons
286 married couples with children.
99 single-parent households (24 men, 75 women).
94.8% of residents of 61491 zip code speak English at home.
2.2% of residents speak Spanish at home (62% very well, 21% well, 17% not well).
1.5% of residents speak other Indo-European language at home (38% very well, 62% well).
1.2% of residents speak Asian or Pacific Island language at home (19% very well, 58% well, 23% not well).
Foreign born population: 68 (3.0%) (39.9% of them are naturalized citizens)
This zip code:
3.0%
Whole state:
14.4%
32%Serbia
29%Malaysia
28%Costa Rica
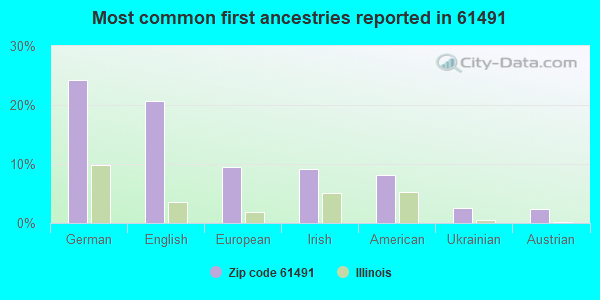
24%German
21%English
9%European
9%Irish
8%American
2%Ukrainian
2%Austrian
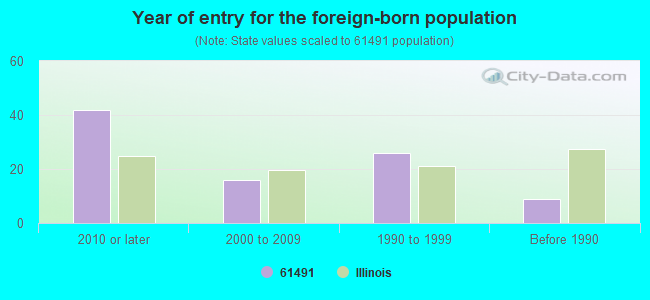
Year of entry for the foreign-born population
422010 or later
162000 to 2009
261990 to 1999
9Before 1990
Facilities with environmental interests located in this zip code:
AG VIEW FS INC (RTE. 91 S in WYOMING, IL)
STATE MASTER (Illinois EPA Project) - AIR PROGRAM AIR MINOR (AIRS/AFS) ENFORCEMENT/COMPLIANCE ACTIVITY (Integrated Compliance Information System) CRITERIA AND HAZARDOUS AIR POLLUTANT INVENTORY (Inventory of air pollution sources) Business SIC classification: PETROLEUM AND PETROLEUM PRODUCTS WHOLESALERS, EXCEPT BULK STATIONS AND TERMINALS; FARM SUPPLIES Alternative names: GRANDVIEW SERVICE CO., GRANDVIEW SERVICE CO
BO GAR ENTERPRISES (401 S MAIN ST in WYOMING, IL)
STATE MASTER (Illinois EPA Project) - SOLID WASTE PROGRAM, HAZARDOUS WASTE PROGRAM (Resource Conservation and Recovery Act (tracking hazardous waste)) Organizations: JONES VONDA (CONTACT/OWNER)
ROCK ISLAND TRAIL STATE PARK (311 E WILLIAMS in WYOMING, IL)
STATE MASTER (Illinois EPA Project) - HAZARDOUS WASTE PROGRAM Conditionally Exempt Small Quantity Generators, less than 100 kg/month of hazardous waste (Resource Conservation and Recovery Act (tracking hazardous waste)) - notification (Resource Conservation and Recovery Act (tracking hazardous waste)) Organizations: STATE OF IL DEPT OF NATURAL RESOURCES (CONTACT/OWNER)
Alternative names: ROCK ISLAND TRAIL ST PARK
KNOBLOCH FARMS TRUCKING INC (N ON RT. 88 TO RT. 17 WEST, GO in WYOMING, IL)
STATE MASTER (Illinois EPA Project) - National Pollutant Discharge Elimination System Permit National Pollutant Discharge Elimination System NON-MAJOR (Tracking pollutant discharge elimination systems) - permit Organizations: KNOBLOCH FARMS TRUCKING, INC. (CONTACT/OWNER)
RUMBOLD & KUHN INC (RR 1 BOX 10 in WYOMING, IL)
STATE MASTER (Illinois EPA Project) - AIR PROGRAM AIR MINOR (AIRS/AFS) CRITERIA AND HAZARDOUS AIR POLLUTANT INVENTORY (Inventory of air pollution sources) Business SIC classification: GRAIN AND FIELD BEANS Alternative names: KNOBLOCH GRAIN COMPANY INCORPORATED
RUMBOLD VALLEY FARM (RURAL ROUTE 1, BOX 77A in WYOMING, IL)
STATE MASTER (Illinois EPA Project) - AIR PROGRAM AIR MINOR (AIRS/AFS) CRITERIA AND HAZARDOUS AIR POLLUTANT INVENTORY (Inventory of air pollution sources) Business SIC classification: GRAIN AND FIELD BEANS
S&F TRUCKING COMPANY (1 MI N OF PRINCEVILLE ON RT 91 in WYOMING, IL)
STATE MASTER (Illinois EPA Project) - National Pollutant Discharge Elimination System Permit National Pollutant Discharge Elimination System NON-MAJOR (Tracking pollutant discharge elimination systems) - permit Organizations: S & F TRUCKING COMPANY (CONTACT/OWNER)
RUMBOLD & SON, INC.?EZRA (INTERS. OF 1500 E. & 300 N. in WYOMING, IL)
National Pollutant Discharge Elimination System NON-MAJOR (Tracking pollutant discharge elimination systems) - permit Alternative names: RUMBOLD, EZRA & SON INC.
ILDOT ST OF (RR 1 S 7TH ST in WYOMING, IL)
Small Quantity Generators, between 100 kg and 1000 kg of hazardous waste/month (Resource Conservation and Recovery Act (tracking hazardous waste)) - notification Organizations: ILLINOIS STATE (CONTACT/OWNER)
Housing units lacking complete plumbing facilities: 3.7% Housing units lacking complete kitchen facilities: 4.6%
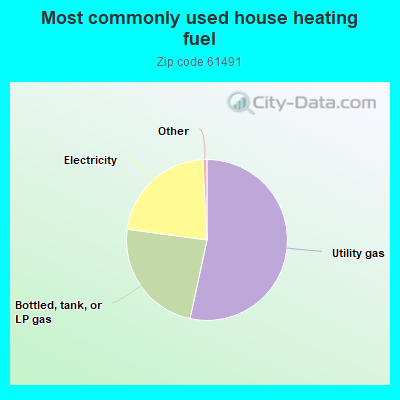
53.5%Utility gas
23.8%Bottled, tank, or LP gas
22.1%Electricity
Population in 1990: 1,818. Population change in the 1990s: +318 (+17.5%).
Place of birth for U.S.-born residents:
This state: 1,883
Northeast: 11
Midwest: 122
South: 101
West: 24
71% of the 61491 zip code residents lived in the same house 5 years ago. Out of people who lived in different houses, 50% lived in this county. Out of people who lived in different counties, 50% lived in Illinois.
93% of the 61491 zip code residents lived in the same house 1 year ago. Out of people who lived in different houses, 19% moved from this county. Out of people who lived in different houses, 61% moved from different county within same state. Out of people who lived in different houses, 27% moved from different state.
Private vs. public school enrollment:
Students in private schools in grades 1 to 8 (elementary and middle school): 9
Here:
4.9%
Illinois:
13.3%
Students in private schools in grades 9 to 12 (high school):
Here:
0.0%
Illinois:
9.9%
Students in private undergraduate colleges: 20
Here:
31.9%
Illinois:
27.4%
Occupation by median earnings in the past 12 months ($)
133,229Health diagnosing and treating practitioners and other technical occupations
85,854Architecture and engineering occupations
64,863Business and financial operations occupations
54,972Installation, maintenance, and repair occupations
51,930Construction and extraction occupations
49,861Production occupations
Companies with federal contracts located in this zip code:
ALDRICO INC DBA ALDRICH COMPA (341 E WILLIAMS ST in WYOMING, IL; small business) : $64,016 in 4 contractsfrom 2002 to 2005
$28,092 with Defense Logistics Agency for Space and Water Heating Equipment. Signed on 2005-11-09. Completion date: 2005-11-09.
$28,092, same as above.Signed on 2005-09-06. Completion date: 2005-10-30.
$4,530 with Army for Waste Disposal Equipment. Taking place in VA. Signed on 2002-11-27. Completion date: 2003-01-08.
$3,302 with Army for Fuel Burning Equipment Units. Taking place in VA. Signed on 2004-06-24. Completion date: 2004-07-15.
QUALITY CABLE & COMPONENTS (109 N MADISON AVE in WYOMING, IL; small business) : $11,985 in 2 contractsfrom 2002 to 2005
$10,853 with Army for Cable, Cord, and Wire Assemblies: Communications Equipment. Signed on 2005-08-02. Completion date: 2005-10-01.
$1,132 with Army for Fittings for Rope, Cable, and Chain. Taking place in TX. Signed on 2002-12-09. Completion date: 2002-12-13.
Top industries in this zip code by the number of employees in 2005:
Accommodation and Food Services: Full-Service Restaurants (20-49 employees: 1 establishment)
Construction: Highway, Street, and Bridge Construction (10-19: 1, 1-4: 1)
Finance and Insurance: Commercial Banking (10-19: 1)
2002 - 2018 National Fire Incident Reporting System (NFIRS) incidents
According to the data from the years 2002 - 2018 the average number of fires per year is 15. The highest number of fires - 27 took place in 2011, and the least - 2 in 2003. The data has a growing trend.
When looking into fire subcategories, the most incidents belonged to: Outside Fires (51.4%), and Structure Fires (27.1%).
Fire incident types reported to NFIRS in Zip Code 61491


 Nearest zip codes: 61426, 61424, 61479, 61559, 61483, 61421.


 According to the data from the years 2002 - 2018 the average number of fires per year is 15. The highest number of fires - 27 took place in 2011, and the least - 2 in 2003. The data has a growing trend.
 When looking into fire subcategories, the most incidents belonged to: Outside Fires (51.4%), and Structure Fires (27.1%).