Estimated zip code population in 2022: 1,207 Zip code population in 2010: 1,359 Zip code population in 2000: 1,381
Houses and condos: 629 Renter-occupied apartments: 119
% of renters here:
22%
State:
33%
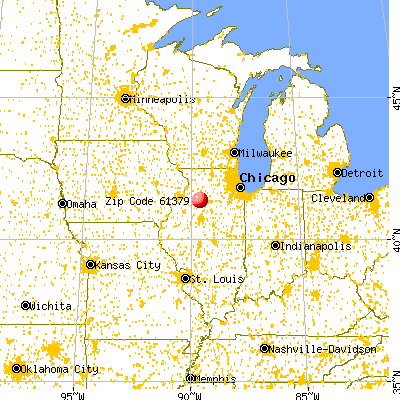
March 2022 cost of living index in zip code 61379: 84.2 (less than average, U.S. average is 100)
Land area: 41.3 sq. mi. Water area: 0.0 sq. mi.
Population density: 29 people per square mile
(very low).
OSM Map
General Map
Google Map
MSN Map
OSM Map
General Map
Google Map
MSN Map
OSM Map
General Map
Google Map
MSN Map
OSM Map
General Map
Google Map
MSN Map
Please wait while loading the map...
Real estate property taxes paid for housing units in 2022:
This zip code:
2.2% ($2,232)
Illinois:
2.0% ($4,912)
Median real estate property taxes paid for housing units with mortgages in 2022: $2,333 (2.3%) Median real estate property taxes paid for housing units with no mortgage in 2022: $1,921 (1.9%)
Business Search- 14 Million verified businesses
Males: 582
(48.2%)
Females: 624
(51.8%)
For population 25 years and over in 61379:
High school or higher: 91.1%
Bachelor's degree or higher: 9.0%
Graduate or professional degree: 1.2%
Unemployed: 5.7%
Mean travel time to work (commute): 22.5 minutes
For population 15 years and over in 61379:
Never married: 27.4%
Now married: 44.6%
Separated: 2.4%
Widowed: 10.8%
Divorced: 14.8%
Zip code 61379 compared to state average:
Median house value significantly below state average.
Black race population percentage significantly below state average.
Hispanic race population percentage significantly below state average.
Median age above state average.
Foreign-born population percentage significantly below state average.
Renting percentage below state average.
Length of stay since moving in significantly above state average.
Number of college students significantly below state average.
Percentage of population with a bachelor's degree or higher significantly below state average.
Averages for the 2020 tax year for zip code 61379, filed in 2021:
Average Adjusted Gross Income (AGI) in 2020: $54,422 (Individual Income Tax Returns)
Here:
$54,422
State:
$82,626
Salary/wage: $47,177 (reported on 81.2% of returns)
Here:
$47,177
State:
$66,640
(% of AGI for various income ranges: 1369.3% for AGIs below $25k, 3566.9% for AGIs $25k-50k, 5958.6% for AGIs $50k-75k, 9412.0% for AGIs $75k-100k, 14940.0% for AGIs $100k-200k)
Taxable interest for individuals: $733 (reported on 32.8% of returns)
This zip code:
$733
Illinois:
$2,376
(% of AGI for various income ranges: 10.0% for AGIs below $25k, 20.8% for AGIs $25k-50k, 82.9% for AGIs $50k-75k, 22.0% for AGIs $75k-100k, 71.7% for AGIs $100k-200k)
Ordinary dividends: $2,164 (reported on 17.2% of returns)
Here:
$2,164
State:
$9,061
(% of AGI for various income ranges: 47.7% for AGIs $25k-50k, 84.3% for AGIs $50k-75k, 195.0% for AGIs $100k-200k)
Net capital gain/loss in AGI: +$8,560 (reported on 15.6% of returns)
Here:
+$8,560
State:
+$31,684
(% of AGI for various income ranges: 63.1% for AGIs $25k-50k, 77.1% for AGIs $50k-75k, 1200.0% for AGIs $100k-200k)
Profit/loss from business: +$6,743 (reported on 10.9% of returns)
Here:
+$6,743
State:
+$12,175
(% of AGI for various income ranges: 285.4% for AGIs $25k-50k, 202.0% for AGIs $75k-100k)
Taxable individual retirement arrangement distribution: $11,783 (reported on 9.4% of returns)
61379:
$11,783
Illinois:
$21,613
(% of AGI for various income ranges: 296.2% for AGIs $25k-50k, 460.0% for AGIs $50k-75k)
Earned income credit: $2,270 (reported on 15.6% of returns)
Here:
$2,270
State:
$2,311
(% of AGI for various income ranges: 94.0% for AGIs below $25k, 66.2% for AGIs $25k-50k)
Percentage of individuals using paid preparers for their 2020 taxes: 92.2%
Here:
92%
State:
93%
(% for various income ranges: 90.5% for AGIs below $25k, 93.8% for AGIs $25k-50k, 90.0% for AGIs $50k-75k, 100.0% for AGIs $75k-100k, 90.0% for AGIs $100k-200k)
Averages for the 2012 tax year for zip code 61379, filed in 2013:
Average Adjusted Gross Income (AGI) in 2012: $45,533 (Individual Income Tax Returns)
Here:
$45,533
State:
$68,058
Salary/wage: $38,052 (reported on 85.7% of returns)
Here:
$38,052
State:
$55,396
(% of AGI for various income ranges: 79.1% for AGIs below $25k, 71.6% for AGIs $25k-50k, 77.3% for AGIs $50k-75k, 76.6% for AGIs $75k-100k, 59.6% for AGIs $100k-200k)
Taxable interest for individuals: $671 (reported on 38.1% of returns)
This zip code:
$671
Illinois:
$1,969
(% of AGI for various income ranges: 0.8% for AGIs below $25k, 1.3% for AGIs $25k-50k, 0.1% for AGIs $50k-75k, 0.2% for AGIs $75k-100k, 0.5% for AGIs $100k-200k)
Ordinary dividends: $1,375 (reported on 19.0% of returns)
Here:
$1,375
State:
$7,786
(% of AGI for various income ranges: 0.5% for AGIs below $25k, 0.8% for AGIs $25k-50k, 0.2% for AGIs $50k-75k, 1.1% for AGIs $75k-100k, 0.4% for AGIs $100k-200k)
Net capital gain/loss in AGI: +$889 (reported on 14.3% of returns)
Here:
+$889
State:
+$22,183
(% of AGI for various income ranges: 0.1% for AGIs below $25k, 1.5% for AGIs $75k-100k)
Profit/loss from business: +$9,338 (reported on 12.7% of returns)
Here:
+$9,338
State:
+$12,903
(% of AGI for various income ranges: 2.7% for AGIs below $25k, 7.4% for AGIs $25k-50k, 4.0% for AGIs $75k-100k)
Taxable individual retirement arrangement distribution: $10,233 (reported on 9.5% of returns)
61379:
$10,233
Illinois:
$17,929
Total itemized deductions: $16,083 (21% of AGI, reported on 19.0% of returns)
Here:
$16,083
State:
$26,433
Here:
20.5% of AGI
State:
19.2% of AGI
(% of AGI for various income ranges: 9.1% for AGIs $25k-50k, 5.1% for AGIs $50k-75k, 9.1% for AGIs $75k-100k, 7.3% for AGIs $100k-200k)
Charity contributions: $2,550 (reported on 9.5% of returns)
Here:
$2,550
State:
$4,525
(% of AGI for various income ranges: 0.8% for AGIs below $25k, 1.3% for AGIs $75k-100k, 0.7% for AGIs $100k-200k)
Taxes paid: $6,450 (reported on 19.0% of returns)
61379:
$6,450
State:
$11,968
(% of AGI for various income ranges: 1.8% for AGIs $25k-50k, 2.3% for AGIs $50k-75k, 4.2% for AGIs $75k-100k, 3.7% for AGIs $100k-200k)
Earned income credit: $2,082 (reported on 17.5% of returns)
Here:
$2,082
State:
$2,349
(% of AGI for various income ranges: 5.4% for AGIs below $25k, 1.1% for AGIs $25k-50k)
Percentage of individuals using paid preparers for their 2012 taxes: 63.5%
Here:
63%
State:
57%
(% for various income ranges: 52.0% for AGIs below $25k, 62.5% for AGIs $25k-50k, 70.0% for AGIs $50k-75k, 85.7% for AGIs $75k-100k, 80.0% for AGIs $100k-200k)
Averages for the 2004 tax year for zip code 61379, filed in 2005:
Average Adjusted Gross Income (AGI) in 2004: $33,087 (Individual Income Tax Returns)
Here:
$33,087
State:
$54,625
Salary/wage: $30,839 (reported on 83.7% of returns)
Here:
$30,839
State:
$46,811
(% of AGI for various income ranges: 125.0% for AGIs below $10k, 65.9% for AGIs $10k-25k, 82.3% for AGIs $25k-50k, 90.2% for AGIs $50k-75k, 79.4% for AGIs $75k-100k, 43.1% for AGIs over 100k)
Taxable interest for individuals: $942 (reported on 49.7% of returns)
This zip code:
$942
Illinois:
$2,101
(% of AGI for various income ranges: 5.7% for AGIs below $10k, 3.9% for AGIs $10k-25k, 1.8% for AGIs $25k-50k, 0.5% for AGIs $50k-75k, 0.3% for AGIs $75k-100k, 0.6% for AGIs over 100k)
Taxable dividends: $716 (reported on 23.5% of returns)
Here:
$716
State:
$4,306
(% of AGI for various income ranges: 1.6% for AGIs below $10k, 1.6% for AGIs $10k-25k, 0.5% for AGIs $25k-50k, 0.1% for AGIs $50k-75k, 0.1% for AGIs $75k-100k, 0.6% for AGIs over 100k)
Net capital gain/loss: +$4,564 (reported on 13.7% of returns)
Here:
+$4,564
State:
+$17,321
(% of AGI for various income ranges: 1.3% for AGIs below $10k, 1.8% for AGIs $10k-25k, 0.4% for AGIs $25k-50k, 0.0% for AGIs $50k-75k, 11.2% for AGIs over 100k)
Profit/loss from business: +$7,135 (reported on 12.9% of returns)
Here:
+$7,135
State:
+$11,771
(% of AGI for various income ranges: 7.2% for AGIs below $10k, 5.8% for AGIs $10k-25k, 4.3% for AGIs $25k-50k, 2.3% for AGIs $50k-75k)
Profit/loss from farming: +$1,047 (reported on 6.2% of returns)
Here:
+$1,047
State:
+$2,327
IRA payment deduction: $3,083 (reported on 1.7% of returns)
61379:
$3,083
Illinois:
$3,087
Total itemized deductions: $13,000 (23% of AGI, reported on 17.7% of returns)
Here:
$13,000
State:
$20,239
Here:
23.5% of AGI
State:
19.5% of AGI
(% of AGI for various income ranges: 12.1% for AGIs $10k-25k, 7.0% for AGIs $25k-50k, 6.8% for AGIs $50k-75k, 10.8% for AGIs $75k-100k)
Charity contributions deductions: $1,853 (3% of AGI, reported on 13.8% of returns)
Here:
$1,853
State:
$3,719
Here:
3.1% of AGI
State:
3.4% of AGI
(% of AGI for various income ranges: 1.2% for AGIs $10k-25k, 0.5% for AGIs $25k-50k, 1.3% for AGIs $50k-75k, 0.9% for AGIs $75k-100k)
Total tax: $4,195 (reported on 70.9% of returns)
61379:
$4,195
State:
$9,882
(% of AGI for various income ranges: 2.8% for AGIs below $10k, 4.1% for AGIs $10k-25k, 7.0% for AGIs $25k-50k, 8.7% for AGIs $50k-75k, 11.2% for AGIs $75k-100k, 17.3% for AGIs over 100k)
Earned income credit: $1,542 (reported on 14.0% of returns)
Here:
$1,542
State:
$1,788
Percentage of individuals using paid preparers for their 2004 taxes: 65.3%
Here:
65%
State:
61%
(% for various income ranges: 53.2% for AGIs below $10k, 66.7% for AGIs $10k-25k, 71.0% for AGIs $25k-50k, 67.6% for AGIs $50k-75k, 76.9% for AGIs $75k-100k, 80.0% for AGIs over 100k)
Likely homosexual households (counted as self-reported same-sex unmarried-partner households)
Lesbian couples: 0.3% of all households
Gay men: 0.4% of all households
Household received Food Stamps/SNAP in the past 12 months: 94 Household did not receive Food Stamps/SNAP in the past 12 months: 459
Women who had a birth in the past 12 months: 7 (3 now married, 3 unmarried) Women who did not have a birth in the past 12 months: 236 (111 now married, 124 unmarried)
Housing units in zip code 61379 with a mortgage: 268 (19 second mortgage, 20 both second mortgage and home equity loan) Houses without a mortgage: 9
Median monthly owner costs for units with a mortgage: $1,057 Median monthly owner costs for units without a mortgage: $525
Residents with income below the poverty level in 2022:
This zip code:
14.6%
Whole state:
11.9%
Residents with income below 50% of the poverty level in 2022:
This zip code:
4.9%
Whole state:
5.7%
Median number of rooms in houses and condos:
Here:
6.6
State:
6.4
Median number of rooms in apartments:
Here:
5.8
State:
4.1
Notable locations in this zip code not listed on our city pages
Notable locations in zip code 61379: Raymond A Sapp Memorial Library (A), Wyanet Rescue Squad (B), Wyanet Fire Protection District (C). Display/hide their locations on the map
131 married couples with children.
98 single-parent households (46 men, 52 women).
98.0% of residents of 61379 zip code speak English at home.
0.4% of residents speak Spanish at home (100% very well).
0.5% of residents speak other Indo-European language at home (83% very well, 17% not well).
0.3% of residents speak Asian or Pacific Island language at home (100% very well).
0.1% of residents speak other language at home (100% well).
Foreign born population: 3 (0.3%) (0.0% of them are naturalized citizens)
:
0.3%
Whole state:
14.4%
75%Malaysia
26%German
18%English
10%American
7%Irish
6%Swedish
5%Italian
3%European
Year of entry for the foreign-born population
02010 or later
32000 to 2009
01990 to 1999
0Before 1990
Facilities with environmental interests located in this zip code:
D & B MORTON FERTILIZER SERVICE INC (ROUTE 6 in WYANET, IL)
STATE MASTER (Illinois EPA Project) - AIR PROGRAM AIR MINOR (AIRS/AFS) Business SIC classification: FARM SUPPLIES
D&E AUTOBODY (228 E RAILROAD AVE in WYANET, IL)
STATE MASTER (Illinois EPA Project) - HAZARDOUS WASTE PROGRAM Conditionally Exempt Small Quantity Generators, less than 100 kg/month of hazardous waste (Resource Conservation and Recovery Act (tracking hazardous waste)) - notification Organizations: HOTCHKISS DONALD (CONTACT/OWNER)
ROE BUREAU CTY ALT SCH (109 W 4TH STREET in WYANET, IL)
(National Center for Education Statistics) - STATE ID-2800634003001 Organizations: BUREAU VALLEY CUSD 340 (SCHOOL DISTRICT)
Housing units lacking complete kitchen facilities: 1.2%
75.5%Utility gas
17.0%Bottled, tank, or LP gas
6.6%Electricity
1.1%No fuel used
Population in 1990: 1,799.
Place of birth for U.S.-born residents:
This state: 1,037
Northeast: 63
Midwest: 67
South: 20
West: 10
67% of the 61379 zip code residents lived in the same house 5 years ago. Out of people who lived in different houses, 81% lived in this county. Out of people who lived in different counties, 50% lived in Illinois.
93% of the 61379 zip code residents lived in the same house 1 year ago. Out of people who lived in different houses, 49% moved from this county. Out of people who lived in different houses, 38% moved from different county within same state. Out of people who lived in different houses, 11% moved from different state.
Private vs. public school enrollment:
Students in private schools in grades 1 to 8 (elementary and middle school): 1
Here:
0.6%
Illinois:
13.3%
Students in private schools in grades 9 to 12 (high school):
Here:
0.0%
Illinois:
9.9%
Students in private undergraduate colleges: 4
Here:
29.9%
Illinois:
27.4%
Occupation by median earnings in the past 12 months ($)
77,523Management occupations
59,993Construction and extraction occupations
55,575Installation, maintenance, and repair occupations
49,044Production occupations
44,951Health diagnosing and treating practitioners and other technical occupations
39,653Material moving occupations
Top industries in this zip code by the number of employees in 2005:
Other Services (except Public Administration): Labor Unions and Similar Labor Organizations (10-19 employees: 1 establishment)
Other Services (except Public Administration): Automotive Body, Paint, and Interior Repair and Maintenance (5-9: 1)
Administrative and Support and Waste Management and Remediation Services: All Other Support Services (5-9: 1)
Health Care and Social Assistance: Offices of Dentists (5-9: 1)
Professional, Scientific, and Technical Services: Other Services Related to Advertising (1-4: 1)
Finance and Insurance: Direct Property and Casualty Insurance Carriers (1-4: 1)
Fatal accident statistics in 2014:
Fatal accident count: 1
Vehicles involved in fatal accidents: 2
Fatal accidents caused by drunken drivers: 0
Fatalities: 1
Persons involved in fatal accidents: 3
Pedestrians involved in fatal accidents: 0
Fatal accident statistics in 2013:
Fatal accident count: 1
Vehicles involved in fatal accidents: 2
Fatal accidents caused by drunken drivers: 0
Fatalities: 1
Persons involved in fatal accidents: 2
Pedestrians involved in fatal accidents: 0
2002 - 2018 National Fire Incident Reporting System (NFIRS) incidents
According to the data from the years 2002 - 2018 the average number of fire incidents per year is 10. The highest number of reported fires - 21 took place in 2014, and the least - 2 in 2004. The data has a growing trend.
When looking into fire subcategories, the most reports belonged to: Outside Fires (56.7%), and Structure Fires (27.0%).
Fire incident types reported to NFIRS in Zip Code 61379


 Nearest zip codes: 61338, 61314, 61361, 61368, 61376, 61346.


 According to the data from the years 2002 - 2018 the average number of fire incidents per year is 10. The highest number of reported fires - 21 took place in 2014, and the least - 2 in 2004. The data has a growing trend.
 When looking into fire subcategories, the most reports belonged to: Outside Fires (56.7%), and Structure Fires (27.0%).