Estimated zip code population in 2022: 1,146 Zip code population in 2010: 1,156 Zip code population in 2000: 1,244
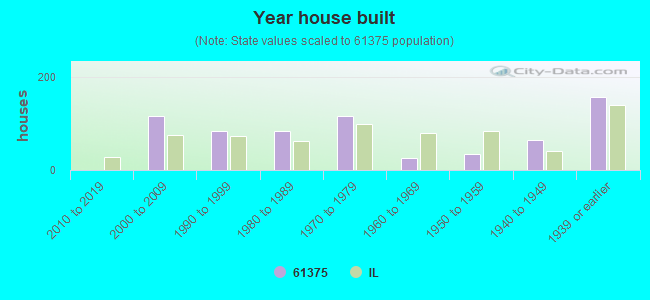
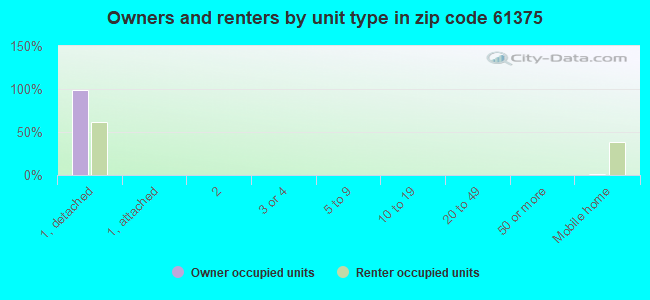
Houses and condos: 695 Renter-occupied apartments: 29
% of renters here:
6%
State:
33%
March 2022 cost of living index in zip code 61375: 84.3 (less than average, U.S. average is 100)
Land area: 47.9 sq. mi. Water area: 0.4 sq. mi.
Population density: 24 people per square mile
(very low).
OSM Map
General Map
Google Map
MSN Map
OSM Map
General Map
Google Map
MSN Map
OSM Map
General Map
Google Map
MSN Map
OSM Map
General Map
Google Map
MSN Map
Please wait while loading the map...
Real estate property taxes paid for housing units in 2022:
This zip code:
1.6% ($2,687)
Illinois:
2.0% ($4,912)
Median real estate property taxes paid for housing units with mortgages in 2022: $2,721 (1.6%) Median real estate property taxes paid for housing units with no mortgage in 2022: $2,665 (1.6%)
Business Search- 14 Million verified businesses
Males: 667
(58.1%)
Females: 480
(41.9%)
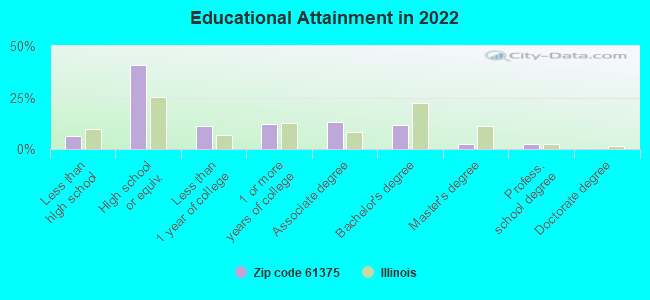
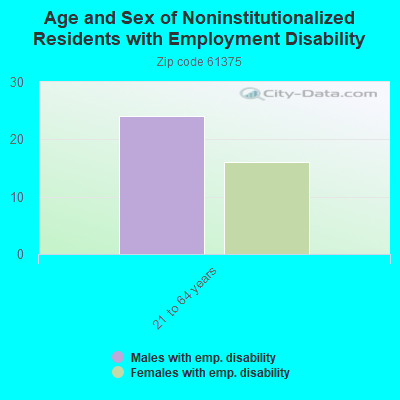
For population 25 years and over in 61375:
High school or higher: 92.9%
Bachelor's degree or higher: 16.5%
Graduate or professional degree: 5.0%
Unemployed: 5.2%
Mean travel time to work (commute): 26.8 minutes
For population 15 years and over in 61375:
Never married: 17.6%
Now married: 67.1%
Separated: 0.6%
Widowed: 9.9%
Divorced: 4.9%
Zip code 61375 compared to state average:
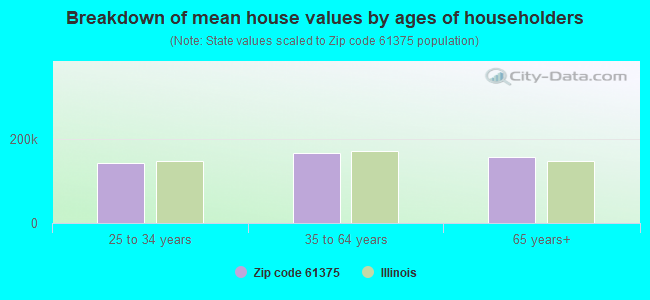
Median house value below state average.
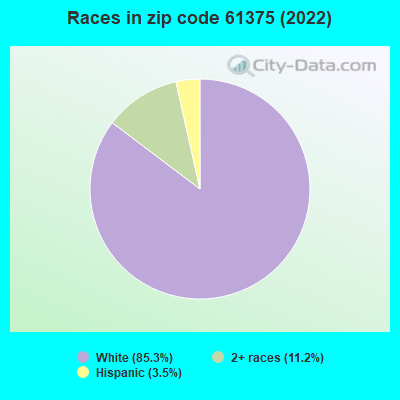
Black race population percentage significantly below state average.
Hispanic race population percentage significantly below state average.
Median age significantly above state average.
Foreign-born population percentage significantly below state average.
Renting percentage significantly below state average.
Length of stay since moving in significantly above state average.
Number of college students significantly below state average.
Percentage of population with a bachelor's degree or higher below state average.
Averages for the 2020 tax year for zip code 61375, filed in 2021:
Average Adjusted Gross Income (AGI) in 2020: $69,615 (Individual Income Tax Returns)
Here:
$69,615
State:
$82,626
Salary/wage: $56,892 (reported on 72.2% of returns)
Here:
$56,892
State:
$66,640
(% of AGI for various income ranges: 1038.2% for AGIs below $25k, 2571.2% for AGIs $25k-50k, 5815.0% for AGIs $50k-75k, 5930.0% for AGIs $75k-100k, 14974.0% for AGIs $100k-200k)
Taxable interest for individuals: $736 (reported on 46.3% of returns)
This zip code:
$736
Illinois:
$2,376
(% of AGI for various income ranges: 21.8% for AGIs below $25k, 32.5% for AGIs $25k-50k, 41.7% for AGIs $50k-75k, 28.0% for AGIs $75k-100k, 170.0% for AGIs $100k-200k)
Ordinary dividends: $3,720 (reported on 27.8% of returns)
Here:
$3,720
State:
$9,061
(% of AGI for various income ranges: 94.5% for AGIs below $25k, 70.0% for AGIs $25k-50k, 50.0% for AGIs $75k-100k, 406.0% for AGIs $100k-200k)
Net capital gain/loss in AGI: +$5,100 (reported on 24.1% of returns)
Here:
+$5,100
State:
+$31,684
(% of AGI for various income ranges: 488.3% for AGIs $50k-75k, 776.0% for AGIs $100k-200k)
Profit/loss from business: +$9,817 (reported on 11.1% of returns)
Here:
+$9,817
State:
+$12,175
(% of AGI for various income ranges: 370.0% for AGIs $25k-50k, 586.0% for AGIs $100k-200k)
Taxable individual retirement arrangement distribution: $12,988 (reported on 14.8% of returns)
61375:
$12,988
Illinois:
$21,613
(% of AGI for various income ranges: 97.3% for AGIs below $25k, 625.0% for AGIs $50k-75k, 1114.0% for AGIs $100k-200k)
Total itemized deductions: $24,500 (reported on 5.6% of returns)
Here:
$24,500
State:
$34,948
(% of AGI for various income ranges: 918.8% for AGIs $25k-50k)
Taxes paid: $8,550 (reported on 3.7% of returns)
61375:
$8,550
State:
$8,563
(% of AGI for various income ranges: 213.8% for AGIs $25k-50k)
Earned income credit: $2,067 (reported on 11.1% of returns)
Here:
$2,067
State:
$2,311
(% of AGI for various income ranges: 112.7% for AGIs below $25k)
Percentage of individuals using paid preparers for their 2020 taxes: 94.4%
Here:
94%
State:
93%
(% for various income ranges: 94.1% for AGIs below $25k, 90.0% for AGIs $25k-50k, 100.0% for AGIs $50k-75k, 100.0% for AGIs $75k-100k, 90.0% for AGIs $100k-200k, 100.0% for AGIs over 200k)
Averages for the 2012 tax year for zip code 61375, filed in 2013:
Average Adjusted Gross Income (AGI) in 2012: $59,494 (Individual Income Tax Returns)
Here:
$59,494
State:
$68,058
Salary/wage: $44,613 (reported on 73.6% of returns)
Here:
$44,613
State:
$55,396
(% of AGI for various income ranges: 61.8% for AGIs below $25k, 59.9% for AGIs $25k-50k, 61.8% for AGIs $50k-75k, 62.1% for AGIs $75k-100k, 48.5% for AGIs $100k-200k)
Taxable interest for individuals: $661 (reported on 58.5% of returns)
This zip code:
$661
Illinois:
$1,969
(% of AGI for various income ranges: 1.5% for AGIs below $25k, 1.0% for AGIs $25k-50k, 0.9% for AGIs $50k-75k, 0.6% for AGIs $75k-100k, 0.4% for AGIs $100k-200k)
Ordinary dividends: $1,814 (reported on 26.4% of returns)
Here:
$1,814
State:
$7,786
(% of AGI for various income ranges: 2.3% for AGIs below $25k, 1.0% for AGIs $25k-50k, 1.6% for AGIs $50k-75k, 0.6% for AGIs $100k-200k)
Net capital gain/loss in AGI: +$1,100 (reported on 17.0% of returns)
Here:
+$1,100
State:
+$22,183
(% of AGI for various income ranges: 1.6% for AGIs $25k-50k, 0.9% for AGIs $50k-75k)
Profit/loss from business: +$10,967 (reported on 11.3% of returns)
Here:
+$10,967
State:
+$12,903
Taxable individual retirement arrangement distribution: $8,920 (reported on 18.9% of returns)
61375:
$8,920
Illinois:
$17,929
(% of AGI for various income ranges: 5.5% for AGIs below $25k, 8.3% for AGIs $25k-50k, 8.2% for AGIs $75k-100k)
Total itemized deductions: $18,569 (16% of AGI, reported on 30.2% of returns)
Here:
$18,569
State:
$26,433
Here:
16.2% of AGI
State:
19.2% of AGI
(% of AGI for various income ranges: 13.9% for AGIs $25k-50k, 8.9% for AGIs $50k-75k, 12.2% for AGIs $75k-100k, 8.6% for AGIs $100k-200k)
Charity contributions: $2,023 (reported on 24.5% of returns)
Here:
$2,023
State:
$4,525
(% of AGI for various income ranges: 0.7% for AGIs $25k-50k, 0.9% for AGIs $50k-75k, 0.6% for AGIs $75k-100k, 1.0% for AGIs $100k-200k)
Taxes paid: $8,238 (reported on 30.2% of returns)
61375:
$8,238
State:
$11,968
(% of AGI for various income ranges: 4.1% for AGIs $25k-50k, 4.0% for AGIs $50k-75k, 4.5% for AGIs $75k-100k, 4.7% for AGIs $100k-200k)
Earned income credit: $2,160 (reported on 9.4% of returns)
Here:
$2,160
State:
$2,349
(% of AGI for various income ranges: 5.2% for AGIs below $25k)
Percentage of individuals using paid preparers for their 2012 taxes: 56.6%
Here:
57%
State:
57%
(% for various income ranges: 50.0% for AGIs below $25k, 53.8% for AGIs $25k-50k, 62.5% for AGIs $50k-75k, 50.0% for AGIs $75k-100k, 75.0% for AGIs $100k-200k)
Averages for the 2004 tax year for zip code 61375, filed in 2005:
Average Adjusted Gross Income (AGI) in 2004: $42,047 (Individual Income Tax Returns)
Here:
$42,047
State:
$54,625
Salary/wage: $36,629 (reported on 79.0% of returns)
Here:
$36,629
State:
$46,811
(% of AGI for various income ranges: 108.0% for AGIs below $10k, 67.7% for AGIs $10k-25k, 69.9% for AGIs $25k-50k, 69.8% for AGIs $50k-75k, 79.1% for AGIs $75k-100k, 57.4% for AGIs over 100k)
Taxable interest for individuals: $1,213 (reported on 60.4% of returns)
This zip code:
$1,213
Illinois:
$2,101
(% of AGI for various income ranges: 9.5% for AGIs below $10k, 6.1% for AGIs $10k-25k, 2.0% for AGIs $25k-50k, 1.2% for AGIs $50k-75k, 0.9% for AGIs $75k-100k, 0.6% for AGIs over 100k)
Taxable dividends: $1,827 (reported on 30.4% of returns)
Here:
$1,827
State:
$4,306
(% of AGI for various income ranges: 1.5% for AGIs below $10k, 2.3% for AGIs $10k-25k, 1.6% for AGIs $25k-50k, 0.7% for AGIs $50k-75k, 0.7% for AGIs $75k-100k, 1.8% for AGIs over 100k)
Net capital gain/loss: +$1,512 (reported on 22.6% of returns)
Here:
+$1,512
State:
+$17,321
(% of AGI for various income ranges: -2.4% for AGIs below $10k, 0.5% for AGIs $10k-25k, 0.0% for AGIs $25k-50k, 0.5% for AGIs $50k-75k, -0.1% for AGIs $75k-100k, 2.8% for AGIs over 100k)
Profit/loss from business: +$2,696 (reported on 14.3% of returns)
Here:
+$2,696
State:
+$11,771
(% of AGI for various income ranges: -1.7% for AGIs below $10k, 3.1% for AGIs $10k-25k, 2.7% for AGIs $25k-50k, 0.4% for AGIs $50k-75k)
Profit/loss from farming: +$1,816 (reported on 6.9% of returns)
Here:
+$1,816
State:
+$2,327
Total itemized deductions: $15,697 (22% of AGI, reported on 25.7% of returns)
Here:
$15,697
State:
$20,239
Here:
21.6% of AGI
State:
19.5% of AGI
(% of AGI for various income ranges: 12.2% for AGIs $10k-25k, 11.3% for AGIs $25k-50k, 8.3% for AGIs $50k-75k, 10.2% for AGIs $75k-100k, 8.9% for AGIs over 100k)
Charity contributions deductions: $2,189 (3% of AGI, reported on 22.1% of returns)
Here:
$2,189
State:
$3,719
Here:
2.8% of AGI
State:
3.4% of AGI
(% of AGI for various income ranges: 1.5% for AGIs $10k-25k, 0.8% for AGIs $25k-50k, 1.1% for AGIs $50k-75k, 1.6% for AGIs $75k-100k, 1.1% for AGIs over 100k)
Total tax: $6,303 (reported on 74.5% of returns)
61375:
$6,303
State:
$9,882
(% of AGI for various income ranges: 3.2% for AGIs below $10k, 3.5% for AGIs $10k-25k, 7.6% for AGIs $25k-50k, 9.5% for AGIs $50k-75k, 10.6% for AGIs $75k-100k, 19.6% for AGIs over 100k)
Earned income credit: $1,466 (reported on 10.5% of returns)
Here:
$1,466
State:
$1,788
Percentage of individuals using paid preparers for their 2004 taxes: 61.1%
Here:
61%
State:
61%
(% for various income ranges: 56.9% for AGIs below $10k, 68.3% for AGIs $10k-25k, 56.5% for AGIs $25k-50k, 61.0% for AGIs $50k-75k, 59.6% for AGIs $75k-100k, 71.9% for AGIs over 100k)
Household received Food Stamps/SNAP in the past 12 months: 33 Household did not receive Food Stamps/SNAP in the past 12 months: 438
Women who had a birth in the past 12 months: 10 (4 now married, 5 unmarried) Women who did not have a birth in the past 12 months: 147 (80 now married, 65 unmarried)
Housing units in zip code 61375 with a mortgage: 226 (11 second mortgage, 11 both second mortgage and home equity loan) Houses without a mortgage: 1
Median monthly owner costs for units with a mortgage: $1,225 Median monthly owner costs for units without a mortgage: $596
Residents with income below the poverty level in 2022:
This zip code:
5.2%
Whole state:
11.9%
Residents with income below 50% of the poverty level in 2022:
This zip code:
2.2%
Whole state:
5.7%
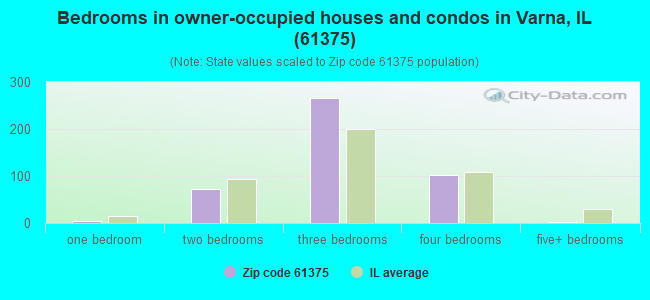
Median number of rooms in houses and condos:
Here:
6.4
State:
6.4
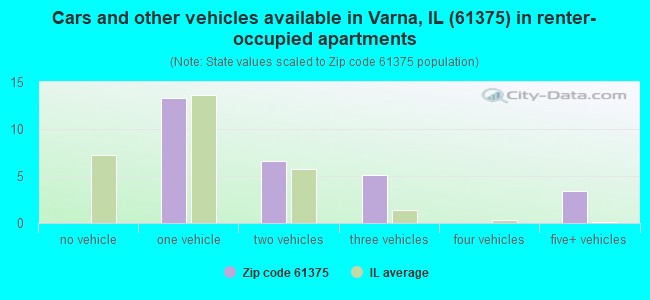
Median number of rooms in apartments:
Here:
5.6
State:
4.1
Notable locations in this zip code not listed on our city pages
115 married couples with children.
20 single-parent households (6 men, 14 women).
97.4% of residents of 61375 zip code speak English at home.
0.2% of residents speak Spanish at home (100% very well).
1.1% of residents speak other Indo-European language at home (100% very well).
1.3% of residents speak Asian or Pacific Island language at home (100% very well).
Foreign born population: 21 (1.9%) (4.6% of them are naturalized citizens)
This zip code:
1.9%
Whole state:
14.4%
95%France
5%El Salvador
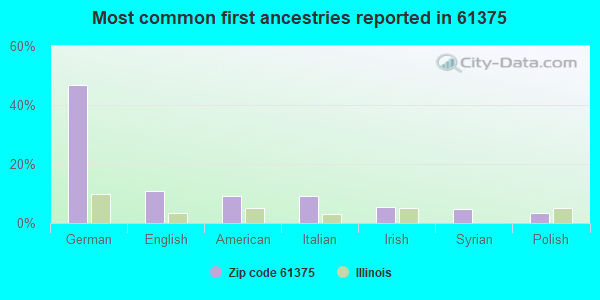
47%German
11%English
9%American
9%Italian
6%Irish
5%Syrian
3%Polish
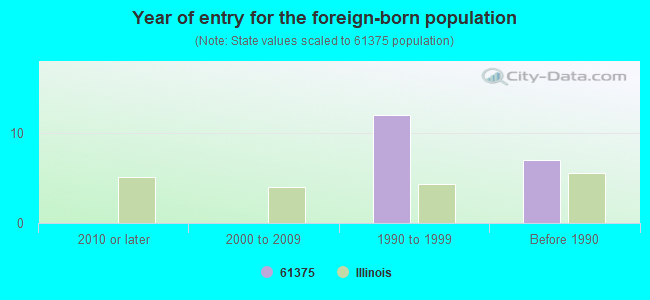
Year of entry for the foreign-born population
02010 or later
02000 to 2009
121990 to 1999
7Before 1990
Facilities with environmental interests located in this zip code:
MARSHALL PUTNAM OIL CO (RT 89 in VARNA, IL)
STATE MASTER (Illinois EPA Project) - AIR PROGRAM AIR MINOR (AIRS/AFS) (Resource Conservation and Recovery Act (tracking hazardous waste)) Business SIC classification: FERTILIZERS, MIXING ONLY Organizations: MARSHALL PUTNAM OIL COMPANY (CONTACT/OWNER)
MIDLAND HIGH SCHOOL (1830 STATE RT 17 in VARNA, IL)
(National Center for Education Statistics) - STATE ID-4305900700001 Organizations: MIDLAND COMMUNITY UNIT DIST 7 (SCHOOL DISTRICT)
MARSHALL PUTNAM OIL CO (RR 1 in VARNA, IL)
(Resource Conservation and Recovery Act (tracking hazardous waste)) Organizations: MARSHALL PUTNAM OIL COMPANY (CONTACT/OWNER)
GRANDVIEW SERVICE COMPANY (ROUTE 17 in VARNA, IL)
COMPLIANCE ACTIVITY (Tracking inspections of insecticide, fungicide, and rodenticide, and toxic substances) CRITERIA AND HAZARDOUS AIR POLLUTANT INVENTORY (Inventory of air pollution sources) Business SIC classification: PETROLEUM BULK STATIONS AND TERMINALS
AG VIEW FS INC.- VARNA (2194 STATE ROUTE 17 PO BOX 298 in VARNA, IL)
ENFORCEMENT/COMPLIANCE ACTIVITY (Integrated Compliance Information System)
MID COUNTY CU SCHOOL DIST 4 (RFD 1 RT 17 in VARNA, IL)
COMPLIANCE ACTIVITY (Tracking inspections of insecticide, fungicide, and rodenticide, and toxic substances)
Housing units lacking complete plumbing facilities: 0.1% Housing units lacking complete kitchen facilities: 0.2%
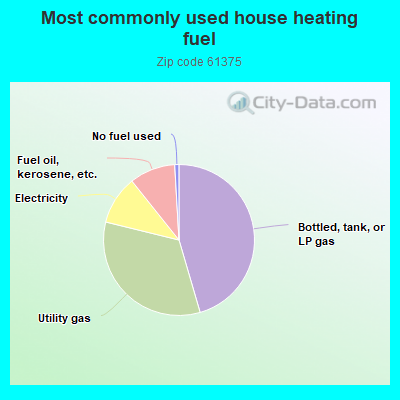
45.8%Bottled, tank, or LP gas
33.6%Utility gas
10.5%Electricity
9.9%Fuel oil, kerosene, etc.
0.9%No fuel used
Population in 1990: 1,527.
Place of birth for U.S.-born residents:
This state: 1,000
Northeast: 26
Midwest: 49
South: 27
West: 16
64% of the 61375 zip code residents lived in the same house 5 years ago. Out of people who lived in different houses, 52% lived in this county. Out of people who lived in different counties, 50% lived in Illinois.
95% of the 61375 zip code residents lived in the same house 1 year ago. Out of people who lived in different houses, 15% moved from this county. Out of people who lived in different houses, 72% moved from different county within same state. Out of people who lived in different houses, 4% moved from different state. Out of people who lived in different houses, 15% moved from abroad.
Private vs. public school enrollment:
Students in private schools in grades 1 to 8 (elementary and middle school): 9
Here:
7.8%
Illinois:
13.3%
Students in private schools in grades 9 to 12 (high school): 7
Here:
23.2%
Illinois:
9.9%
Students in private undergraduate colleges: 3
Here:
67.0%
Illinois:
27.4%
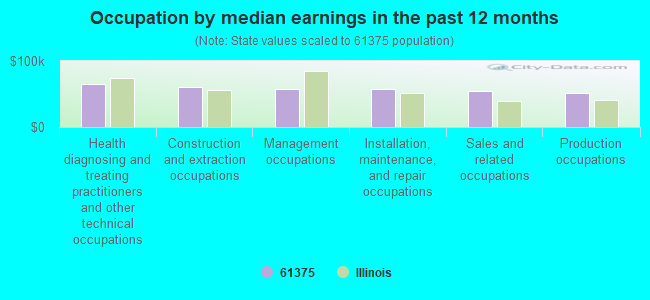
Occupation by median earnings in the past 12 months ($)
64,746Health diagnosing and treating practitioners and other technical occupations
60,351Construction and extraction occupations
58,180Management occupations
58,052Installation, maintenance, and repair occupations
54,985Sales and related occupations
50,842Production occupations
Top industries in this zip code by the number of employees in 2005:
Other Services (except Public Administration): Other Similar Organizations (except Business, Professional, Labor, and Political Organizations) (10-19 employees: 1 establishment)
Finance and Insurance: Commercial Banking (10-19: 1)
Other Services (except Public Administration): Religious Organizations (5-9: 1, 1-4: 2)
Wholesale Trade: Grain and Field Bean Merchant Wholesalers (5-9: 1)
Construction: New Single-Family Housing Construction (except Operative Builders) (1-4: 1)
Management of Companies and Enterprises: Offices of Bank Holding Companies (1-4: 1)
People in group quarters in 2000:
2 people in nursing homes
Fatal accident statistics in 2014:
Fatal accident count: 1
Vehicles involved in fatal accidents: 1
Fatal accidents caused by drunken drivers: 1
Fatalities: 1
Persons involved in fatal accidents: 1
Pedestrians involved in fatal accidents: 0
Fatal accident statistics in 2013:
Fatal accident count: 1
Vehicles involved in fatal accidents: 2
Fatal accidents caused by drunken drivers: 0
Fatalities: 2
Persons involved in fatal accidents: 2
Pedestrians involved in fatal accidents: 0
Most common first names in zip code 61375 among deceased individuals
Name
Count
Lived (average)
John
8
76.9 years
William
8
76.0 years
Charles
7
70.5 years
Joseph
7
77.6 years
Mary
6
68.7 years
Donald
6
67.5 years
George
6
74.3 years
Edith
6
82.7 years
Raymond
5
81.8 years
Robert
5
65.6 years
Most common last names in zip code 61375 among deceased individuals
Last name
Count
Lived (average)
Palm
7
76.5 years
Myers
7
78.7 years
Austin
6
75.2 years
Flesburg
6
82.4 years
Junker
6
77.7 years
Smith
6
73.3 years
Carlson
5
86.0 years
Lindstrom
5
85.2 years
Schumacher
5
78.8 years
Coleson
5
83.2 years
Businesses in zip code 61375
Jimmy John's: 2
MasterBrand Cabinets: 2
Discuss Varna, Illinois (IL) on our hugely popular Illinois forum.

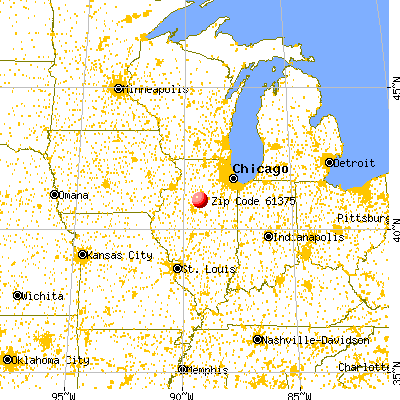


 Nearest zip codes: 61541, 61336, 61369, 61540, 61335, 61570.