Estimated zip code population in 2022: 2,517 Zip code population in 2010: 2,597 Zip code population in 2000: 2,615
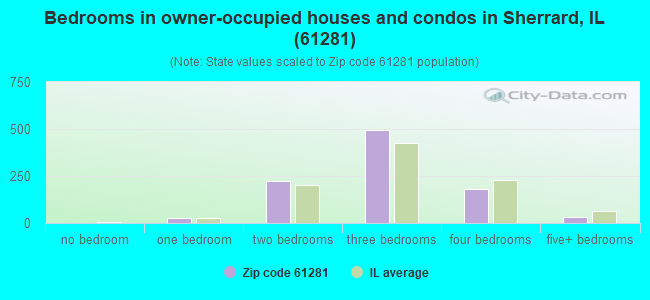
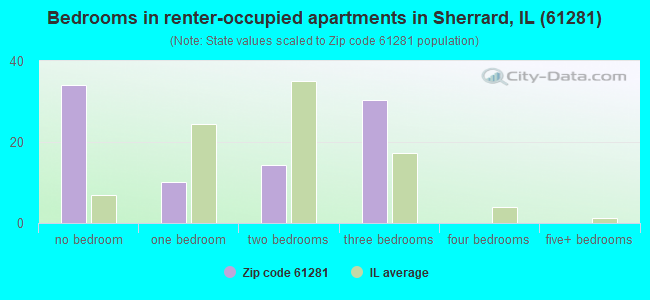
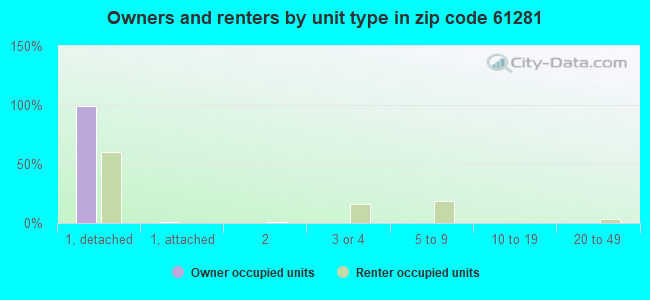
Houses and condos: 1,124 Renter-occupied apartments: 86
% of renters here:
8%
State:
33%
March 2022 cost of living index in zip code 61281: 84.8 (less than average, U.S. average is 100)
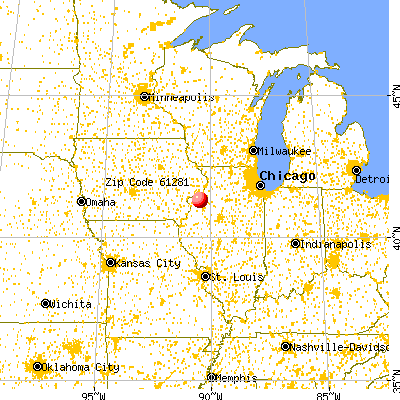
Land area: 38.5 sq. mi. Water area: 0.2 sq. mi.
Population density: 65 people per square mile
(very low).
OSM Map
General Map
Google Map
MSN Map
OSM Map
General Map
Google Map
MSN Map
OSM Map
General Map
Google Map
MSN Map
OSM Map
General Map
Google Map
MSN Map
Please wait while loading the map...
Real estate property taxes paid for housing units in 2022:
This zip code:
2.0% ($4,273)
Illinois:
2.0% ($4,912)
Median real estate property taxes paid for housing units with mortgages in 2022: $4,345 (2.0%) Median real estate property taxes paid for housing units with no mortgage in 2022: $2,982 (1.5%)
Business Search- 14 Million verified businesses
Males: 1,337
(53.1%)
Females: 1,179
(46.9%)
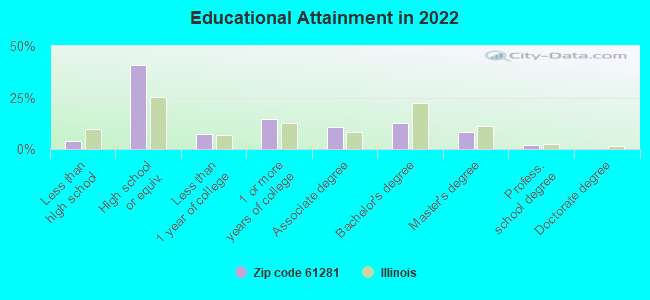
For population 25 years and over in 61281:
High school or higher: 95.3%
Bachelor's degree or higher: 23.0%
Graduate or professional degree: 10.5%
Unemployed: 2.1%
Mean travel time to work (commute): 26.8 minutes
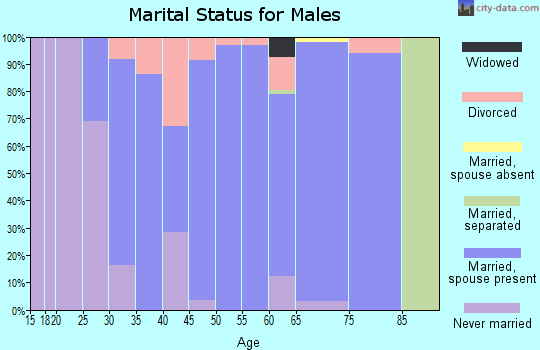
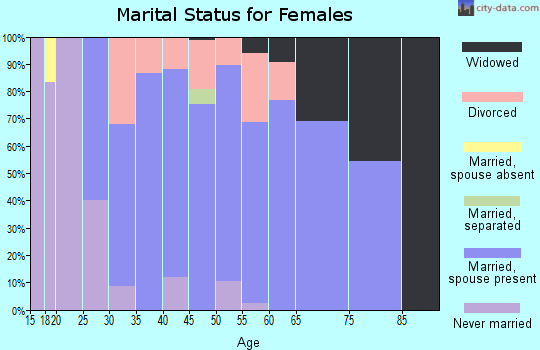
For population 15 years and over in 61281:
Never married: 22.8%
Now married: 65.0%
Separated: 1.3%
Widowed: 3.3%
Divorced: 7.6%
Zip code 61281 compared to state average:
Unemployed percentage below state average.
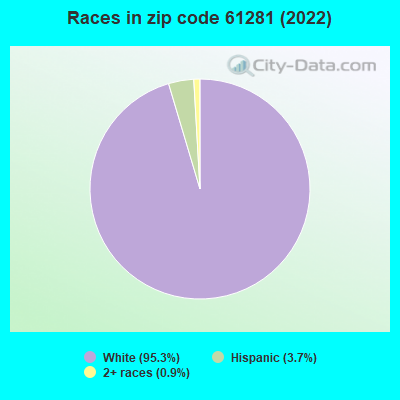
Black race population percentage significantly below state average.
Hispanic race population percentage significantly below state average.
Median age significantly above state average.
Foreign-born population percentage significantly below state average.
Renting percentage significantly below state average.
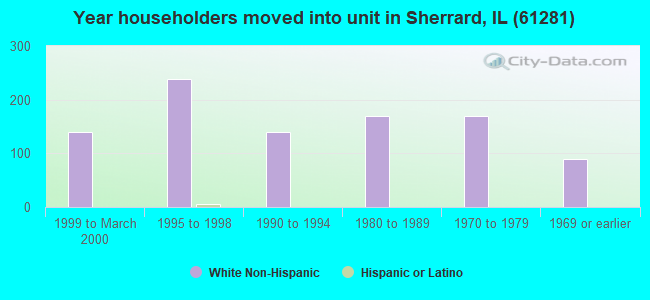
Length of stay since moving in significantly above state average.
Number of college students below state average.
Percentage of population with a bachelor's degree or higher below state average.
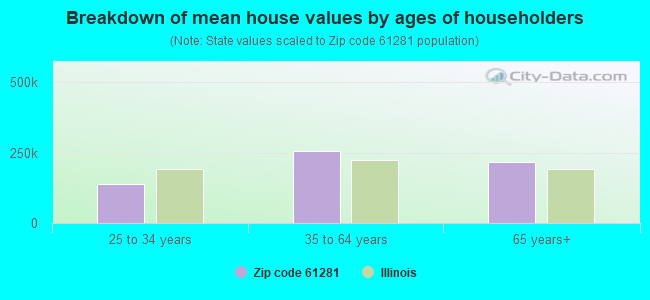
Estimated median house/condo value in 2022: $210,772
61281:
$210,772
Illinois:
$251,600
According to our research of Illinois and other state lists, there was 1 registered sex offender living in 61281 zip code as of May 04, 2024. The ratio of all residents to sex offenders in zip code 61281 is 2,684 to 1. The ratio of registered sex offenders to all residents in this zip code is much lower than the state average.
Median resident age:
This zip code:
49.9 years
Illinois median age:
39.1 years
Average household size:
This zip code:
2.4 people
Illinois:
2.4 people
Averages for the 2020 tax year for zip code 61281, filed in 2021:
Average Adjusted Gross Income (AGI) in 2020: $83,505 (Individual Income Tax Returns)
Here:
$83,505
State:
$82,626
Salary/wage: $65,671 (reported on 80.6% of returns)
Here:
$65,671
State:
$66,640
(% of AGI for various income ranges: 1059.2% for AGIs below $25k, 3096.5% for AGIs $25k-50k, 5071.4% for AGIs $50k-75k, 8773.0% for AGIs $75k-100k, 13242.6% for AGIs $100k-200k)
Taxable interest for individuals: $938 (reported on 42.6% of returns)
This zip code:
$938
Illinois:
$2,376
(% of AGI for various income ranges: 17.2% for AGIs below $25k, 27.5% for AGIs $25k-50k, 50.7% for AGIs $50k-75k, 42.0% for AGIs $75k-100k, 57.4% for AGIs $100k-200k)
Ordinary dividends: $4,804 (reported on 21.7% of returns)
Here:
$4,804
State:
$9,061
(% of AGI for various income ranges: 31.2% for AGIs below $25k, 44.5% for AGIs $25k-50k, 75.7% for AGIs $50k-75k, 70.0% for AGIs $75k-100k, 213.5% for AGIs $100k-200k)
Net capital gain/loss in AGI: +$5,357 (reported on 17.8% of returns)
Here:
+$5,357
State:
+$31,684
(% of AGI for various income ranges: 14.8% for AGIs below $25k, 32.0% for AGIs $25k-50k, 15.0% for AGIs $50k-75k, 83.0% for AGIs $75k-100k, 208.7% for AGIs $100k-200k)
Profit/loss from business: +$6,272 (reported on 14.0% of returns)
Here:
+$6,272
State:
+$12,175
(% of AGI for various income ranges: 45.6% for AGIs below $25k, 8.0% for AGIs $25k-50k, 123.6% for AGIs $50k-75k, 365.0% for AGIs $75k-100k, 200.4% for AGIs $100k-200k)
Taxable individual retirement arrangement distribution: $17,733 (reported on 11.6% of returns)
61281:
$17,733
Illinois:
$21,613
(% of AGI for various income ranges: 60.0% for AGIs below $25k, 180.0% for AGIs $25k-50k, 252.1% for AGIs $50k-75k, 390.0% for AGIs $75k-100k, 611.7% for AGIs $100k-200k)
Total itemized deductions: $24,783 (reported on 4.7% of returns)
Here:
$24,783
State:
$34,948
(% of AGI for various income ranges: 477.1% for AGIs $50k-75k, 356.1% for AGIs $100k-200k)
Charity contributions: $5,525 (reported on 3.1% of returns)
Here:
$5,525
State:
$13,122
(% of AGI for various income ranges: 96.1% for AGIs $100k-200k)
Taxes paid: $7,650 (reported on 4.7% of returns)
61281:
$7,650
State:
$8,563
(% of AGI for various income ranges: 140.7% for AGIs $50k-75k, 113.9% for AGIs $100k-200k)
Earned income credit: $2,009 (reported on 8.5% of returns)
Here:
$2,009
State:
$2,311
(% of AGI for various income ranges: 44.8% for AGIs below $25k, 54.5% for AGIs $25k-50k)
Percentage of individuals using paid preparers for their 2020 taxes: 94.6%
Here:
95%
State:
93%
(% for various income ranges: 91.4% for AGIs below $25k, 96.0% for AGIs $25k-50k, 94.1% for AGIs $50k-75k, 93.3% for AGIs $75k-100k, 96.8% for AGIs $100k-200k, 100.0% for AGIs over 200k)
Averages for the 2012 tax year for zip code 61281, filed in 2013:
Average Adjusted Gross Income (AGI) in 2012: $66,630 (Individual Income Tax Returns)
Here:
$66,630
State:
$68,058
Salary/wage: $56,028 (reported on 84.9% of returns)
Here:
$56,028
State:
$55,396
(% of AGI for various income ranges: 67.5% for AGIs below $25k, 63.4% for AGIs $25k-50k, 71.1% for AGIs $50k-75k, 77.0% for AGIs $75k-100k, 80.9% for AGIs $100k-200k, 48.9% for AGIs over 200k)
Taxable interest for individuals: $995 (reported on 46.8% of returns)
This zip code:
$995
Illinois:
$1,969
(% of AGI for various income ranges: 2.2% for AGIs below $25k, 1.1% for AGIs $25k-50k, 0.7% for AGIs $50k-75k, 0.6% for AGIs $75k-100k, 0.4% for AGIs $100k-200k, 0.7% for AGIs over 200k)
Ordinary dividends: $2,486 (reported on 23.0% of returns)
Here:
$2,486
State:
$7,786
(% of AGI for various income ranges: 1.5% for AGIs below $25k, 1.0% for AGIs $25k-50k, 0.6% for AGIs $50k-75k, 0.7% for AGIs $75k-100k, 1.3% for AGIs $100k-200k)
Net capital gain/loss in AGI: +$1,486 (reported on 16.7% of returns)
Here:
+$1,486
State:
+$22,183
(% of AGI for various income ranges: 0.1% for AGIs $25k-50k, 0.3% for AGIs $50k-75k, 0.9% for AGIs $100k-200k)
Profit/loss from business: +$9,065 (reported on 13.5% of returns)
Here:
+$9,065
State:
+$12,903
(% of AGI for various income ranges: 2.3% for AGIs below $25k, 5.8% for AGIs $25k-50k, 1.2% for AGIs $50k-75k, 1.5% for AGIs $75k-100k, 1.8% for AGIs $100k-200k)
Taxable individual retirement arrangement distribution: $14,700 (reported on 11.9% of returns)
61281:
$14,700
Illinois:
$17,929
(% of AGI for various income ranges: 6.2% for AGIs below $25k, 1.5% for AGIs $25k-50k, 2.5% for AGIs $50k-75k, 2.1% for AGIs $75k-100k, 3.8% for AGIs $100k-200k)
Total itemized deductions: $19,902 (18% of AGI, reported on 37.3% of returns)
Here:
$19,902
State:
$26,433
Here:
17.6% of AGI
State:
19.2% of AGI
(% of AGI for various income ranges: 11.6% for AGIs $25k-50k, 10.1% for AGIs $50k-75k, 11.4% for AGIs $75k-100k, 13.8% for AGIs $100k-200k, 9.1% for AGIs over 200k)
Charity contributions: $2,938 (reported on 27.0% of returns)
Here:
$2,938
State:
$4,525
(% of AGI for various income ranges: 0.5% for AGIs $25k-50k, 0.9% for AGIs $50k-75k, 1.1% for AGIs $75k-100k, 1.4% for AGIs $100k-200k, 2.0% for AGIs over 200k)
Taxes paid: $9,515 (reported on 37.3% of returns)
61281:
$9,515
State:
$11,968
(% of AGI for various income ranges: 3.6% for AGIs $25k-50k, 4.0% for AGIs $50k-75k, 5.3% for AGIs $75k-100k, 7.1% for AGIs $100k-200k, 5.5% for AGIs over 200k)
Earned income credit: $2,040 (reported on 7.9% of returns)
Here:
$2,040
State:
$2,349
(% of AGI for various income ranges: 3.3% for AGIs below $25k, 0.7% for AGIs $25k-50k)
Percentage of individuals using paid preparers for their 2012 taxes: 57.1%
Here:
57%
State:
57%
(% for various income ranges: 50.0% for AGIs below $25k, 47.8% for AGIs $25k-50k, 66.7% for AGIs $50k-75k, 66.7% for AGIs $75k-100k, 60.9% for AGIs $100k-200k, 66.7% for AGIs over 200k)
Averages for the 2004 tax year for zip code 61281, filed in 2005:
Average Adjusted Gross Income (AGI) in 2004: $51,240 (Individual Income Tax Returns)
Here:
$51,240
State:
$54,625
Salary/wage: $47,580 (reported on 86.4% of returns)
Here:
$47,580
State:
$46,811
(% of AGI for various income ranges: 96.3% for AGIs below $10k, 68.0% for AGIs $10k-25k, 76.8% for AGIs $25k-50k, 83.2% for AGIs $50k-75k, 83.9% for AGIs $75k-100k, 79.3% for AGIs over 100k)
Taxable interest for individuals: $955 (reported on 61.5% of returns)
This zip code:
$955
Illinois:
$2,101
(% of AGI for various income ranges: 9.2% for AGIs below $10k, 5.0% for AGIs $10k-25k, 1.4% for AGIs $25k-50k, 0.8% for AGIs $50k-75k, 0.8% for AGIs $75k-100k, 0.4% for AGIs over 100k)
Taxable dividends: $1,341 (reported on 27.1% of returns)
Here:
$1,341
State:
$4,306
(% of AGI for various income ranges: 1.6% for AGIs below $10k, 1.7% for AGIs $10k-25k, 0.6% for AGIs $25k-50k, 0.6% for AGIs $50k-75k, 0.8% for AGIs $75k-100k, 0.5% for AGIs over 100k)
Net capital gain/loss: +$2,310 (reported on 19.3% of returns)
Here:
+$2,310
State:
+$17,321
(% of AGI for various income ranges: 3.1% for AGIs below $10k, 0.4% for AGIs $10k-25k, 0.1% for AGIs $25k-50k, 0.1% for AGIs $50k-75k, 0.4% for AGIs $75k-100k, 2.0% for AGIs over 100k)
Profit/loss from business: +$5,225 (reported on 13.8% of returns)
Here:
+$5,225
State:
+$11,771
(% of AGI for various income ranges: 3.4% for AGIs below $10k, 2.8% for AGIs $10k-25k, 2.0% for AGIs $25k-50k, 1.0% for AGIs $50k-75k, 0.2% for AGIs $75k-100k, 1.8% for AGIs over 100k)
IRA payment deduction: $3,188 (reported on 2.5% of returns)
61281:
$3,188
Illinois:
$3,087
Total itemized deductions: $16,321 (19% of AGI, reported on 34.0% of returns)
Here:
$16,321
State:
$20,239
Here:
18.7% of AGI
State:
19.5% of AGI
(% of AGI for various income ranges: 7.8% for AGIs $10k-25k, 9.1% for AGIs $25k-50k, 10.3% for AGIs $50k-75k, 11.4% for AGIs $75k-100k, 12.7% for AGIs over 100k)
Charity contributions deductions: $2,030 (2% of AGI, reported on 28.7% of returns)
Here:
$2,030
State:
$3,719
Here:
2.2% of AGI
State:
3.4% of AGI
(% of AGI for various income ranges: 0.5% for AGIs $10k-25k, 0.6% for AGIs $25k-50k, 1.1% for AGIs $50k-75k, 1.2% for AGIs $75k-100k, 1.5% for AGIs over 100k)
Total tax: $6,976 (reported on 80.2% of returns)
61281:
$6,976
State:
$9,882
(% of AGI for various income ranges: 2.6% for AGIs below $10k, 3.9% for AGIs $10k-25k, 6.9% for AGIs $25k-50k, 8.7% for AGIs $50k-75k, 10.4% for AGIs $75k-100k, 16.0% for AGIs over 100k)
Earned income credit: $1,573 (reported on 7.6% of returns)
Here:
$1,573
State:
$1,788
Percentage of individuals using paid preparers for their 2004 taxes: 56.2%
Here:
56%
State:
61%
(% for various income ranges: 48.9% for AGIs below $10k, 53.5% for AGIs $10k-25k, 56.8% for AGIs $25k-50k, 60.5% for AGIs $50k-75k, 60.7% for AGIs $75k-100k, 59.1% for AGIs over 100k)
Likely homosexual households (counted as self-reported same-sex unmarried-partner households)
Lesbian couples: 1.1% of all households
Gay men: 0.0% of all households
Household received Food Stamps/SNAP in the past 12 months: 46 Household did not receive Food Stamps/SNAP in the past 12 months: 977
Women who had a birth in the past 12 months: 2 (0 now married, 2 unmarried) Women who did not have a birth in the past 12 months: 511 (313 now married, 193 unmarried)
Housing units in zip code 61281 with a mortgage: 657 (57 second mortgage, 30 both second mortgage and home equity loan) Houses without a mortgage: 34
Median monthly owner costs for units with a mortgage: $1,352 Median monthly owner costs for units without a mortgage: $673
Residents with income below the poverty level in 2022:
This zip code:
3.2%
Whole state:
11.9%
Residents with income below 50% of the poverty level in 2022:
This zip code:
0.4%
Whole state:
5.7%
Median number of rooms in houses and condos:
Here:
6.5
State:
6.4
Median number of rooms in apartments:
Here:
4.7
State:
4.1
Notable locations in this zip code not listed on our city pages
Cemeteries: Quaker Cemetery (1), Cable Village Cemetery (2), Preemption Cemetery (3), Schoening Family Cemetery (4), Brushwood Cemetery (5), Sherrard Cemetery (6), German Cemetery (7). Display/hide their locations on the map
Size of family households: 428 2-persons, 143 3-persons, 100 4-persons, 71 5-persons, 30 6-persons
Size of nonfamily households: 221 1-person, 36 2-persons
371 married couples with children.
45 single-parent households (24 men, 21 women).
97.0% of residents of 61281 zip code speak English at home.
1.9% of residents speak Spanish at home (81% very well, 19% well).
0.6% of residents speak other Indo-European language at home (64% very well, 21% well, 14% not well).
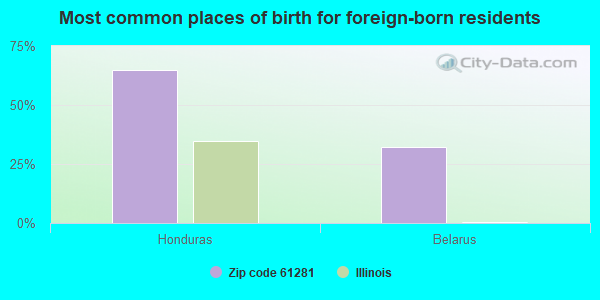
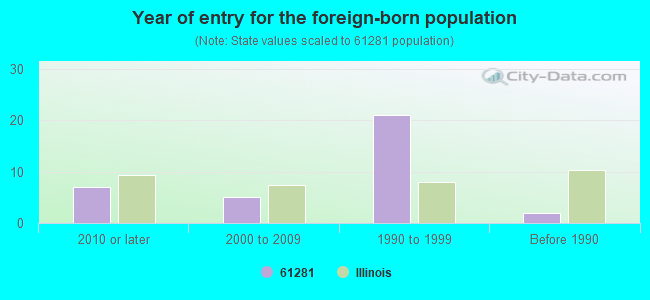
Foreign born population: 34 (1.4%) (62.0% of them are naturalized citizens)
This zip code:
1.4%
Whole state:
14.4%
65%Honduras
32%Belarus
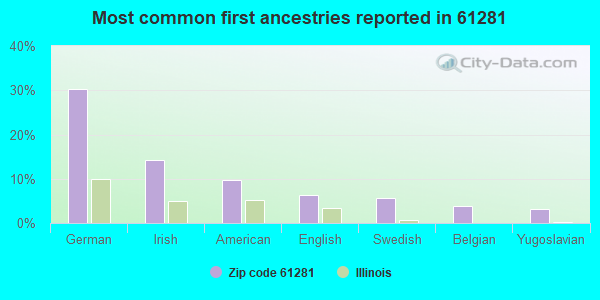
30%German
14%Irish
10%American
6%English
6%Swedish
4%Belgian
3%Yugoslavian
Year of entry for the foreign-born population
72010 or later
52000 to 2009
211990 to 1999
2Before 1990
Facilities with environmental interests located in this zip code:
SHERRARD JUNIOR-SENIOR HS (176TH AVENUE in SHERRARD, IL)
STATE MASTER (Illinois EPA Project) - National Pollutant Discharge Elimination System Permit National Pollutant Discharge Elimination System NON-MAJOR (Tracking pollutant discharge elimination systems) - permit National Pollutant Discharge Elimination System NON-MAJOR (Tracking pollutant discharge elimination systems) - permit Business SIC classification: ELEMENTARY AND SECONDARY SCHOOLS Organizations: SHERRARD JR-SR HIGH SCHOOL (CONTACT/OWNER)
Alternative names: SHERRARD HIGH SCHOOL, SHERRARD JR HIGH SCHOOL, SHERRARD JR-SR HIGH SCHOOL STP
CAROTHERS INC (RTE 1 in SHERRARD, IL)
STATE MASTER (Illinois EPA Project) - HAZARDOUS WASTE PROGRAM (Resource Conservation and Recovery Act (tracking hazardous waste)) Organizations: CAROTHERS DAN (CONTACT/OWNER)
SHERRARD STP (COUNTY ROAD 1 in SHERRARD, IL)
STATE MASTER (Illinois EPA Project) - National Pollutant Discharge Elimination System Permit National Pollutant Discharge Elimination System NON-MAJOR (Tracking pollutant discharge elimination systems) - permit Business SIC classification: SEWERAGE SYSTEMS Alternative names: SHERRARD STP, VILLAGE OF
SHERRARD ELEMENTARY SCHOOL (209 N FIRST ST in SHERRARD, IL)
(National Center for Education Statistics) - STATE ID-4908120002006 Organizations: SHERRARD COMM UNIT SCH DIST 200 (SCHOOL DISTRICT)
Housing units lacking complete plumbing facilities: 2.8% Housing units lacking complete kitchen facilities: 3.4%
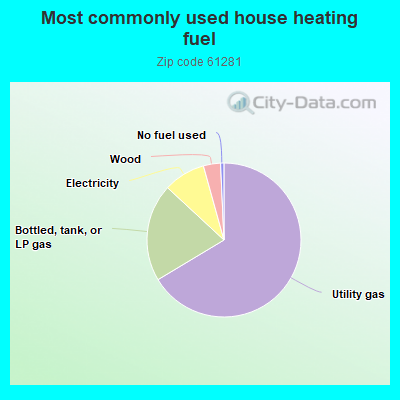
66.4%Utility gas
20.5%Bottled, tank, or LP gas
8.8%Electricity
3.6%Wood
0.7%No fuel used
Population in 1990: 2,192. Population change in the 1990s: +423 (+19.3%).
Place of birth for U.S.-born residents:
This state: 1,584
Northeast: 71
Midwest: 596
South: 200
West: 23
59% of the 61281 zip code residents lived in the same house 5 years ago. Out of people who lived in different houses, 23% lived in this county. Out of people who lived in different counties, 50% lived in Illinois.
95% of the 61281 zip code residents lived in the same house 1 year ago. Out of people who lived in different houses, 6% moved from this county. Out of people who lived in different houses, 65% moved from different county within same state. Out of people who lived in different houses, 31% moved from different state. Out of people who lived in different houses, 5% moved from abroad.
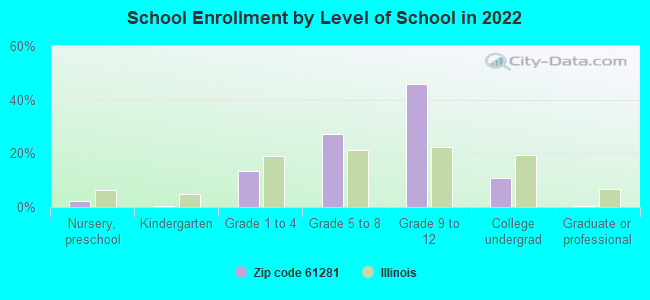
Private vs. public school enrollment:
Students in private schools in grades 1 to 8 (elementary and middle school): 9
Here:
4.3%
Illinois:
13.3%
Students in private schools in grades 9 to 12 (high school): 67
Here:
27.4%
Illinois:
9.9%
Students in private undergraduate colleges: 14
Here:
24.4%
Illinois:
27.4%
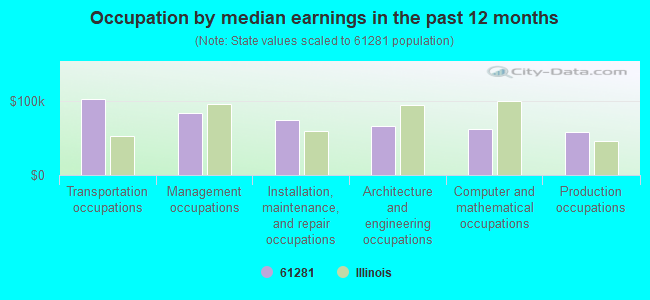
Occupation by median earnings in the past 12 months ($)
102,233Transportation occupations
84,012Management occupations
73,928Installation, maintenance, and repair occupations
66,225Architecture and engineering occupations
62,107Computer and mathematical occupations
58,324Production occupations
Companies with federal contracts located in this zip code:
LOVING GARAGE DOOR (2930 140TH AVE in SHERRARD, IL; small business)
$7,305 with Defense Commissary Agency for Maintenance, Repair and Rebuilding of Equipment -- Service and Trade Equipment. Signed on 2005-08-19. Completion date: 2006-07-31.
JACK & TREVA PIERSON (406 1 2 3RD STREET in SHERRARD, IL; small business) : -$1,457 in 2 contractsin 2002
$0 with U.S. Army Corps of Engineers - civil program financing only for Custodial Janitorial Services. Taking place in IA. Signed on 2002-03-12. Completion date: 2002-03-31.
-$1,457, same as above.Signed on 2002-03-12. Completion date: 2002-03-31.
Top industries in this zip code by the number of employees in 2005:
Health Care and Social Assistance: Child Day Care Services (10-19 employees: 1 establishment)
Finance and Insurance: Commercial Banking (10-19: 1)
Accommodation and Food Services: Full-Service Restaurants (10-19: 1)
Other Services (except Public Administration): Other Similar Organizations (except Business, Professional, Labor, and Political Organizations) (5-9: 1)
Other Services (except Public Administration): Civic and Social Organizations (1-4: 3)
Other Services (except Public Administration): Religious Organizations (1-4: 2)
Other Services (except Public Administration): General Automotive Repair (1-4: 2)
Wholesale Trade: Electrical Apparatus and Equipment, Wiring Supplies, and Related Equipment Merchant Wholesalers (1-4: 2)
Fatal accident statistics in 2013:
Fatal accident count: 1
Vehicles involved in fatal accidents: 1
Fatal accidents caused by drunken drivers: 0
Fatalities: 1
Persons involved in fatal accidents: 1
Pedestrians involved in fatal accidents: 0
Fatal accident statistics in 2010:
Fatal accident count: 1
Vehicles involved in fatal accidents: 1
Fatal accidents caused by drunken drivers: 1
Fatalities: 1
Persons involved in fatal accidents: 1
Pedestrians involved in fatal accidents: 0
2003 - 2018 National Fire Incident Reporting System (NFIRS) incidents
Based on the data from the years 2003 - 2018 the average number of fire incidents per year is 15. The highest number of fire incidents - 29 took place in 2009, and the least - 1 in 2005. The data has a growing trend.
When looking into fire subcategories, the most reports belonged to: Outside Fires (42.7%), and Structure Fires (41.5%).
Fire incident types reported to NFIRS in Zip Code 61281


 Nearest zip codes: 61276, 61263, 61465, 61486, 61264, 61273.


 Based on the data from the years 2003 - 2018 the average number of fire incidents per year is 15. The highest number of fire incidents - 29 took place in 2009, and the least - 1 in 2005. The data has a growing trend.
 When looking into fire subcategories, the most reports belonged to: Outside Fires (42.7%), and Structure Fires (41.5%).