Estimated zip code population in 2022: 945 Zip code population in 2010: 928 Zip code population in 2000: 348
Houses and condos: 361 Renter-occupied apartments: 8
% of renters here:
2%
State:
33%
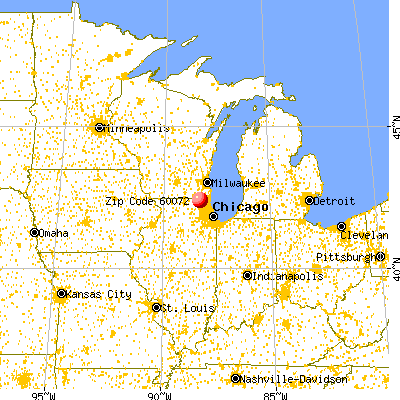
March 2022 cost of living index in zip code 60072: 96.6 (near average, U.S. average is 100)
Land area: 8.0 sq. mi. Water area: 0.0 sq. mi.
Population density: 119 people per square mile
(very low).
OSM Map
General Map
Google Map
MSN Map
OSM Map
General Map
Google Map
MSN Map
OSM Map
General Map
Google Map
MSN Map
OSM Map
General Map
Google Map
MSN Map
Please wait while loading the map...
Real estate property taxes paid for housing units in 2022:
This zip code:
2.2% ($8,350)
Illinois:
2.0% ($4,912)
Median real estate property taxes paid for housing units with mortgages in 2022: $7,784 (1.9%) Median real estate property taxes paid for housing units with no mortgage in 2022: $9,305 (2.6%)
Estimated median house/condo value in 2022: $388,186
60072:
$388,186
Illinois:
$251,600
According to our research of Illinois and other state lists, there was 1 registered sex offender living in 60072 zip code as of May 28, 2024. The ratio of all residents to sex offenders in zip code 60072 is 968 to 1. The ratio of registered sex offenders to all residents in this zip code is lower than the state average.
Median resident age:
This zip code:
48.7 years
Illinois median age:
39.1 years
Average household size:
This zip code:
2.7 people
Illinois:
2.4 people
Averages for the 2020 tax year for zip code 60072, filed in 2021:
Average Adjusted Gross Income (AGI) in 2020: $104,413 (Individual Income Tax Returns)
Here:
$104,413
State:
$82,626
Salary/wage: $89,160 (reported on 81.1% of returns)
Here:
$89,160
State:
$66,640
(% of AGI for various income ranges: 1005.6% for AGIs below $25k, 3332.9% for AGIs $25k-50k, 6797.5% for AGIs $50k-75k, 8880.0% for AGIs $75k-100k, 14145.0% for AGIs $100k-200k)
Taxable interest for individuals: $952 (reported on 39.6% of returns)
This zip code:
$952
Illinois:
$2,376
(% of AGI for various income ranges: 10.0% for AGIs below $25k, 12.9% for AGIs $25k-50k, 75.0% for AGIs $50k-75k, 57.0% for AGIs $100k-200k)
Ordinary dividends: $4,360 (reported on 28.3% of returns)
Here:
$4,360
State:
$9,061
(% of AGI for various income ranges: 64.4% for AGIs below $25k, 187.5% for AGIs $50k-75k, 355.0% for AGIs $100k-200k)
Net capital gain/loss in AGI: +$9,312 (reported on 30.2% of returns)
Here:
+$9,312
State:
+$31,684
(% of AGI for various income ranges: 142.9% for AGIs $25k-50k, 40.0% for AGIs $50k-75k, 428.0% for AGIs $100k-200k)
Profit/loss from business: +$21,711 (reported on 17.0% of returns)
Here:
+$21,711
State:
+$12,175
(% of AGI for various income ranges: 331.4% for AGIs $25k-50k, 1722.0% for AGIs $100k-200k)
Taxable individual retirement arrangement distribution: $32,914 (reported on 13.2% of returns)
60072:
$32,914
Illinois:
$21,613
(% of AGI for various income ranges: 728.6% for AGIs $25k-50k, 1794.0% for AGIs $100k-200k)
Total itemized deductions: $27,600 (reported on 13.2% of returns)
Here:
$27,600
State:
$34,948
(% of AGI for various income ranges: 895.7% for AGIs $25k-50k, 1305.0% for AGIs $100k-200k)
Charity contributions: $4,820 (reported on 9.4% of returns)
Here:
$4,820
State:
$13,122
(% of AGI for various income ranges: 241.0% for AGIs $100k-200k)
Taxes paid: $8,971 (reported on 13.2% of returns)
60072:
$8,971
State:
$8,563
(% of AGI for various income ranges: 271.4% for AGIs $25k-50k, 438.0% for AGIs $100k-200k)
Earned income credit: $1,600 (reported on 7.5% of returns)
Here:
$1,600
State:
$2,311
(% of AGI for various income ranges: 71.1% for AGIs below $25k)
Percentage of individuals using paid preparers for their 2020 taxes: 96.2%
Here:
96%
State:
93%
(% for various income ranges: 100.0% for AGIs below $25k, 100.0% for AGIs $25k-50k, 100.0% for AGIs $50k-75k, 80.0% for AGIs $75k-100k, 92.9% for AGIs $100k-200k, 100.0% for AGIs over 200k)
Averages for the 2012 tax year for zip code 60072, filed in 2013:
Average Adjusted Gross Income (AGI) in 2012: $78,856 (Individual Income Tax Returns)
Here:
$78,856
State:
$68,058
Salary/wage: $63,374 (reported on 81.2% of returns)
Here:
$63,374
State:
$55,396
(% of AGI for various income ranges: 61.6% for AGIs below $25k, 74.2% for AGIs $25k-50k, 79.5% for AGIs $50k-75k, 68.5% for AGIs $75k-100k, 74.4% for AGIs $100k-200k, 47.5% for AGIs over 200k)
Taxable interest for individuals: $590 (reported on 43.8% of returns)
This zip code:
$590
Illinois:
$1,969
(% of AGI for various income ranges: 1.0% for AGIs below $25k, 0.2% for AGIs $25k-50k, 0.6% for AGIs $50k-75k, 0.4% for AGIs $75k-100k, 0.4% for AGIs $100k-200k)
Ordinary dividends: $1,771 (reported on 29.2% of returns)
Here:
$1,771
State:
$7,786
(% of AGI for various income ranges: 3.8% for AGIs below $25k, 1.8% for AGIs $50k-75k, 0.9% for AGIs $100k-200k)
Profit/loss from business: +$11,467 (reported on 12.5% of returns)
Here:
+$11,467
State:
+$12,903
Taxable individual retirement arrangement distribution: $20,686 (reported on 14.6% of returns)
60072:
$20,686
Illinois:
$17,929
Total itemized deductions: $24,660 (20% of AGI, reported on 52.1% of returns)
Here:
$24,660
State:
$26,433
Here:
20.1% of AGI
State:
19.2% of AGI
(% of AGI for various income ranges: 26.4% for AGIs below $25k, 16.1% for AGIs $25k-50k, 18.5% for AGIs $50k-75k, 17.6% for AGIs $75k-100k, 18.6% for AGIs $100k-200k, 11.0% for AGIs over 200k)
Charity contributions: $2,048 (reported on 43.8% of returns)
Here:
$2,048
State:
$4,525
(% of AGI for various income ranges: 1.3% for AGIs $25k-50k, 0.9% for AGIs $50k-75k, 0.9% for AGIs $75k-100k, 1.7% for AGIs $100k-200k, 0.8% for AGIs over 200k)
Taxes paid: $12,776 (reported on 52.1% of returns)
60072:
$12,776
State:
$11,968
(% of AGI for various income ranges: 9.7% for AGIs below $25k, 8.1% for AGIs $25k-50k, 9.1% for AGIs $50k-75k, 8.6% for AGIs $75k-100k, 9.6% for AGIs $100k-200k, 6.8% for AGIs over 200k)
Earned income credit: $1,725 (reported on 8.3% of returns)
Here:
$1,725
State:
$2,349
(% of AGI for various income ranges: 4.1% for AGIs below $25k)
Percentage of individuals using paid preparers for their 2012 taxes: 58.3%
Here:
58%
State:
57%
(% for various income ranges: 47.1% for AGIs below $25k, 57.1% for AGIs $25k-50k, 66.7% for AGIs $50k-75k, 80.0% for AGIs $75k-100k, 80.0% for AGIs $100k-200k)
Averages for the 2004 tax year for zip code 60072, filed in 2005:
Average Adjusted Gross Income (AGI) in 2004: $71,057 (Individual Income Tax Returns)
Here:
$71,057
State:
$54,625
Salary/wage: $57,700 (reported on 86.3% of returns)
Here:
$57,700
State:
$46,811
(% of AGI for various income ranges: 88.6% for AGIs below $10k, 63.5% for AGIs $10k-25k, 72.0% for AGIs $25k-50k, 78.3% for AGIs $50k-75k, 87.4% for AGIs $75k-100k, 61.8% for AGIs over 100k)
Taxable interest for individuals: $1,405 (reported on 62.7% of returns)
This zip code:
$1,405
Illinois:
$2,101
(% of AGI for various income ranges: 2.7% for AGIs below $10k, 3.5% for AGIs $10k-25k, 2.8% for AGIs $25k-50k, 0.7% for AGIs $50k-75k, 0.6% for AGIs $75k-100k, 1.2% for AGIs over 100k)
Taxable dividends: $1,527 (reported on 33.9% of returns)
Here:
$1,527
State:
$4,306
(% of AGI for various income ranges: 1.1% for AGIs below $10k, 0.5% for AGIs $10k-25k, 1.3% for AGIs $25k-50k, 0.8% for AGIs $50k-75k, 0.3% for AGIs $75k-100k, 0.8% for AGIs over 100k)
Net capital gain/loss: +$8,636 (reported on 27.0% of returns)
Here:
+$8,636
State:
+$17,321
(% of AGI for various income ranges: -0.5% for AGIs below $10k, -0.1% for AGIs $10k-25k, -0.1% for AGIs $25k-50k, -0.1% for AGIs $50k-75k, 0.3% for AGIs $75k-100k, 5.9% for AGIs over 100k)
Profit/loss from business: +$15,055 (reported on 16.7% of returns)
Here:
+$15,055
State:
+$11,771
(% of AGI for various income ranges: 41.4% for AGIs below $10k, 10.6% for AGIs $25k-50k, 5.6% for AGIs $50k-75k, 2.6% for AGIs $75k-100k, 1.8% for AGIs over 100k)
Total itemized deductions: $20,534 (19% of AGI, reported on 54.0% of returns)
Here:
$20,534
State:
$20,239
Here:
18.9% of AGI
State:
19.5% of AGI
(% of AGI for various income ranges: 30.7% for AGIs $10k-25k, 17.0% for AGIs $25k-50k, 20.0% for AGIs $50k-75k, 21.7% for AGIs $75k-100k, 11.6% for AGIs over 100k)
Charity contributions deductions: $2,178 (2% of AGI, reported on 48.7% of returns)
Here:
$2,178
State:
$3,719
Here:
1.9% of AGI
State:
3.4% of AGI
(% of AGI for various income ranges: 2.3% for AGIs $10k-25k, 1.5% for AGIs $25k-50k, 1.7% for AGIs $50k-75k, 1.7% for AGIs $75k-100k, 1.4% for AGIs over 100k)
Total tax: $12,275 (reported on 79.9% of returns)
60072:
$12,275
State:
$9,882
(% of AGI for various income ranges: 4.6% for AGIs below $10k, 4.5% for AGIs $10k-25k, 8.4% for AGIs $25k-50k, 8.2% for AGIs $50k-75k, 8.5% for AGIs $75k-100k, 18.5% for AGIs over 100k)
Earned income credit: $1,207 (reported on 6.6% of returns)
Here:
$1,207
State:
$1,788
Percentage of individuals using paid preparers for their 2004 taxes: 64.1%
Here:
64%
State:
61%
(% for various income ranges: 43.5% for AGIs below $10k, 62.1% for AGIs $10k-25k, 68.2% for AGIs $25k-50k, 73.4% for AGIs $50k-75k, 72.9% for AGIs $75k-100k, 68.6% for AGIs over 100k)
Size of family households: 160 2-persons, 50 3-persons, 55 4-persons, 10 5-persons, 17 7-or-more-persons
Size of nonfamily households: 54 1-person, 7 2-persons
195 married couples with children.
0 single-parent households ().
96.3% of residents of 60072 zip code speak English at home.
1.5% of residents speak Spanish at home (100% very well).
1.4% of residents speak other Indo-European language at home (100% very well).
Foreign born population: 8 (0.8%) (25.2% of them are naturalized citizens)
This zip code:
0.8%
Whole state:
14.4%
38%United Kingdom, excluding England and Scotland
25%Sweden
25%North Macedonia (Macedonia)
12%Malaysia
42%German
7%Italian
6%European
6%Polish
3%English
2%Irish
1%Scandinavian
Year of entry for the foreign-born population
02010 or later
22000 to 2009
01990 to 1999
14Before 1990
Facilities with environmental interests located in this zip code:
ROHM AND HAAS-RINGWOOD (5005 BARNARD MILL RD. in RINGWOOD, IL)
STATE MASTER (Illinois EPA Project) - SOLID WASTE PROGRAM, HAZARDOUS WASTE PROGRAM, AIR PROGRAM STATE MASTER (Illinois EPA Project) - National Pollutant Discharge Elimination System Permit AIR MAJOR (AIRS/AFS) SUPERFUND (Superfund database) (Integrated Compliance Information System) - ICIS-05-1988-0161, FORMAL ENFORCEMENT ACTION COMPLIANCE ACTIVITY (Tracking inspections of insecticide, fungicide, and rodenticide, and toxic substances) CRITERIA AND HAZARDOUS AIR POLLUTANT INVENTORY (Inventory of air pollution sources) National Pollutant Discharge Elimination System MAJOR (Tracking pollutant discharge elimination systems) - permit National Pollutant Discharge Elimination System NON-MAJOR (Tracking pollutant discharge elimination systems) - permit HAZARDOUS WASTE BIENNIAL REPORTER (Resource Conservation and Recovery Act (tracking hazardous waste)) Large Quantity Generators, more that 1000 kg of hazardous waste/month (Resource Conservation and Recovery Act (tracking hazardous waste)) - notification TSD (Resource Conservation and Recovery Act (tracking hazardous waste)) TRI REPORTER (Tracking of toxic chemicals releasing facilities) Business SIC classification: PLASTICS MATERIALS, SYNTHETIC RESINS, AND NONVULCANIZABLE ELASTOMERS; PESTICIDES AND AGRICULTURAL CHEMICALS; ADHESIVES AND SEALANTS Business NAICS classification: PLASTICS MATERIAL AND RESIN MANUFACTURING.; ADHESIVE MANUFACTURING. Organizations: ROHM & HAAS (CONTACT/OPERATOR)
, MORTON INTERNATIONAL (CONTACT/OWNER)
, MORTON INTERNATIONAL, INC. (CONTACT/OWNER)
Alternative names: MORTON CHEM CO, MORTON INTERNAL INC, MORTON INTERNATIONAL, MORTON INTERNATIONAL-RINGWOOD, ROHM & HAAS CHEMICAL LLC
HUNTSMAN (5015 BARNARD MILL ROAD in RINGWOOD, IL)
STATE MASTER (Illinois EPA Project) - SOLID WASTE PROGRAM, AIR PROGRAM, HAZARDOUS WASTE PROGRAM AIR MINOR (AIRS/AFS) COMPLIANCE ACTIVITY (Tracking inspections of insecticide, fungicide, and rodenticide, and toxic substances) CRITERIA AND HAZARDOUS AIR POLLUTANT INVENTORY (Inventory of air pollution sources) Small Quantity Generators, between 100 kg and 1000 kg of hazardous waste/month (Resource Conservation and Recovery Act (tracking hazardous waste)) - notification TRI REPORTER (Tracking of toxic chemicals releasing facilities) Business SIC classification: PLASTICS MATERIALS, SYNTHETIC RESINS, AND NONVULCANIZABLE ELASTOMERS; PLASTICS PRODUCTS; NONCLASSIFIABLE ESTABLISHMENTS Organizations: HUNTSMAN INTERNATIONAL LLC (CONTACT/OWNER)
Alternative names: HUNTSMAN CHEMICAL COMPANY LLC, HUNTSMAN ICI CHEMICALS,LLC- RINGWOOD FAC, HUNTSMAN INTERNATIONAL LLC, HUNTSMAN POLYURETHANES
DENTAL CRAFT CORP (5414 W CRAFTWELL DR in RINGWOOD, IL)
STATE MASTER (Illinois EPA Project) - HAZARDOUS WASTE PROGRAM Large Quantity Generators, more that 1000 kg of hazardous waste/month (Resource Conservation and Recovery Act (tracking hazardous waste)) - notification Organizations: WAKITSCH ROBERT (CONTACT/OWNER)
RINGWOOD SCHOOL PRIMARY CTR (4700 N SCHOOL RD in RINGWOOD, IL)
(National Center for Education Statistics) - STATE ID-4406301202002 Organizations: JOHNSBURG C U SCHOOL DIST 12 (SCHOOL DISTRICT)
Housing units lacking complete kitchen facilities: 2.1%
88.6%Utility gas
10.6%Fuel oil, kerosene, etc.
1.1%Electricity
Population in 1990: 1,926.
Place of birth for U.S.-born residents:
This state: 725
Northeast: 57
Midwest: 108
South: 16
West: 19
74% of the 60072 zip code residents lived in the same house 5 years ago. Out of people who lived in different houses, 84% lived in this county. Out of people who lived in different counties, 50% lived in Illinois.
97% of the 60072 zip code residents lived in the same house 1 year ago. Out of people who lived in different houses, 77% moved from different county within same state. Out of people who lived in different houses, 32% moved from different state.
Private vs. public school enrollment:
Students in private schools in grades 1 to 8 (elementary and middle school): 9
Here:
7.8%
Illinois:
13.3%
Students in private schools in grades 9 to 12 (high school):
Here:
0.0%
Illinois:
9.9%
Students in private undergraduate colleges: 6
Here:
39.8%
Illinois:
27.4%
Occupation by median earnings in the past 12 months ($)
130,116Architecture and engineering occupations
121,470Management occupations
111,989Transportation occupations
89,645Installation, maintenance, and repair occupations
81,513Education, training, and library occupations
73,540Construction and extraction occupations
Top industries in this zip code by the number of employees in 2005:
Construction: Poured Concrete Foundation and Structure Contractors (20-49 employees: 1 establishment, 10-19 employees: 1 establishment, 1-4 employees: 1 establishment)
Construction: Water and Sewer Line and Related Structures Construction (20-49: 1)
Construction: Drywall and Insulation Contractors (20-49: 1)
Construction: Site Preparation Contractors (10-19: 2, 1-4: 1)
Construction: Highway, Street, and Bridge Construction (10-19: 1, 5-9: 1)
Other Services (except Public Administration): Pet Care (except Veterinary) Services (10-19: 1)
Professional, Scientific, and Technical Services: Engineering Services (10-19: 1)
Home Mortgage Disclosure Act Aggregated Statistics For Year 2009 (Based on 2 partial tracts)
A) FHA, FSA/RHS & VA Home Purchase Loans
B) Conventional Home Purchase Loans
C) Refinancings
D) Home Improvement Loans
F) Non-occupant Loans on < 5 Family Dwellings (A B C & D)
Number
Average Value
Number
Average Value
Number
Average Value
Number
Average Value
Number
Average Value
LOANS ORIGINATED
7
$210,381
10
$220,689
130
$215,283
4
$149,290
4
$217,065
APPLICATIONS APPROVED, NOT ACCEPTED
0
$0
0
$0
9
$238,300
0
$0
0
$0
APPLICATIONS DENIED
1
$102,650
2
$100,535
21
$210,525
1
$60,380
0
$0
APPLICATIONS WITHDRAWN
2
$195,630
2
$303,710
21
$237,840
1
$16,910
1
$37,440
FILES CLOSED FOR INCOMPLETENESS
1
$163,030
0
$0
4
$257,973
0
$0
0
$0
Aggregated Statistics For Year 2008 (Based on 2 partial tracts)
A) FHA, FSA/RHS & VA Home Purchase Loans
B) Conventional Home Purchase Loans
C) Refinancings
D) Home Improvement Loans
F) Non-occupant Loans on < 5 Family Dwellings (A B C & D)
Number
Average Value
Number
Average Value
Number
Average Value
Number
Average Value
Number
Average Value
LOANS ORIGINATED
6
$187,380
22
$241,245
92
$216,705
8
$65,286
6
$193,015
APPLICATIONS APPROVED, NOT ACCEPTED
0
$0
2
$198,950
13
$209,194
2
$76,985
1
$60,380
APPLICATIONS DENIED
2
$193,520
3
$230,250
27
$269,071
2
$48,305
0
$0
APPLICATIONS WITHDRAWN
0
$0
3
$198,650
14
$228,409
0
$0
0
$0
FILES CLOSED FOR INCOMPLETENESS
1
$207,710
1
$246,350
2
$273,220
1
$30,190
0
$0
Aggregated Statistics For Year 2007 (Based on 2 partial tracts)
A) FHA, FSA/RHS & VA Home Purchase Loans
B) Conventional Home Purchase Loans
C) Refinancings
D) Home Improvement Loans
F) Non-occupant Loans on < 5 Family Dwellings (A B C & D)
Number
Average Value
Number
Average Value
Number
Average Value
Number
Average Value
Number
Average Value
LOANS ORIGINATED
2
$185,970
53
$218,952
88
$202,760
13
$77,147
8
$152,836
APPLICATIONS APPROVED, NOT ACCEPTED
0
$0
13
$199,301
12
$168,359
2
$18,415
1
$120,760
APPLICATIONS DENIED
0
$0
8
$217,141
46
$232,752
10
$86,706
2
$85,135
APPLICATIONS WITHDRAWN
0
$0
9
$223,272
23
$193,479
2
$49,510
2
$92,080
FILES CLOSED FOR INCOMPLETENESS
0
$0
1
$271,710
8
$214,878
0
$0
0
$0
Aggregated Statistics For Year 2006 (Based on 2 partial tracts)
A) FHA, FSA/RHS & VA Home Purchase Loans
B) Conventional Home Purchase Loans
C) Refinancings
D) Home Improvement Loans
F) Non-occupant Loans on < 5 Family Dwellings (A B C & D)
Number
Average Value
Number
Average Value
Number
Average Value
Number
Average Value
Number
Average Value
LOANS ORIGINATED
1
$120,760
63
$194,347
104
$205,826
14
$64,606
10
$205,473
APPLICATIONS APPROVED, NOT ACCEPTED
0
$0
3
$161,213
17
$193,962
2
$38,040
1
$312,770
APPLICATIONS DENIED
0
$0
16
$166,573
50
$195,209
4
$116,685
2
$275,635
APPLICATIONS WITHDRAWN
1
$109,890
7
$203,999
29
$216,077
1
$177,520
0
$0
FILES CLOSED FOR INCOMPLETENESS
0
$0
2
$151,250
6
$234,275
1
$12,080
0
$0
Aggregated Statistics For Year 2005 (Based on 2 partial tracts)
A) FHA, FSA/RHS & VA Home Purchase Loans
B) Conventional Home Purchase Loans
C) Refinancings
D) Home Improvement Loans
E) Loans on Dwellings For 5+ Families
F) Non-occupant Loans on < 5 Family Dwellings (A B C & D)
G) Loans On Manufactured Home Dwelling (A B C & D)
Number
Average Value
Number
Average Value
Number
Average Value
Number
Average Value
Number
Average Value
Number
Average Value
Number
Average Value
LOANS ORIGINATED
2
$153,065
77
$183,673
119
$190,395
11
$97,102
1
$214,350
14
$178,552
0
$0
APPLICATIONS APPROVED, NOT ACCEPTED
0
$0
4
$157,742
18
$155,478
3
$33,210
0
$0
0
$0
0
$0
APPLICATIONS DENIED
1
$96,610
8
$202,122
51
$205,813
8
$55,776
0
$0
3
$172,283
1
$56,150
APPLICATIONS WITHDRAWN
0
$0
8
$136,459
34
$200,018
3
$174,097
0
$0
2
$48,910
0
$0
FILES CLOSED FOR INCOMPLETENESS
0
$0
2
$253,295
14
$209,131
1
$21,130
0
$0
1
$105,670
0
$0
Aggregated Statistics For Year 2004 (Based on 2 partial tracts)
A) FHA, FSA/RHS & VA Home Purchase Loans
B) Conventional Home Purchase Loans
C) Refinancings
D) Home Improvement Loans
F) Non-occupant Loans on < 5 Family Dwellings (A B C & D)
Number
Average Value
Number
Average Value
Number
Average Value
Number
Average Value
Number
Average Value
LOANS ORIGINATED
8
$178,800
83
$198,905
159
$174,870
11
$66,583
10
$140,806
APPLICATIONS APPROVED, NOT ACCEPTED
1
$108,680
10
$176,974
14
$189,464
1
$37,440
1
$91,780
APPLICATIONS DENIED
2
$204,990
8
$163,026
49
$184,184
5
$56,998
1
$178,720
APPLICATIONS WITHDRAWN
1
$107,480
10
$170,573
38
$179,487
2
$145,820
0
$0
FILES CLOSED FOR INCOMPLETENESS
0
$0
2
$225,820
18
$192,109
1
$39,250
0
$0
Aggregated Statistics For Year 2003 (Based on 2 partial tracts)
A) FHA, FSA/RHS & VA Home Purchase Loans
B) Conventional Home Purchase Loans
C) Refinancings
D) Home Improvement Loans
F) Non-occupant Loans on < 5 Family Dwellings (A B C & D)
Number
Average Value
Number
Average Value
Number
Average Value
Number
Average Value
Number
Average Value
LOANS ORIGINATED
7
$186,143
63
$187,638
327
$162,243
6
$32,707
13
$141,057
APPLICATIONS APPROVED, NOT ACCEPTED
2
$185,065
8
$259,559
29
$164,525
2
$47,700
1
$118,340
APPLICATIONS DENIED
1
$149,140
4
$211,028
55
$155,319
4
$45,588
1
$95,400
APPLICATIONS WITHDRAWN
0
$0
5
$198,650
77
$167,158
1
$39,250
2
$112,910
FILES CLOSED FOR INCOMPLETENESS
0
$0
3
$239,910
8
$198,046
1
$9,660
0
$0
Aggregated Statistics For Year 1999 (Based on 1 partial tract)
A) FHA, FSA/RHS & VA Home Purchase Loans
B) Conventional Home Purchase Loans
C) Refinancings
D) Home Improvement Loans
F) Non-occupant Loans on < 5 Family Dwellings (A B C & D)


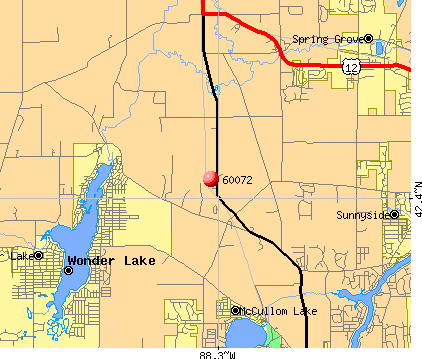 Nearest zip codes: 60071, 60097, 60050, 60081, 60051, 53181.


