Estimated zip code population in 2022: 46,031 Zip code population in 2010: 43,462 Zip code population in 2000: 39,772
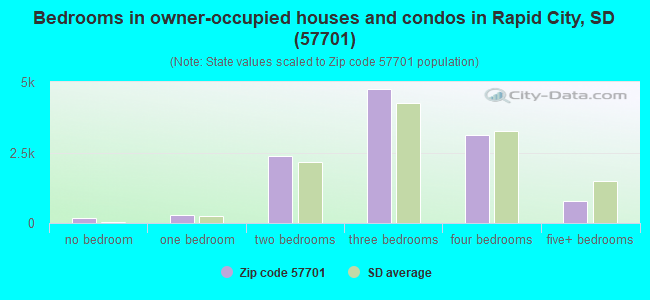
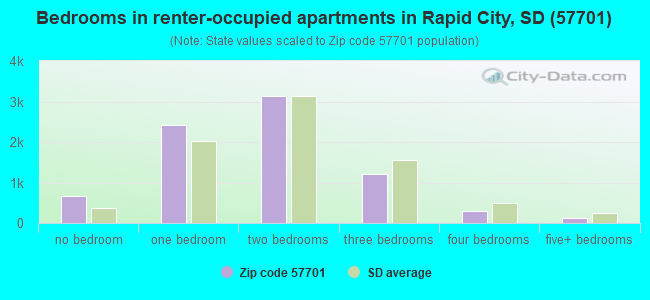
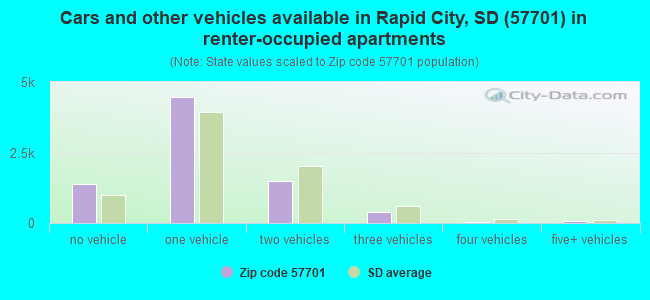
Houses and condos: 20,758 Renter-occupied apartments: 7,806
% of renters here:
40%
State:
30%
March 2022 cost of living index in zip code 57701: 79.3 (low, U.S. average is 100)
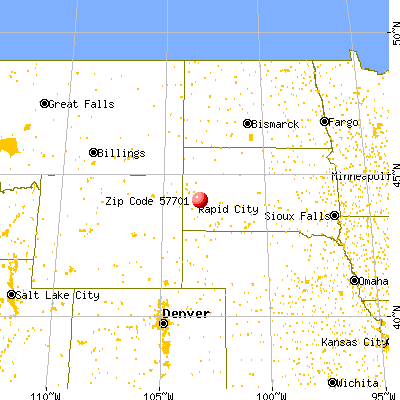
Land area: 70.8 sq. mi. Water area: 0.1 sq. mi.
Population density: 650 people per square mile
(low).
OSM Map
General Map
Google Map
MSN Map
OSM Map
General Map
Google Map
MSN Map
OSM Map
General Map
Google Map
MSN Map
OSM Map
General Map
Google Map
MSN Map
Please wait while loading the map...
Real estate property taxes paid for housing units in 2022:
This zip code:
1.1% ($2,457)
South Dakota:
1.0% ($2,481)
Median real estate property taxes paid for housing units with mortgages in 2022: $2,636 (1.0%) Median real estate property taxes paid for housing units with no mortgage in 2022: $2,163 (1.1%)
Averages for the 2020 tax year for zip code 57701, filed in 2021:
Average Adjusted Gross Income (AGI) in 2020: $52,933 (Individual Income Tax Returns)
Here:
$52,933
State:
$75,230
Salary/wage: $42,694 (reported on 84.8% of returns)
Here:
$42,694
State:
$54,824
(% of AGI for various income ranges: 1210.2% for AGIs below $25k, 3601.3% for AGIs $25k-50k, 6350.1% for AGIs $50k-75k, 9156.5% for AGIs $75k-100k, 16917.8% for AGIs $100k-200k, 66546.7% for AGIs over 200k)
Taxable interest for individuals: $1,716 (reported on 25.4% of returns)
This zip code:
$1,716
South Dakota:
$2,207
(% of AGI for various income ranges: 12.9% for AGIs below $25k, 19.2% for AGIs $25k-50k, 50.2% for AGIs $50k-75k, 101.3% for AGIs $75k-100k, 233.6% for AGIs $100k-200k, 1950.0% for AGIs over 200k)
Ordinary dividends: $5,578 (reported on 15.5% of returns)
Here:
$5,578
State:
$6,303
(% of AGI for various income ranges: 18.5% for AGIs below $25k, 30.8% for AGIs $25k-50k, 82.1% for AGIs $50k-75k, 161.4% for AGIs $75k-100k, 471.9% for AGIs $100k-200k, 4923.3% for AGIs over 200k)
Net capital gain/loss in AGI: +$18,020 (reported on 14.5% of returns)
Here:
+$18,020
State:
+$27,098
(% of AGI for various income ranges: 8.8% for AGIs below $25k, 16.2% for AGIs $25k-50k, 114.8% for AGIs $50k-75k, 228.5% for AGIs $75k-100k, 941.3% for AGIs $100k-200k, 26764.0% for AGIs over 200k)
Profit/loss from business: +$12,973 (reported on 10.9% of returns)
Here:
+$12,973
State:
+$13,092
(% of AGI for various income ranges: 62.6% for AGIs below $25k, 94.9% for AGIs $25k-50k, 201.0% for AGIs $50k-75k, 393.2% for AGIs $75k-100k, 735.5% for AGIs $100k-200k, 3362.7% for AGIs over 200k)
Taxable individual retirement arrangement distribution: $16,777 (reported on 8.6% of returns)
57701:
$16,777
South Dakota:
$17,605
(% of AGI for various income ranges: 45.2% for AGIs below $25k, 62.1% for AGIs $25k-50k, 175.1% for AGIs $50k-75k, 318.2% for AGIs $75k-100k, 880.8% for AGIs $100k-200k, 5685.3% for AGIs over 200k)
Self-employed (Keogh) retirement plans: $21,600 (reported on 0.3% of returns)
57701:
$21,600
South Dakota:
$23,315
(% of AGI for various income ranges: 24.9% for AGIs $75k-100k, 668.0% for AGIs over 200k)
Total itemized deductions: $37,525 (reported on 3.5% of returns)
Here:
$37,525
State:
$43,941
(% of AGI for various income ranges: 27.9% for AGIs below $25k, 53.8% for AGIs $25k-50k, 172.4% for AGIs $50k-75k, 275.9% for AGIs $75k-100k, 599.1% for AGIs $100k-200k, 6964.0% for AGIs over 200k)
Charity contributions: $15,291 (reported on 2.6% of returns)
Here:
$15,291
State:
$21,682
(% of AGI for various income ranges: 1.6% for AGIs below $25k, 5.6% for AGIs $25k-50k, 24.6% for AGIs $50k-75k, 45.2% for AGIs $75k-100k, 161.7% for AGIs $100k-200k, 3731.3% for AGIs over 200k)
Taxes paid: $5,600 (reported on 3.4% of returns)
57701:
$5,600
State:
$6,525
(% of AGI for various income ranges: 2.7% for AGIs below $25k, 6.2% for AGIs $25k-50k, 26.0% for AGIs $50k-75k, 39.6% for AGIs $75k-100k, 108.9% for AGIs $100k-200k, 1001.3% for AGIs over 200k)
Earned income credit: $2,132 (reported on 19.2% of returns)
Here:
$2,132
State:
$2,165
(% of AGI for various income ranges: 93.5% for AGIs below $25k, 56.6% for AGIs $25k-50k, 0.8% for AGIs $50k-75k)
Percentage of individuals using paid preparers for their 2020 taxes: 94.4%
Here:
94%
State:
95%
(% for various income ranges: 93.7% for AGIs below $25k, 95.6% for AGIs $25k-50k, 93.9% for AGIs $50k-75k, 94.4% for AGIs $75k-100k, 93.8% for AGIs $100k-200k, 94.6% for AGIs over 200k)
Averages for the 2012 tax year for zip code 57701, filed in 2013:
Average Adjusted Gross Income (AGI) in 2012: $41,262 (Individual Income Tax Returns)
Here:
$41,262
State:
$58,425
Salary/wage: $33,198 (reported on 85.1% of returns)
Here:
$33,198
State:
$41,676
(% of AGI for various income ranges: 82.4% for AGIs below $25k, 75.4% for AGIs $25k-50k, 75.7% for AGIs $50k-75k, 74.0% for AGIs $75k-100k, 67.2% for AGIs $100k-200k, 33.1% for AGIs over 200k)
Taxable interest for individuals: $1,766 (reported on 24.6% of returns)
This zip code:
$1,766
South Dakota:
$2,148
(% of AGI for various income ranges: 1.0% for AGIs below $25k, 0.9% for AGIs $25k-50k, 0.7% for AGIs $50k-75k, 0.9% for AGIs $75k-100k, 1.1% for AGIs $100k-200k, 1.8% for AGIs over 200k)
Ordinary dividends: $8,434 (reported on 17.2% of returns)
Here:
$8,434
State:
$6,197
(% of AGI for various income ranges: 4.4% for AGIs below $25k, 5.9% for AGIs $25k-50k, 1.6% for AGIs $50k-75k, 1.4% for AGIs $75k-100k, 2.1% for AGIs $100k-200k, 4.6% for AGIs over 200k)
Net capital gain/loss in AGI: +$13,310 (reported on 11.3% of returns)
Here:
+$13,310
State:
+$21,273
(% of AGI for various income ranges: 0.4% for AGIs below $25k, 0.3% for AGIs $25k-50k, 0.8% for AGIs $50k-75k, 1.0% for AGIs $75k-100k, 3.3% for AGIs $100k-200k, 17.6% for AGIs over 200k)
Profit/loss from business: +$10,984 (reported on 10.3% of returns)
Here:
+$10,984
State:
+$11,552
(% of AGI for various income ranges: 2.9% for AGIs below $25k, 2.3% for AGIs $25k-50k, 2.3% for AGIs $50k-75k, 2.4% for AGIs $75k-100k, 3.3% for AGIs $100k-200k, 3.4% for AGIs over 200k)
Taxable individual retirement arrangement distribution: $12,887 (reported on 8.4% of returns)
57701:
$12,887
South Dakota:
$12,416
(% of AGI for various income ranges: 1.8% for AGIs below $25k, 1.8% for AGIs $25k-50k, 2.4% for AGIs $50k-75k, 2.8% for AGIs $75k-100k, 4.0% for AGIs $100k-200k, 3.2% for AGIs over 200k)
Self-employment retirement plans: $23,214 (reported on 0.3% of returns)
57701:
$23,214
South Dakota:
$19,291
Total itemized deductions: $18,924 (19% of AGI, reported on 15.5% of returns)
Here:
$18,924
State:
$21,763
Here:
19.5% of AGI
State:
16.0% of AGI
(% of AGI for various income ranges: 4.0% for AGIs below $25k, 5.5% for AGIs $25k-50k, 7.5% for AGIs $50k-75k, 8.3% for AGIs $75k-100k, 9.4% for AGIs $100k-200k, 8.5% for AGIs over 200k)
Charity contributions: $5,159 (reported on 11.1% of returns)
Here:
$5,159
State:
$5,927
(% of AGI for various income ranges: 0.4% for AGIs below $25k, 0.6% for AGIs $25k-50k, 1.0% for AGIs $50k-75k, 1.6% for AGIs $75k-100k, 1.9% for AGIs $100k-200k, 3.2% for AGIs over 200k)
Taxes paid: $4,332 (reported on 15.2% of returns)
57701:
$4,332
State:
$5,214
(% of AGI for various income ranges: 0.7% for AGIs below $25k, 1.1% for AGIs $25k-50k, 1.6% for AGIs $50k-75k, 1.9% for AGIs $75k-100k, 2.4% for AGIs $100k-200k, 2.1% for AGIs over 200k)
Earned income credit: $2,086 (reported on 23.4% of returns)
Here:
$2,086
State:
$2,081
(% of AGI for various income ranges: 6.6% for AGIs below $25k, 1.0% for AGIs $25k-50k)
Percentage of individuals using paid preparers for their 2012 taxes: 40.5%
Here:
40%
State:
55%
(% for various income ranges: 36.5% for AGIs below $25k, 38.0% for AGIs $25k-50k, 43.0% for AGIs $50k-75k, 51.5% for AGIs $75k-100k, 59.3% for AGIs $100k-200k, 83.3% for AGIs over 200k)
Averages for the 2004 tax year for zip code 57701, filed in 2005:
Average Adjusted Gross Income (AGI) in 2004: $34,574 (Individual Income Tax Returns)
Here:
$34,574
State:
$41,242
Salary/wage: $28,409 (reported on 87.6% of returns)
Here:
$28,409
State:
$32,969
(% of AGI for various income ranges: 112.9% for AGIs below $10k, 83.4% for AGIs $10k-25k, 82.5% for AGIs $25k-50k, 79.4% for AGIs $50k-75k, 77.6% for AGIs $75k-100k, 40.2% for AGIs over 100k)
Taxable interest for individuals: $1,873 (reported on 36.7% of returns)
This zip code:
$1,873
South Dakota:
$2,098
(% of AGI for various income ranges: 4.5% for AGIs below $10k, 1.8% for AGIs $10k-25k, 1.7% for AGIs $25k-50k, 1.5% for AGIs $50k-75k, 1.7% for AGIs $75k-100k, 2.8% for AGIs over 100k)
Taxable dividends: $2,386 (reported on 19.0% of returns)
Here:
$2,386
State:
$2,577
(% of AGI for various income ranges: 2.6% for AGIs below $10k, 1.1% for AGIs $10k-25k, 0.9% for AGIs $25k-50k, 0.8% for AGIs $50k-75k, 1.4% for AGIs $75k-100k, 2.2% for AGIs over 100k)
Net capital gain/loss: +$12,818 (reported on 15.7% of returns)
Here:
+$12,818
State:
+$11,418
(% of AGI for various income ranges: -0.8% for AGIs below $10k, 0.1% for AGIs $10k-25k, 0.7% for AGIs $25k-50k, 1.3% for AGIs $50k-75k, 1.8% for AGIs $75k-100k, 21.2% for AGIs over 100k)
Profit/loss from business: +$9,461 (reported on 11.9% of returns)
Here:
+$9,461
State:
+$9,138
(% of AGI for various income ranges: 3.6% for AGIs below $10k, 2.7% for AGIs $10k-25k, 2.5% for AGIs $25k-50k, 2.9% for AGIs $50k-75k, 3.8% for AGIs $75k-100k, 4.4% for AGIs over 100k)
IRA payment deduction: $2,624 (reported on 3.2% of returns)
57701:
$2,624
South Dakota:
$3,029
(% of AGI for various income ranges: 0.2% for AGIs below $10k, 0.2% for AGIs $10k-25k, 0.3% for AGIs $25k-50k, 0.3% for AGIs $50k-75k, 0.2% for AGIs $75k-100k, 0.1% for AGIs over 100k)
Self-employed pension: $16,265 (reported on 0.6% of returns)
Here:
$16,265
South Dakota:
$13,863
(% of AGI for various income ranges: 0.0% for AGIs $25k-50k, 0.0% for AGIs $50k-75k, 0.1% for AGIs $75k-100k, 1.1% for AGIs over 100k)
Total itemized deductions: $15,246 (20% of AGI, reported on 17.0% of returns)
Here:
$15,246
State:
$17,139
Here:
20.4% of AGI
State:
19.0% of AGI
(% of AGI for various income ranges: 8.6% for AGIs below $10k, 4.7% for AGIs $10k-25k, 7.0% for AGIs $25k-50k, 8.1% for AGIs $50k-75k, 10.1% for AGIs $75k-100k, 8.0% for AGIs over 100k)
Charity contributions deductions: $4,014 (5% of AGI, reported on 12.9% of returns)
Here:
$4,014
State:
$4,114
Here:
4.8% of AGI
State:
4.2% of AGI
(% of AGI for various income ranges: 0.6% for AGIs below $10k, 0.5% for AGIs $10k-25k, 0.8% for AGIs $25k-50k, 1.3% for AGIs $50k-75k, 1.9% for AGIs $75k-100k, 2.9% for AGIs over 100k)
Total tax: $4,993 (reported on 70.5% of returns)
57701:
$4,993
State:
$6,372
(% of AGI for various income ranges: 2.0% for AGIs below $10k, 4.1% for AGIs $10k-25k, 6.8% for AGIs $25k-50k, 8.6% for AGIs $50k-75k, 10.9% for AGIs $75k-100k, 19.5% for AGIs over 100k)
Earned income credit: $1,615 (reported on 20.4% of returns)
Here:
$1,615
State:
$1,607
Percentage of individuals using paid preparers for their 2004 taxes: 54.6%
Here:
55%
State:
63%
(% for various income ranges: 48.8% for AGIs below $10k, 55.1% for AGIs $10k-25k, 54.9% for AGIs $25k-50k, 55.9% for AGIs $50k-75k, 59.1% for AGIs $75k-100k, 76.7% for AGIs over 100k)
Likely homosexual households (counted as self-reported same-sex unmarried-partner households)
Lesbian couples: 0.0% of all households
Gay men: 0.1% of all households
Household received Food Stamps/SNAP in the past 12 months: 2,994 Household did not receive Food Stamps/SNAP in the past 12 months: 16,312
Women who had a birth in the past 12 months: 727 (386 now married, 368 unmarried) Women who did not have a birth in the past 12 months: 9,315 (3,485 now married, 5,780 unmarried)
Housing units in zip code 57701 with a mortgage: 6,465 (750 second mortgage, 86 home equity loan, 654 both second mortgage and home equity loan) Houses without a mortgage: 28
Median monthly owner costs for units with a mortgage: $1,413 Median monthly owner costs for units without a mortgage: $535
Residents with income below the poverty level in 2022:
This zip code:
19.5%
Whole state:
12.5%
Residents with income below 50% of the poverty level in 2022:
This zip code:
11.7%
Whole state:
6.8%
Median number of rooms in houses and condos:
Here:
6.4
State:
7.0
Median number of rooms in apartments:
Here:
3.8
State:
4.1
Notable locations in this zip code not listed on our city pages
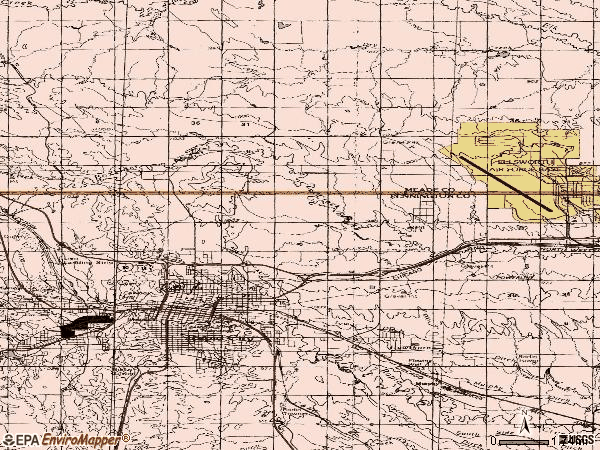
Notable locations in zip code 57701: Lazy J RV Park and Campground (A), LaCroix Links Golf Course (B), The Ranch Amusement Park (C), Dahl Fine Arts Center (D), Rapid City Fairgrounds (E), Executive Golf Course (F), Rushmore Plaza Civic Center (G), Berry Patch Campground (H), Rapid City Department of Fire and Emergency Services Station 4 (I), Rapid City Department of Fire and Emergency Services Station 7 (J), Rapid City Department of Fire and Emergency Services Station 1 (K), Rapid City City Hall (L), Sioux Indian Museum (M), Pioneer Museum (N), South Dakota School of Mines and Technology Geology Museum (O), Thomas Jefferson Library (P), Rapid City Public Library North (Q), Rapid City Public Library (R), Bump-Macdonald Paleontology Library (S), He Sapa College Center Library (T). Display/hide their locations on the map
Shopping Centers: Haines Station Shopping Center (1), Rushmore Mall (2), South Town Mall (3), Robbinsdale Shopping Center (4), North Rapid Shopping Center (5), Northgate Shopping Center (6). Display/hide their locations on the map
4,768 married couples with children.
3,537 single-parent households (947 men, 2,590 women).
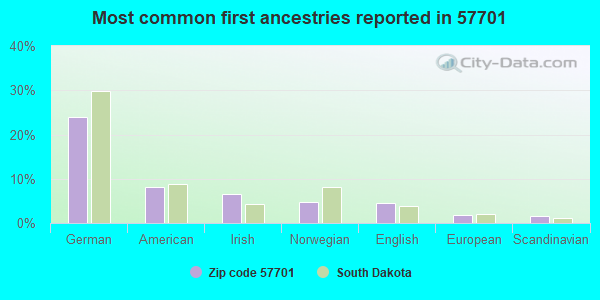
94.9% of residents of 57701 zip code speak English at home.
1.3% of residents speak Spanish at home (71% very well, 23% well, 5% not well).
1.2% of residents speak other Indo-European language at home (92% very well, 5% well, 3% not well).
0.4% of residents speak Asian or Pacific Island language at home (19% very well, 81% well).
1.8% of residents speak other language at home (83% very well, 12% well, 5% not well).
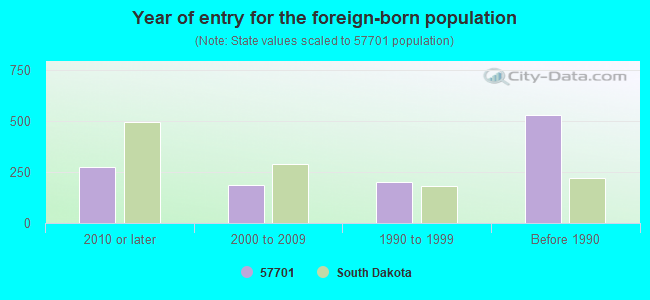
Foreign born population: 702 (1.5%) (57.5% of them are naturalized citizens)
Major facilities with environmental interests located in this zip code:
SCI SYSTEMS INCORPORATED (222 DISK DRIVE in RAPID CITY, SD)
CRITERIA AND HAZARDOUS AIR POLLUTANT INVENTORY (Inventory of air pollution sources) HAZARDOUS WASTE BIENNIAL REPORTER (Resource Conservation and Recovery Act (tracking hazardous waste)) - ICIS-, ENFORCEMENT/COMPLIANCE ACTIVITY Large Quantity Generators, more that 1000 kg of hazardous waste/month (Resource Conservation and Recovery Act (tracking hazardous waste)) - notification - ICIS-, ENFORCEMENT/COMPLIANCE ACTIVITY TRI REPORTER (Tracking of toxic chemicals releasing facilities) Business SIC classification: ELECTRONIC COMPONENTS Organizations: SANMINA-SCI CORPORATION (CONTACT/OPERATOR)
Alternative names: SANMINA-SCI CORP., SANMINA-SCI CORP.
DIXON BROTHERS, INC. (2110 DYESS AVENUE in RAPID CITY, SD)
(Integrated Compliance Information System) - ICIS-08-2006-0038, ENFORCEMENT/COMPLIANCE ACTIVITY FORMAL ENFORCEMENT ACTION (Integrated Compliance Information System) - ICIS-08-2006-0038, ENFORCEMENT/COMPLIANCE ACTIVITY
NASH FINCH COMPANY (1313 EAST ST. PATRICK STREET in RAPID CITY, SD)
(Integrated Compliance Information System) - ICIS-08-1988-0030, FORMAL ENFORCEMENT ACTION, ICIS-08-1987-0052, ICIS-08-1987-0120, (Resource Conservation and Recovery Act (tracking hazardous waste)) Business SIC classification: ELECTROPLATING, PLATING, POLISHING, ANODIZING, AND COLORING Organizations: GENE JOBGEN (CONTACT/OWNER)
NORTH CENTRAL SUPPLY COMPANY,INCORPORATED (904 - 910 EAST SAINT ANDREW STREET in RAPID CITY, SD)
(Integrated Compliance Information System) - ICIS-08-1995-0072, FORMAL ENFORCEMENT ACTION COMPLIANCE ACTIVITY (Tracking inspections of insecticide, fungicide, and rodenticide, and toxic substances) TRI REPORTER (Tracking of toxic chemicals releasing facilities) Business SIC classification: METAL DOORS, SASH, FRAMES, MOLDING, AND TRIM
ULTRAMAX AMMUNITION (2112 ELK VALE ROAD in RAPID CITY, SD)
(Integrated Compliance Information System) - ICIS-08-1997-0145, FORMAL ENFORCEMENT ACTION Small Quantity Generators, between 100 kg and 1000 kg of hazardous waste/month (Resource Conservation and Recovery Act (tracking hazardous waste)) - notification TRI REPORTER (Tracking of toxic chemicals releasing facilities) Business SIC classification: SMALL ARMS AMMUNITION; AMMUNITION, EXCEPT FOR SMALL ARMS Organizations: ROGER BRAUNSTEIN (CONTACT/OWNER)
CENTRAL HI SCH (433 N 8TH in RAPID CITY, SD)
(National Center for Education Statistics) - STATE ID-41 Organizations: RAPID CITY AREA SCHOOL DISTRICT 51-4 (SCHOOL DISTRICT)
ALTERNATIVE PROGRAM (21 ST JOSEPH in RAPID CITY, SD)
(National Center for Education Statistics) - STATE ID-64 Organizations: RAPID CITY AREA SCHOOL DISTRICT 51-4 (SCHOOL DISTRICT)
KNOLLWOOD HEIGHTS ELEM (1701 DOWNING ST in RAPID CITY, SD)
(National Center for Education Statistics) - STATE ID-8 Organizations: RAPID CITY AREA SCHOOL DISTRICT 51-4 (SCHOOL DISTRICT)
COLLISION CENTER (415 EAST OMAHA STREET in RAPID CITY, SD)
Conditionally Exempt Small Quantity Generators, less than 100 kg/month of hazardous waste (Resource Conservation and Recovery Act (tracking hazardous waste)) - notification - ICIS-, ENFORCEMENT/COMPLIANCE ACTIVITY Organizations: MARK MOLLERS (CONTACT/OWNER)
E. B. BERGQUIST ELEM (725 E. PHILADELPHIA ST in RAPID CITY, SD)
(National Center for Education Statistics) - STATE ID-2 Organizations: RAPID CITY AREA SCHOOL DISTRICT 51-4 (SCHOOL DISTRICT)
MCKIE FORD, INC. DBA RAPID LUBE (509 E. OMAHA STREET in RAPID CITY, SD)
Conditionally Exempt Small Quantity Generators, less than 100 kg/month of hazardous waste (Resource Conservation and Recovery Act (tracking hazardous waste)) - notification - ICIS-, ENFORCEMENT/COMPLIANCE ACTIVITY
ROBBINSDALE ELEM (424 E. INDIANA ST in RAPID CITY, SD)
(National Center for Education Statistics) - STATE ID-14 Organizations: RAPID CITY AREA SCHOOL DISTRICT 51-4 (SCHOOL DISTRICT)
Housing units lacking complete plumbing facilities: 2.0% Housing units lacking complete kitchen facilities: 1.9%
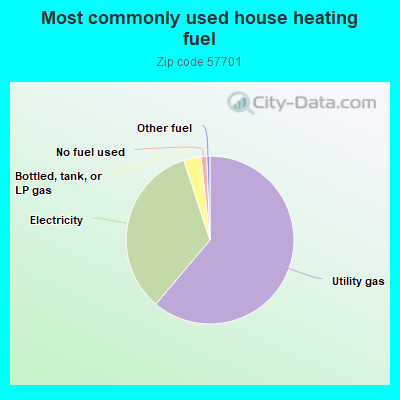
60.8%Utility gas
33.6%Electricity
3.3%Bottled, tank, or LP gas
1.1%No fuel used
0.6%Other fuel
Population in 1990: 45,328.
Place of birth for U.S.-born residents:
This state: 25,624
Northeast: 962
Midwest: 8,588
South: 2,949
West: 7,264
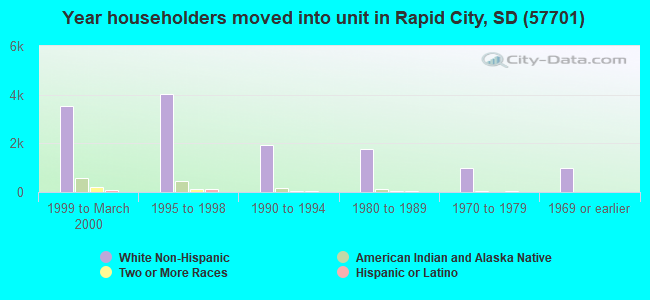
43% of the 57701 zip code residents lived in the same house 5 years ago. Out of people who lived in different houses, 51% lived in this county. Out of people who lived in different counties, 50% lived in South Dakota.
85% of the 57701 zip code residents lived in the same house 1 year ago. Out of people who lived in different houses, 41% moved from this county. Out of people who lived in different houses, 24% moved from different county within same state. Out of people who lived in different houses, 29% moved from different state. Out of people who lived in different houses, 4% moved from abroad.
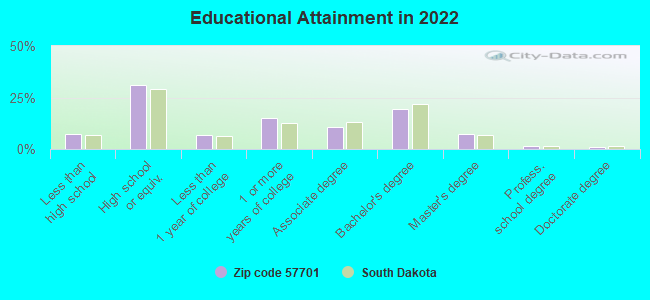
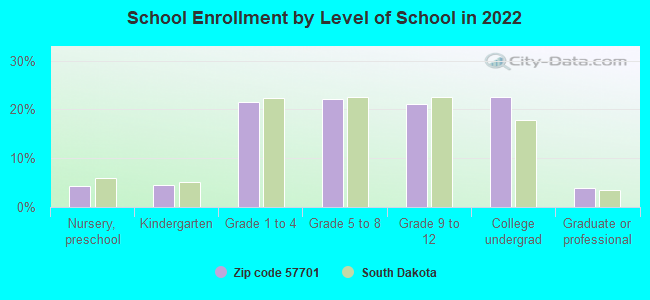
Private vs. public school enrollment:
Students in private schools in grades 1 to 8 (elementary and middle school): 543
Here:
12.3%
South Dakota:
11.9%
Students in private schools in grades 9 to 12 (high school): 394
Here:
19.2%
South Dakota:
7.2%
Students in private undergraduate colleges: 109
Here:
4.6%
South Dakota:
10.2%
Occupation by median earnings in the past 12 months ($)
69,031Health diagnosing and treating practitioners and other technical occupations
68,969Architecture and engineering occupations
60,728Life, physical, and social science occupations
60,311Management occupations
60,039Computer and mathematical occupations
51,715Law enforcement workers including supervisors
Companies with biggest federal contracts located in this zip code (RAPID CITY, SD):
HEAVY CONSTRUCTORS INC (4101 N DEADWOOD AVE) : $21,193,375 in 64 contractsfrom 2000 to 2006
Contracts for Construction of Structures and Facilities -- Other Airfield Structures, Construction of Structures and Facilities -- Other Utilities, Maintenance, Repair or Alteration of Real Property -- Hospitals and Infirmaries, Maintenance, Repair or Alteration of Real Property -- Highways, Roads, Streets, Bridges, and Railways (includes resurfacing), and moreby Army, Department of Veterans Affairs, Air Force, National Park Service, and others Signed by year:2000: $1,720,000; 2001: $0; 2002: $9,810,295; 2003: -$173,357; 2004: $9,514,807; 2005: $250,308; 2006: $71,322.
Biggest contracts:
$9,810,295 with Army for Construction of Structures and Facilities -- Other Airfield Structures. Signed on 2002-09-24. Completion date: 2004-11-12.
$8,394,979 with Army for Construction of Structures and Facilities -- Other Utilities. Signed on 2004-08-30. Completion date: 2006-03-03.
$1,719,000 with Department of Veterans Affairs for Maintenance, Repair or Alteration of Real Property -- Hospitals and Infirmaries. Signed on 2000-09-15. Completion date: 2001-11-15.
$1,061,135 with Air Force for Maintenance, Repair or Alteration of Real Property -- Highways, Roads, Streets, Bridges, and Railways (includes resurfacing). Signed on 2004-07-23. Completion date: 2005-11-15.
RAPID CITY REGIONAL HOSPITAL I (353 FAIRMONT BLVD) : $15,167,549 in 21 contractsfrom 1999 to 2006
Contracts for Other Medical Services, Medical and Surgical Instruments, Equipment, and Supplies, Maintenance, Repair and Rebuilding of Equipment -- Medical, Dental, and Veterinary Equipment and Supplies, Maintenance, Repair and Rebuilding of Equipment -- Instruments and Laboratory Equipment, and moreby Public Health Service, Indian Health Service, Department of Veterans Affairs, Air Force, and others Signed by year:2000: $4,925,000; 2001: $3,635,000; 2002: $4,260,000; 2003: $2,203,248; 2004: $69,990; 2005: $37,781; 2006: $1,015.
Biggest contracts:
$4,925,000 with Public Health Service for Other Medical Services. Signed on 2000-08-15. Completion date: 2001-08-15.
$4,201,000, same as above.Signed on 2002-10-15. Completion date: 2003-10-15.
$3,635,000, same as above.Signed on 2001-07-15. Completion date: 2002-08-15.
$2,203,248 with Indian Health Service for Other Medical Services. Signed on 2003-10-03. Effective on 2003-10-22. Completion date: 2004-04-22.
J & J ASPHALT COMPANY (2234 DYESS AVE; small business) : $1,764,963 in 7 contractsfrom 2004 to 2006
Contracts for Maintenance, Repair or Alteration of Real Property -- Other Non-Building Facilities by Air Force Signed by year:2000: $0; 2001: $0; 2002: $0; 2003: $0; 2004: $665,260; 2005: $1,089,788; 2006: $9,915.
Biggest contracts:
$831,992 with Air Force for Maintenance, Repair or Alteration of Real Property -- Other Non-Building Facilities. Signed on 2005-09-30. Completion date: 2006-09-29.
$530,960, same as above.Signed on 2004-09-22. Completion date: 2005-07-31.
$407,580, same as above.Signed on 2005-09-28. Completion date: 2006-07-31.
$134,300, same as above.Signed on 2004-09-20. Completion date: 2005-07-31.
BERENDSE & SONS PAINT CO , INC (300 MALL DRIVE; small business) : $838,214 in 34 contractsfrom 2000 to 2006
Contracts for Maintenance, Repair or Alteration of Real Property -- Other Administrative Facilities and Service Buildings, Maintenance, Repair or Alteration of Real Property -- Miscellaneous Buildings, Construction of Structures and Facilities -- Other Non-Building Facilities, Maintenance, Repair or Alteration of Real Property -- Other Non-Building Facilities, and moreby Air Force, ENERGY, Department of, Public Buildings Service, Forest Service, and others Signed by year:2000: $235,512; 2001: $110,712; 2002: $196,642; 2003: $114,767; 2004: $80,551; 2005: $89,350; 2006: $10,680.
Biggest contracts:
$126,495 with Air Force for Maintenance, Repair or Alteration of Real Property -- Other Administrative Facilities and Service Buildings. Signed on 2000-09-15. Completion date: 2000-09-05.
$120,972 with Air Force for Maintenance, Repair or Alteration of Real Property -- Miscellaneous Buildings. Taking place in UT. Signed on 2002-09-30. Completion date: 2002-10-30.
$86,950 with ENERGY, Department of for Construction of Structures and Facilities -- Other Non-Building Facilities. Signed on 2005-09-22. Completion date: 2005-12-29.
$84,517 with Air Force for Maintenance, Repair or Alteration of Real Property -- Other Non-Building Facilities. Taking place in UT. Signed on 2000-07-03. Completion date: 2000-10-04.
RAPID CITY LAUNDRY & DRY CLEAN (312 MAIN STREET; small business) : $772,000 in 33 contractsfrom 2001 to 2006
Contracts for Laundry and DryCleaning Services by Air Force Signed by year:2000: $0; 2001: $80,000; 2002: $98,000; 2003: $150,508; 2004: $175,011; 2005: $188,420; 2006: $80,061.
Biggest contracts:
$105,000 with Air Force for Laundry and DryCleaning Services. Signed on 2005-10-01. Completion date: 2006-03-31.
$95,000, same as above.Signed on 2003-10-01. Completion date: 2004-09-30.
$95,000, same as above.Signed on 2004-10-01. Completion date: 2005-09-30.
$85,000, same as above.Signed on 2002-10-01. Completion date: 2003-09-30.
EDDIE'S TRUCK SALES INC (1002 E OMAHA ST; small business) : $336,878 in 13 contractsfrom 2003 to 2006
Contracts for Trucks and Truck Tractors, Wheeled, Miscellaneous Materials Handling Equipment, Miscellaneous Vehicular Components, Miscellaneous Items by U.S. Army Corps of Engineers - civil program financing only, Army Signed by year:2000: $0; 2001: $0; 2002: $0; 2003: $11,724; 2004: $0; 2005: $325,354; 2006: -$200.
Biggest contracts:
$105,123 with U.S. Army Corps of Engineers - civil program financing only for Trucks and Truck Tractors, Wheeled. Signed on 2005-08-23. Completion date: 2005-09-30.
$105,123 with Army for Trucks and Truck Tractors, Wheeled. Signed on 2005-08-23. Completion date: 2005-09-30.
$37,730 with Army for Miscellaneous Materials Handling Equipment. Signed on 2005-07-27. Completion date: 2005-07-30.
$37,730 with U.S. Army Corps of Engineers - civil program financing only for Miscellaneous Materials Handling Equipment. Signed on 2005-07-27. Completion date: 2005-07-30.
SHAMROCK ENTERPRISES, INC (2220 EGLIN STREET; small business) : $252,266 in 7 contractsfrom 2000 to 2001
Contracts for Maintenance, Repair or Alteration of Real Property -- Recreation Facilities (Non-Building), Maintenance, Repair or Alteration of Real Property -- Other Non-Building Facilities, Maintenance, Repair or Alteration of Real Property -- Highways, Roads, Streets, Bridges, and Railways (includes resurfacing), Maintenance, Repair or Alteration of Real Property -- Other Utilities by Air Force Signed by year:2000: $72,995; 2001: $179,271; 2002: $0; 2003: $0; 2004: $0; 2005: $0; 2006: $0.
Biggest contracts:
$150,024 with Air Force for Maintenance, Repair or Alteration of Real Property -- Recreation Facilities (Non-Building). Signed on 2001-09-04. Completion date: 2001-11-30.
$68,381 with Air Force for Maintenance, Repair or Alteration of Real Property -- Other Non-Building Facilities. Signed on 2000-09-28. Completion date: 2000-09-28.
$16,843 with Air Force for Maintenance, Repair or Alteration of Real Property -- Highways, Roads, Streets, Bridges, and Railways (includes resurfacing). Signed on 2001-08-09. Completion date: 2001-09-10.
$10,082 with Air Force for Maintenance, Repair or Alteration of Real Property -- Other Non-Building Facilities. Signed on 2001-09-05. Completion date: 2001-11-05.
CHRIS SUPPLY COMPANY INC (114 EAST BLVD N; small business) : $177,015 in 36 contractsfrom 2001 to 2006
Contracts for Radio and Television Communication Equipment, Except Airborne, ADPE System Configuration, ADP Support Equipment, ADP Components, and moreby Army, Indian Health Service, Department of Veterans Affairs Signed by year:2000: $0; 2001: $40,225; 2002: $73,290; 2003: $47,835; 2004: $0; 2005: $12,928; 2006: $2,737.
Biggest contracts:
$43,807 with Army for Radio and Television Communication Equipment, Except Airborne. Signed on 2002-09-03. Completion date: 2002-09-27.
$40,225 with Army for ADPE System Configuration. Signed on 2001-09-21. Completion date: 2001-10-30.
$36,368 with Army for ADP Support Equipment. Taking place in HI. Signed on 2003-09-23. Completion date: 2003-09-30.
$14,684 with Army for ADP Components. Signed on 2002-01-25. Completion date: 2002-02-15.
AUDIO-VIDEO SOLUTIONS (1212 OREGON; small business) : $159,615 in 6 contractsfrom 2001 to 2006
Contracts for Video Recording and Reproducing Equipment, Miscellaneous Furniture and Fixtures, Radio and Television Communication Equipment, Except Airborne, Audio/Visual Services, and moreby Air Force, Public Buildings Service, Indian Affairs (Assistant Secretary) Signed by year:2000: $0; 2001: $77,800; 2002: $0; 2003: $0; 2004: $13,694; 2005: $4,450; 2006: $63,671.
Biggest contracts:
$48,073 with Air Force for Video Recording and Reproducing Equipment. Signed on 2006-05-02. Completion date: 2006-06-15.
$47,935 with Air Force for Miscellaneous Furniture and Fixtures. Signed on 2001-06-01. Completion date: 2001-06-30.
$29,865 with Air Force for Radio and Television Communication Equipment, Except Airborne. Signed on 2001-09-24. Completion date: 2001-10-24.
$15,598 with Public Buildings Service for Audio/Visual Services. Signed on 2006-01-18. Completion date: 2006-03-31.
T S P THREE INC (600 KANSAS CITY ST) : $156,618 in 6 contractsfrom 2000 to 2003
Contracts for Other Architect and Engineering Services, Architect - Engineer Services (including landscaping, interior layout, and designing), Other Buildings by Air Force Signed by year:2000: $48,459; 2001: $66,900; 2002: -$37,753; 2003: $79,012; 2004: $0; 2005: $0; 2006: $0.
Biggest contracts:
$74,905 with Air Force for Other Architect and Engineering Services. Signed on 2003-08-26. Completion date: 2004-01-16.
$66,900 with Air Force for Architect - Engineer Services (including landscaping, interior layout, and designing). Signed on 2001-09-25. Completion date: 2002-03-31.
$48,459 with Air Force for Other Buildings. Signed on 2000-01-24. Completion date: 2000-03-24.
$4,107 with Air Force for Other Architect and Engineering Services. Signed on 2003-09-16. Completion date: 2003-12-19.
Top industries in this zip code by the number of employees in 2005:
Health Care and Social Assistance: General Medical and Surgical Hospitals (over 1000 employees: 1 establishment, 100-249 employees: 1 establishment)
Health Care and Social Assistance: Offices of Physicians (except Mental Health Specialists) (250-499: 1, 50-99: 4, 20-49: 6, 10-19: 11, 5-9: 10, 1-4: 16)
Educational Services: Colleges, Universities, and Professional Schools (250-499: 1)
People in group quarters in 2010:
659 people in college/university student housing
474 people in correctional residential facilities
203 people in emergency and transitional shelters (with sleeping facilities) for people experiencing homelessness
189 people in nursing facilities/skilled-nursing facilities
101 people in group homes intended for adults
98 people in correctional facilities intended for juveniles
64 people in other noninstitutional facilities
41 people in residential treatment centers for adults
36 people in workers' group living quarters and job corps centers
8 people in hospitals with patients who have no usual home elsewhere
People in group quarters in 2000:
757 people in college dormitories (includes college quarters off campus)
315 people in local jails and other confinement facilities (including police lockups)
244 people in other noninstitutional group quarters
213 people in nursing homes
153 people in homes for the mentally retarded
79 people in other group homes
65 people in homes or halfway houses for drug/alcohol abuse
15 people in mental (psychiatric) hospitals or wards
9 people in homes for the mentally ill
4 people in other nonhousehold living situations
3 people in religious group quarters
Fatal accident statistics in 2014:
Fatal accident count: 1
Vehicles involved in fatal accidents: 1
Fatal accidents caused by drunken drivers: 1
Fatalities: 1
Persons involved in fatal accidents: 2
Pedestrians involved in fatal accidents: 0
Fatal accident statistics in 2013:
Fatal accident count: 4
Vehicles involved in fatal accidents: 9
Fatal accidents caused by drunken drivers: 1
Fatalities: 5
Persons involved in fatal accidents: 16
Pedestrians involved in fatal accidents: 1
Home Mortgage Disclosure Act Aggregated Statistics For Year 2009 (Based on 12 full and 4 partial tracts)
A) FHA, FSA/RHS & VA Home Purchase Loans
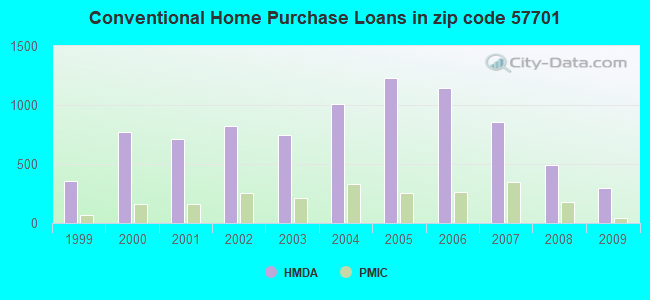
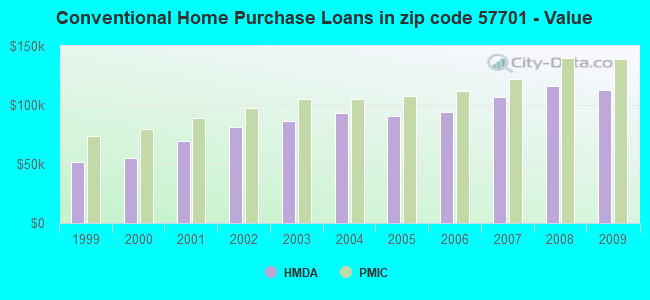
B) Conventional Home Purchase Loans
C) Refinancings
D) Home Improvement Loans
E) Loans on Dwellings For 5+ Families
F) Non-occupant Loans on < 5 Family Dwellings (A B C & D)
G) Loans On Manufactured Home Dwelling (A B C & D)
Number
Average Value
Number
Average Value
Number
Average Value
Number
Average Value
Number
Average Value
Number
Average Value
Number
Average Value
LOANS ORIGINATED
279
$133,357
294
$112,611
994
$131,398
142
$37,687
15
$867,042
122
$151,696
74
$74,399
APPLICATIONS APPROVED, NOT ACCEPTED
11
$147,029
20
$119,268
96
$156,849
8
$27,464
0
$0
10
$102,931
2
$39,870
APPLICATIONS DENIED
58
$120,881
47
$76,261
286
$123,321
76
$26,207
8
$186,632
20
$104,674
47
$27,362
APPLICATIONS WITHDRAWN
21
$111,015
19
$107,822
170
$135,414
32
$73,816
0
$0
15
$127,370
13
$47,652
FILES CLOSED FOR INCOMPLETENESS
0
$0
0
$0
30
$139,038
1
$80,000
0
$0
6
$135,140
0
$0
Aggregated Statistics For Year 2008 (Based on 12 full and 4 partial tracts)
A) FHA, FSA/RHS & VA Home Purchase Loans
B) Conventional Home Purchase Loans
C) Refinancings
D) Home Improvement Loans
E) Loans on Dwellings For 5+ Families
F) Non-occupant Loans on < 5 Family Dwellings (A B C & D)
G) Loans On Manufactured Home Dwelling (A B C & D)
Number
Average Value
Number
Average Value
Number
Average Value
Number
Average Value
Number
Average Value
Number
Average Value
Number
Average Value
LOANS ORIGINATED
203
$137,214
493
$116,188
711
$101,094
149
$36,704
19
$460,565
214
$100,028
94
$39,461
APPLICATIONS APPROVED, NOT ACCEPTED
5
$126,336
43
$139,261
84
$102,180
21
$14,445
0
$0
12
$122,518
22
$40,174
APPLICATIONS DENIED
24
$113,567
94
$88,901
345
$123,535
80
$50,559
0
$0
41
$118,824
57
$54,502
APPLICATIONS WITHDRAWN
31
$142,129
38
$101,944
137
$121,714
20
$49,788
0
$0
19
$109,303
12
$88,713
FILES CLOSED FOR INCOMPLETENESS
4
$98,520
16
$132,743
40
$127,025
5
$26,000
0
$0
4
$159,860
2
$6,000
Aggregated Statistics For Year 2007 (Based on 12 full and 4 partial tracts)
A) FHA, FSA/RHS & VA Home Purchase Loans
B) Conventional Home Purchase Loans
C) Refinancings
D) Home Improvement Loans
E) Loans on Dwellings For 5+ Families
F) Non-occupant Loans on < 5 Family Dwellings (A B C & D)
G) Loans On Manufactured Home Dwelling (A B C & D)
Number
Average Value
Number
Average Value
Number
Average Value
Number
Average Value
Number
Average Value
Number
Average Value
Number
Average Value
LOANS ORIGINATED
153
$147,013
855
$106,755
756
$90,957
200
$30,028
21
$946,531
213
$91,184
94
$38,186
APPLICATIONS APPROVED, NOT ACCEPTED
11
$149,140
78
$110,308
100
$101,923
22
$21,332
0
$0
19
$100,658
24
$68,829
APPLICATIONS DENIED
12
$127,488
137
$95,404
493
$108,382
129
$38,340
0
$0
51
$101,764
60
$38,446
APPLICATIONS WITHDRAWN
9
$139,571
44
$127,548
224
$120,258
45
$68,860
0
$0
21
$119,972
4
$35,608
FILES CLOSED FOR INCOMPLETENESS
2
$127,735
37
$118,406
88
$115,970
9
$111,343
0
$0
12
$139,387
2
$53,925
Aggregated Statistics For Year 2006 (Based on 12 full and 4 partial tracts)
A) FHA, FSA/RHS & VA Home Purchase Loans
B) Conventional Home Purchase Loans
C) Refinancings
D) Home Improvement Loans
E) Loans on Dwellings For 5+ Families
F) Non-occupant Loans on < 5 Family Dwellings (A B C & D)
G) Loans On Manufactured Home Dwelling (A B C & D)
Number
Average Value
Number
Average Value
Number
Average Value
Number
Average Value
Number
Average Value
Number
Average Value
Number
Average Value
LOANS ORIGINATED
102
$128,823
1,148
$94,382
806
$80,154
254
$28,923
4
$188,155
329
$77,738
115
$34,773
APPLICATIONS APPROVED, NOT ACCEPTED
14
$168,223
140
$87,759
109
$95,692
33
$34,128
0
$0
21
$89,804
25
$34,798
APPLICATIONS DENIED
11
$112,501
264
$74,677
519
$96,714
92
$27,206
4
$124,265
39
$78,579
100
$52,849
APPLICATIONS WITHDRAWN
13
$128,909
152
$90,949
282
$104,771
37
$72,847
0
$0
26
$126,453
14
$30,394
FILES CLOSED FOR INCOMPLETENESS
0
$0
59
$97,490
123
$113,091
7
$53,066
0
$0
16
$92,489
0
$0
Aggregated Statistics For Year 2005 (Based on 12 full and 4 partial tracts)
A) FHA, FSA/RHS & VA Home Purchase Loans
B) Conventional Home Purchase Loans
C) Refinancings
D) Home Improvement Loans
E) Loans on Dwellings For 5+ Families
F) Non-occupant Loans on < 5 Family Dwellings (A B C & D)
G) Loans On Manufactured Home Dwelling (A B C & D)
Number
Average Value
Number
Average Value
Number
Average Value
Number
Average Value
Number
Average Value
Number
Average Value
Number
Average Value
LOANS ORIGINATED
149
$122,084
1,225
$90,294
988
$85,789
192
$20,689
25
$1,049,467
355
$78,559
122
$30,945
APPLICATIONS APPROVED, NOT ACCEPTED
6
$121,303
124
$88,779
150
$84,150
25
$22,366
0
$0
41
$95,328
24
$62,526
APPLICATIONS DENIED
18
$95,813
295
$74,157
581
$93,157
140
$35,675
0
$0
66
$95,333
126
$32,380
APPLICATIONS WITHDRAWN
8
$86,679
186
$110,569
314
$97,104
40
$37,636
2
$253,010
32
$92,810
16
$37,171
FILES CLOSED FOR INCOMPLETENESS
0
$0
33
$84,715
113
$119,893
15
$87,320
0
$0
8
$136,514
3
$71,773
Aggregated Statistics For Year 2004 (Based on 12 full and 4 partial tracts)
A) FHA, FSA/RHS & VA Home Purchase Loans
B) Conventional Home Purchase Loans
C) Refinancings
D) Home Improvement Loans
E) Loans on Dwellings For 5+ Families
F) Non-occupant Loans on < 5 Family Dwellings (A B C & D)
G) Loans On Manufactured Home Dwelling (A B C & D)
Number
Average Value
Number
Average Value
Number
Average Value
Number
Average Value
Number
Average Value
Number
Average Value
Number
Average Value
LOANS ORIGINATED
188
$107,933
1,005
$93,589
1,132
$81,971
162
$22,041
21
$241,752
393
$79,780
125
$28,714
APPLICATIONS APPROVED, NOT ACCEPTED
4
$108,652
121
$81,707
170
$80,911
21
$25,665
0
$0
15
$99,807
18
$38,884
APPLICATIONS DENIED
15
$125,584
198
$61,634
570
$77,147
133
$25,028
4
$191,975
60
$64,390
140
$26,832
APPLICATIONS WITHDRAWN
15
$119,873
82
$81,322
237
$97,930
25
$46,633
2
$64,945
25
$82,719
16
$37,738
FILES CLOSED FOR INCOMPLETENESS
6
$134,172
26
$99,080
156
$104,763
4
$15,728
0
$0
7
$74,027
3
$17,890
Aggregated Statistics For Year 2003 (Based on 12 full and 4 partial tracts)
A) FHA, FSA/RHS & VA Home Purchase Loans
B) Conventional Home Purchase Loans
C) Refinancings
D) Home Improvement Loans
E) Loans on Dwellings For 5+ Families
F) Non-occupant Loans on < 5 Family Dwellings (A B C & D)
Number
Average Value
Number
Average Value
Number
Average Value
Number
Average Value
Number
Average Value
Number
Average Value
LOANS ORIGINATED
287
$105,266
745
$86,421
1,869
$87,657
149
$21,101
11
$607,732
428
$72,449
APPLICATIONS APPROVED, NOT ACCEPTED
6
$102,230
101
$81,843
123
$70,526
12
$19,570
0
$0
32
$56,522
APPLICATIONS DENIED
6
$162,118
185
$58,244
577
$78,592
82
$21,511
2
$4,900
57
$64,543
APPLICATIONS WITHDRAWN
13
$89,297
84
$108,545
362
$88,560
13
$22,686
0
$0
34
$79,741
FILES CLOSED FOR INCOMPLETENESS
12
$128,422
36
$90,802
71
$80,064
18
$33,759
0
$0
19
$63,983
Aggregated Statistics For Year 2002 (Based on 12 full and 4 partial tracts)
A) FHA, FSA/RHS & VA Home Purchase Loans
B) Conventional Home Purchase Loans
C) Refinancings
D) Home Improvement Loans
E) Loans on Dwellings For 5+ Families
F) Non-occupant Loans on < 5 Family Dwellings (A B C & D)
Number
Average Value
Number
Average Value
Number
Average Value
Number
Average Value
Number
Average Value
Number
Average Value
LOANS ORIGINATED
247
$95,600
819
$81,284
1,148
$83,085
182
$14,020
13
$200,275
317
$62,972
APPLICATIONS APPROVED, NOT ACCEPTED
4
$85,952
90
$64,911
174
$78,040
18
$20,101
0
$0
16
$107,639
APPLICATIONS DENIED
9
$102,869
284
$41,767
408
$68,338
70
$20,341
2
$468,000
35
$42,058
APPLICATIONS WITHDRAWN
11
$102,157
92
$82,107
429
$76,614
24
$17,664
0
$0
26
$75,905
FILES CLOSED FOR INCOMPLETENESS
4
$99,335
28
$90,332
56
$74,772
3
$56,437
0
$0
8
$44,326
Aggregated Statistics For Year 2001 (Based on 12 full and 4 partial tracts)
A) FHA, FSA/RHS & VA Home Purchase Loans
B) Conventional Home Purchase Loans
C) Refinancings
D) Home Improvement Loans
E) Loans on Dwellings For 5+ Families
F) Non-occupant Loans on < 5 Family Dwellings (A B C & D)
Number
Average Value
Number
Average Value
Number
Average Value
Number
Average Value
Number
Average Value
Number
Average Value
LOANS ORIGINATED
312
$84,541
714
$69,329
1,043
$71,936
202
$15,968
9
$559,259
233
$63,604
APPLICATIONS APPROVED, NOT ACCEPTED
4
$96,635
124
$39,254
110
$70,483
21
$8,967
0
$0
19
$45,873
APPLICATIONS DENIED
9
$81,456
291
$41,029
326
$53,643
79
$13,735
2
$120,000
32
$50,958
APPLICATIONS WITHDRAWN
13
$99,856
53
$60,521
423
$76,498
18
$12,289
2
$440,000
17
$59,512
FILES CLOSED FOR INCOMPLETENESS
0
$0
11
$82,664
38
$70,724
21
$20,816
0
$0
4
$74,888
Aggregated Statistics For Year 2000 (Based on 12 full and 4 partial tracts)
A) FHA, FSA/RHS & VA Home Purchase Loans
B) Conventional Home Purchase Loans
C) Refinancings
D) Home Improvement Loans
E) Loans on Dwellings For 5+ Families
F) Non-occupant Loans on < 5 Family Dwellings (A B C & D)
Number
Average Value
Number
Average Value
Number
Average Value
Number
Average Value
Number
Average Value
Number
Average Value
LOANS ORIGINATED
322
$75,557
770
$54,838
381
$52,733
216
$12,410
8
$135,168
147
$47,140
APPLICATIONS APPROVED, NOT ACCEPTED
7
$72,100
196
$46,921
73
$38,993
35
$18,540
0
$0
12
$38,444
APPLICATIONS DENIED
11
$68,451
650
$37,600
275
$39,887
105
$14,267
0
$0
45
$46,323
APPLICATIONS WITHDRAWN
25
$79,957
102
$65,507
118
$45,272
4
$31,980
0
$0
6
$43,227
FILES CLOSED FOR INCOMPLETENESS
0
$0
15
$43,763
36
$62,914
5
$32,432
0
$0
2
$58,915
Aggregated Statistics For Year 1999 (Based on 7 full and 3 partial tracts)
A) FHA, FSA/RHS & VA Home Purchase Loans
B) Conventional Home Purchase Loans
C) Refinancings
D) Home Improvement Loans
E) Loans on Dwellings For 5+ Families
F) Non-occupant Loans on < 5 Family Dwellings (A B C & D)
2002 - 2018 National Fire Incident Reporting System (NFIRS) incidents
Based on the data from the years 2002 - 2018 the average number of fire incidents per year is 214. The highest number of fire incidents - 331 took place in 2015, and the least - 112 in 2008. The data has a rising trend.
When looking into fire subcategories, the most incidents belonged to: Structure Fires (48.9%), and Outside Fires (36.6%).
Fire incident types reported to NFIRS in Zip Code 57701


 Nearest zip codes: 57706, 57769, 57718, 57703, 57702, 57719.


 Based on the data from the years 2002 - 2018 the average number of fire incidents per year is 214. The highest number of fire incidents - 331 took place in 2015, and the least - 112 in 2008. The data has a rising trend.
 When looking into fire subcategories, the most incidents belonged to: Structure Fires (48.9%), and Outside Fires (36.6%).