Estimated zip code population in 2022: 1,067 Zip code population in 2010: 1,049 Zip code population in 2000: 1,016
Houses and condos: 534 Renter-occupied apartments: 92
% of renters here:
19%
State:
28%
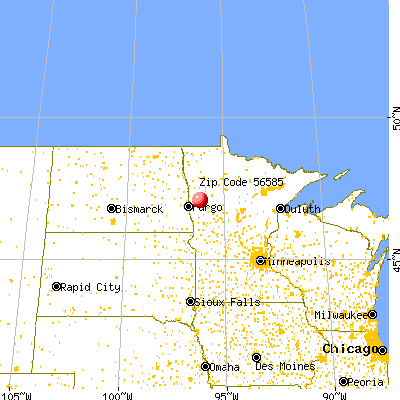
March 2022 cost of living index in zip code 56585: 86.2 (less than average, U.S. average is 100)
Land area: 117.5 sq. mi. Water area: 0.2 sq. mi.
Population density: 9 people per square mile
(very low).
OSM Map
General Map
Google Map
MSN Map
OSM Map
General Map
Google Map
MSN Map
OSM Map
General Map
Google Map
MSN Map
OSM Map
General Map
Google Map
MSN Map
Please wait while loading the map...
Real estate property taxes paid for housing units in 2022:
This zip code:
0.9% ($1,972)
Minnesota:
1.0% ($3,087)
Median real estate property taxes paid for housing units with mortgages in 2022: $1,729 (0.8%) Median real estate property taxes paid for housing units with no mortgage in 2022: $2,288 (1.0%)
Business Search- 14 Million verified businesses
Males: 557
(52.2%)
Females: 509
(47.8%)
For population 25 years and over in 56585:
High school or higher: 93.3%
Bachelor's degree or higher: 16.0%
Graduate or professional degree: 1.8%
Unemployed: 2.8%
Mean travel time to work (commute): 26.8 minutes
For population 15 years and over in 56585:
Never married: 17.4%
Now married: 55.0%
Separated: 0.2%
Widowed: 15.3%
Divorced: 12.1%
Zip code 56585 compared to state average:
Black race population percentage significantly below state average.
Hispanic race population percentage significantly below state average.
Median age significantly above state average.
Foreign-born population percentage significantly below state average.
Renting percentage below state average.
Length of stay since moving in significantly above state average.
Number of college students significantly below state average.
Percentage of population with a bachelor's degree or higher below state average.
Estimated median house/condo value in 2022: $214,999
56585:
$214,999
Minnesota:
$314,600
Median resident age:
This zip code:
51.0 years
Minnesota median age:
39.0 years
Average household size:
This zip code:
2.1 people
Minnesota:
2.4 people
Averages for the 2020 tax year for zip code 56585, filed in 2021:
Average Adjusted Gross Income (AGI) in 2020: $67,358 (Individual Income Tax Returns)
Here:
$67,358
State:
$82,178
Salary/wage: $53,382 (reported on 81.2% of returns)
Here:
$53,382
State:
$67,438
(% of AGI for various income ranges: 1383.3% for AGIs below $25k, 3385.0% for AGIs $25k-50k, 6848.3% for AGIs $50k-75k, 9862.5% for AGIs $75k-100k, 23067.5% for AGIs $100k-200k)
Taxable interest for individuals: $1,094 (reported on 35.4% of returns)
This zip code:
$1,094
Minnesota:
$1,814
(% of AGI for various income ranges: 18.3% for AGIs below $25k, 78.8% for AGIs $25k-50k, 33.3% for AGIs $50k-75k, 60.0% for AGIs $75k-100k, 170.0% for AGIs $100k-200k)
Ordinary dividends: $2,257 (reported on 14.6% of returns)
Here:
$2,257
State:
$6,928
(% of AGI for various income ranges: 95.0% for AGIs $25k-50k, 205.0% for AGIs $100k-200k)
Net capital gain/loss in AGI: +$8,378 (reported on 18.8% of returns)
Here:
+$8,378
State:
+$20,591
(% of AGI for various income ranges: 95.0% for AGIs below $25k, 341.7% for AGIs $50k-75k, 1230.0% for AGIs $100k-200k)
Profit/loss from business: +$12,017 (reported on 12.5% of returns)
Here:
+$12,017
State:
+$14,342
(% of AGI for various income ranges: 528.8% for AGIs $25k-50k, 745.0% for AGIs $75k-100k)
Taxable individual retirement arrangement distribution: $7,900 (reported on 10.4% of returns)
56585:
$7,900
Minnesota:
$20,675
(% of AGI for various income ranges: 215.0% for AGIs $25k-50k, 371.7% for AGIs $50k-75k)
Earned income credit: $2,167 (reported on 6.2% of returns)
Here:
$2,167
State:
$2,055
(% of AGI for various income ranges: 108.3% for AGIs below $25k)
Percentage of individuals using paid preparers for their 2020 taxes: 95.8%
Here:
96%
State:
94%
(% for various income ranges: 90.9% for AGIs below $25k, 91.7% for AGIs $25k-50k, 100.0% for AGIs $50k-75k, 100.0% for AGIs $75k-100k, 100.0% for AGIs $100k-200k)
Averages for the 2012 tax year for zip code 56585, filed in 2013:
Average Adjusted Gross Income (AGI) in 2012: $62,091 (Individual Income Tax Returns)
Here:
$62,091
State:
$67,192
Salary/wage: $38,674 (reported on 80.9% of returns)
Here:
$38,674
State:
$55,182
(% of AGI for various income ranges: 68.4% for AGIs below $25k, 73.5% for AGIs $25k-50k, 64.2% for AGIs $50k-75k, 66.9% for AGIs $75k-100k, 27.7% for AGIs $100k-200k)
Taxable interest for individuals: $1,124 (reported on 36.2% of returns)
This zip code:
$1,124
Minnesota:
$1,664
(% of AGI for various income ranges: 3.1% for AGIs below $25k, 0.6% for AGIs $25k-50k, 0.7% for AGIs $50k-75k, 0.3% for AGIs $75k-100k, 0.4% for AGIs $100k-200k)
Ordinary dividends: $1,314 (reported on 14.9% of returns)
Here:
$1,314
State:
$5,665
Net capital gain/loss in AGI: +$7,357 (reported on 14.9% of returns)
Here:
+$7,357
State:
+$16,131
(% of AGI for various income ranges: 1.0% for AGIs below $25k, 4.8% for AGIs $50k-75k, 1.9% for AGIs $100k-200k)
Profit/loss from business: +$5,317 (reported on 12.8% of returns)
Here:
+$5,317
State:
+$12,430
Taxable individual retirement arrangement distribution: $5,050 (reported on 12.8% of returns)
56585:
$5,050
Minnesota:
$15,212
Total itemized deductions: $24,609 (18% of AGI, reported on 23.4% of returns)
Here:
$24,609
State:
$24,665
Here:
18.1% of AGI
State:
19.6% of AGI
(% of AGI for various income ranges: 8.5% for AGIs $25k-50k, 6.2% for AGIs $50k-75k, 10.4% for AGIs $75k-100k, 12.0% for AGIs $100k-200k)
Charity contributions: $3,914 (reported on 14.9% of returns)
Here:
$3,914
State:
$3,948
Taxes paid: $9,209 (reported on 23.4% of returns)
56585:
$9,209
State:
$10,589
(% of AGI for various income ranges: 1.6% for AGIs $25k-50k, 1.6% for AGIs $50k-75k, 3.4% for AGIs $75k-100k, 5.5% for AGIs $100k-200k)
Earned income credit: $2,117 (reported on 12.8% of returns)
Here:
$2,117
State:
$2,037
(% of AGI for various income ranges: 4.0% for AGIs below $25k, 0.9% for AGIs $25k-50k)
Percentage of individuals using paid preparers for their 2012 taxes: 70.2%
Here:
70%
State:
55%
(% for various income ranges: 56.2% for AGIs below $25k, 61.5% for AGIs $25k-50k, 87.5% for AGIs $50k-75k, 80.0% for AGIs $75k-100k, 100.0% for AGIs $100k-200k)
Averages for the 2004 tax year for zip code 56585, filed in 2005:
Average Adjusted Gross Income (AGI) in 2004: $35,612 (Individual Income Tax Returns)
Here:
$35,612
State:
$53,560
Salary/wage: $28,945 (reported on 83.5% of returns)
Here:
$28,945
State:
$46,177
(% of AGI for various income ranges: 110.4% for AGIs below $10k, 72.6% for AGIs $10k-25k, 68.8% for AGIs $25k-50k, 72.7% for AGIs $50k-75k, 59.1% for AGIs $75k-100k, 51.7% for AGIs over 100k)
Taxable interest for individuals: $1,687 (reported on 49.9% of returns)
This zip code:
$1,687
Minnesota:
$1,796
(% of AGI for various income ranges: 2.5% for AGIs below $10k, 5.5% for AGIs $10k-25k, 3.3% for AGIs $25k-50k, 1.1% for AGIs $50k-75k, 0.8% for AGIs $75k-100k, 1.0% for AGIs over 100k)
Taxable dividends: $1,784 (reported on 16.1% of returns)
Here:
$1,784
State:
$3,096
(% of AGI for various income ranges: 0.7% for AGIs below $10k, 1.1% for AGIs $25k-50k, 1.0% for AGIs $50k-75k, 1.0% for AGIs $75k-100k)
Net capital gain/loss: +$2,369 (reported on 18.2% of returns)
Here:
+$2,369
State:
+$10,864
(% of AGI for various income ranges: 3.7% for AGIs $10k-25k, 0.7% for AGIs $25k-50k, 1.7% for AGIs $50k-75k, 0.8% for AGIs $75k-100k)
Profit/loss from business: +$6,869 (reported on 13.2% of returns)
Here:
+$6,869
State:
+$10,442
Profit/loss from farming: +$4,219 (reported on 15.8% of returns)
Here:
+$4,219
State:
-$962
(% of AGI for various income ranges: -9.2% for AGIs $10k-25k, 2.0% for AGIs $25k-50k, 2.2% for AGIs $50k-75k, 17.8% for AGIs $75k-100k)
IRA payment deduction: $3,824 (reported on 3.7% of returns)
56585:
$3,824
Minnesota:
$2,955
Total itemized deductions: $15,145 (23% of AGI, reported on 15.0% of returns)
Here:
$15,145
State:
$20,035
Here:
23.1% of AGI
State:
21.3% of AGI
Charity contributions deductions: $1,842 (3% of AGI, reported on 12.4% of returns)
Here:
$1,842
State:
$3,333
Here:
2.8% of AGI
State:
3.4% of AGI
Total tax: $4,362 (reported on 79.6% of returns)
56585:
$4,362
State:
$8,485
(% of AGI for various income ranges: 3.2% for AGIs below $10k, 3.9% for AGIs $10k-25k, 7.8% for AGIs $25k-50k, 9.8% for AGIs $50k-75k, 13.2% for AGIs $75k-100k, 18.4% for AGIs over 100k)
Earned income credit: $1,698 (reported on 11.5% of returns)
Here:
$1,698
State:
$1,523
Percentage of individuals using paid preparers for their 2004 taxes: 70.7%
Here:
71%
State:
59%
(% for various income ranges: 51.2% for AGIs below $10k, 67.3% for AGIs $10k-25k, 75.2% for AGIs $25k-50k, 84.6% for AGIs $50k-75k, 76.5% for AGIs $75k-100k, 73.3% for AGIs over 100k)
Likely homosexual households (counted as self-reported same-sex unmarried-partner households)
Lesbian couples: 0.4% of all households
Gay men: 0.0% of all households
Household received Food Stamps/SNAP in the past 12 months: 55 Household did not receive Food Stamps/SNAP in the past 12 months: 442
Women who had a birth in the past 12 months: 13 (4 now married, 8 unmarried) Women who did not have a birth in the past 12 months: 137 (77 now married, 59 unmarried)
Housing units in zip code 56585 with a mortgage: 205 (12 second mortgage, 10 both second mortgage and home equity loan) Median monthly owner costs for units with a mortgage: $1,471 Median monthly owner costs for units without a mortgage: $585
Residents with income below the poverty level in 2022:
This zip code:
16.5%
Whole state:
9.6%
Residents with income below 50% of the poverty level in 2022:
This zip code:
7.8%
Whole state:
5.2%
Median number of rooms in houses and condos:
Here:
7.0
State:
7.1
Median number of rooms in apartments:
Here:
3.2
State:
3.8
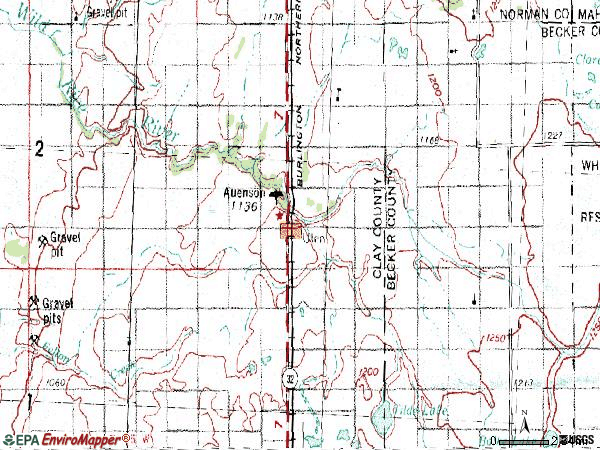
Notable locations in this zip code not listed on our city pages
Churches in zip code 56585 include: Atlanta Church (A), Walworth Baptist Church (B), Calvary Lutheran Church (C), Bethlehem Lutheran Church (D), Keene Church (E), Walworth Church (F). Display/hide their locations on the map
Cemeteries: Bethlehem Memorial Cemetery (1), Keene Cemetery (2), Old Jevnaker Cemetery (3), Sleeper Cemetery (4), Atlanta Cemetery (5), Walworth Baptist Cemetery (6). Display/hide their locations on the map
In group quarters: 34 (-1 institutionalized population)
Size of family households: 188 2-persons, 41 3-persons, 57 4-persons, 25 5-persons, 12 6-persons
Size of nonfamily households: 149 1-person, 19 2-persons, 2 3-persons
133 married couples with children.
92 single-parent households (40 men, 52 women).
98.8% of residents of 56585 zip code speak English at home.
0.5% of residents speak Spanish at home (60% very well, 40% well).
1.4% of residents speak other Indo-European language at home (100% very well).
0.1% of residents speak other language at home (100% very well).
Foreign born population: 3 (0.3%) (67.9% of them are naturalized citizens)
This zip code:
0.3%
Whole state:
8.7%
45%German
33%Norwegian
6%Scandinavian
2%Czech
1%Irish
1%Scotch-Irish
1%European
Year of entry for the foreign-born population
02010 or later
02000 to 2009
01990 to 1999
3Before 1990
Housing units lacking complete plumbing facilities: 2.4% Housing units lacking complete kitchen facilities: 2.0%
39.4%Bottled, tank, or LP gas
25.8%Electricity
21.5%Utility gas
7.1%Fuel oil, kerosene, etc.
6.5%Wood
Population in 1990: 939. Population change in the 1990s: +77 (+8.2%).
Place of birth for U.S.-born residents:
This state: 655
Northeast: 6
Midwest: 364
South: 7
West: 21
65% of the 56585 zip code residents lived in the same house 5 years ago. Out of people who lived in different houses, 69% lived in this county. Out of people who lived in different counties, 50% lived in Minnesota.
93% of the 56585 zip code residents lived in the same house 1 year ago. Out of people who lived in different houses, 31% moved from this county. Out of people who lived in different houses, 34% moved from different county within same state. Out of people who lived in different houses, 39% moved from different state.
Private vs. public school enrollment:
Students in private schools in grades 1 to 8 (elementary and middle school): 1
Here:
1.1%
Minnesota:
12.9%
Students in private schools in grades 9 to 12 (high school): 1
Here:
2.1%
Minnesota:
8.6%
Students in private undergraduate colleges:
Here:
0.0%
Minnesota:
26.2%
Occupation by median earnings in the past 12 months ($)
114,099Computer and mathematical occupations
70,535Construction and extraction occupations
68,174Health diagnosing and treating practitioners and other technical occupations
64,592Education, training, and library occupations
60,688Business and financial operations occupations
59,951Installation, maintenance, and repair occupations
Top industries in this zip code by the number of employees in 2005:
Wholesale Trade: Grain and Field Bean Merchant Wholesalers (20-49 employees: 1 establishment)
Accommodation and Food Services: Full-Service Restaurants (10-19: 1, 1-4: 1)
Finance and Insurance: Commercial Banking (10-19: 1)
Health Care and Social Assistance: Offices of Physical, Occupational and Speech Therapists, and Audiologists (10-19: 1)
Other Services (except Public Administration): Civic and Social Organizations (5-9: 1)
Construction: Residential Remodelers (5-9: 1)
People in group quarters in 2010:
41 people in nursing facilities/skilled-nursing facilities
People in group quarters in 2000:
77 people in nursing homes
Fatal accident statistics in 2010:
Fatal accident count: 1
Vehicles involved in fatal accidents: 2
Fatal accidents caused by drunken drivers: 0
Fatalities: 3
Persons involved in fatal accidents: 3
Pedestrians involved in fatal accidents: 0
Home Mortgage Disclosure Act Aggregated Statistics For Year 2009 (Based on 2 partial tracts)
A) FHA, FSA/RHS & VA Home Purchase Loans
B) Conventional Home Purchase Loans
C) Refinancings
D) Home Improvement Loans
F) Non-occupant Loans on < 5 Family Dwellings (A B C & D)
G) Loans On Manufactured Home Dwelling (A B C & D)
Number
Average Value
Number
Average Value
Number
Average Value
Number
Average Value
Number
Average Value
Number
Average Value
LOANS ORIGINATED
11
$143,335
19
$126,421
85
$131,624
14
$37,310
4
$106,545
7
$25,471
APPLICATIONS APPROVED, NOT ACCEPTED
0
$0
2
$124,665
2
$172,985
0
$0
0
$0
0
$0
APPLICATIONS DENIED
1
$123,700
5
$106,110
14
$136,159
1
$25,610
0
$0
2
$46,145
APPLICATIONS WITHDRAWN
2
$129,980
1
$230,970
13
$145,964
0
$0
0
$0
0
$0
FILES CLOSED FOR INCOMPLETENESS
0
$0
0
$0
2
$175,645
0
$0
0
$0
0
$0
Aggregated Statistics For Year 2008 (Based on 2 partial tracts)
A) FHA, FSA/RHS & VA Home Purchase Loans
B) Conventional Home Purchase Loans
C) Refinancings
D) Home Improvement Loans
E) Loans on Dwellings For 5+ Families
F) Non-occupant Loans on < 5 Family Dwellings (A B C & D)
G) Loans On Manufactured Home Dwelling (A B C & D)
Number
Average Value
Number
Average Value
Number
Average Value
Number
Average Value
Number
Average Value
Number
Average Value
Number
Average Value
LOANS ORIGINATED
7
$144,407
24
$124,122
44
$130,332
15
$40,621
1
$187,000
6
$75,057
4
$32,615
APPLICATIONS APPROVED, NOT ACCEPTED
0
$0
1
$186,030
4
$190,140
1
$29,480
0
$0
0
$0
0
$0
APPLICATIONS DENIED
1
$120,800
6
$77,473
12
$162,597
3
$30,280
0
$0
1
$33,340
1
$45,900
APPLICATIONS WITHDRAWN
0
$0
1
$135,300
10
$163,853
1
$106,300
0
$0
1
$155,110
0
$0
FILES CLOSED FOR INCOMPLETENESS
0
$0
0
$0
2
$214,780
0
$0
0
$0
0
$0
0
$0
Aggregated Statistics For Year 2007 (Based on 2 partial tracts)
A) FHA, FSA/RHS & VA Home Purchase Loans
B) Conventional Home Purchase Loans
C) Refinancings
D) Home Improvement Loans
F) Non-occupant Loans on < 5 Family Dwellings (A B C & D)
G) Loans On Manufactured Home Dwelling (A B C & D)
Number
Average Value
Number
Average Value
Number
Average Value
Number
Average Value
Number
Average Value
Number
Average Value
LOANS ORIGINATED
3
$116,933
32
$122,793
44
$103,361
21
$29,452
4
$63,058
6
$45,823
APPLICATIONS APPROVED, NOT ACCEPTED
0
$0
5
$143,608
8
$99,298
3
$86,170
2
$148,340
0
$0
APPLICATIONS DENIED
0
$0
8
$89,452
16
$132,488
6
$34,065
1
$63,780
1
$90,360
APPLICATIONS WITHDRAWN
1
$93,740
2
$208,260
14
$144,374
1
$125,630
1
$140,130
0
$0
FILES CLOSED FOR INCOMPLETENESS
0
$0
0
$0
3
$130,463
1
$31,410
0
$0
0
$0
Aggregated Statistics For Year 2006 (Based on 2 partial tracts)
A) FHA, FSA/RHS & VA Home Purchase Loans
B) Conventional Home Purchase Loans
C) Refinancings
D) Home Improvement Loans
F) Non-occupant Loans on < 5 Family Dwellings (A B C & D)
G) Loans On Manufactured Home Dwelling (A B C & D)
Number
Average Value
Number
Average Value
Number
Average Value
Number
Average Value
Number
Average Value
Number
Average Value
LOANS ORIGINATED
7
$108,789
48
$100,959
47
$105,636
19
$38,732
6
$87,620
4
$53,515
APPLICATIONS APPROVED, NOT ACCEPTED
0
$0
7
$92,153
7
$110,514
3
$53,473
0
$0
0
$0
APPLICATIONS DENIED
1
$71,510
8
$75,802
16
$105,639
8
$38,172
2
$100,990
2
$35,030
APPLICATIONS WITHDRAWN
0
$0
6
$140,370
14
$131,051
2
$95,190
0
$0
1
$77,800
FILES CLOSED FOR INCOMPLETENESS
0
$0
1
$115,970
7
$106,441
0
$0
0
$0
0
$0
Aggregated Statistics For Year 2005 (Based on 2 partial tracts)
A) FHA, FSA/RHS & VA Home Purchase Loans
B) Conventional Home Purchase Loans
C) Refinancings
D) Home Improvement Loans
E) Loans on Dwellings For 5+ Families
F) Non-occupant Loans on < 5 Family Dwellings (A B C & D)
G) Loans On Manufactured Home Dwelling (A B C & D)
Number
Average Value
Number
Average Value
Number
Average Value
Number
Average Value
Number
Average Value
Number
Average Value
Number
Average Value
LOANS ORIGINATED
5
$119,254
47
$101,009
55
$100,883
15
$29,282
1
$402,020
2
$91,085
2
$56,050
APPLICATIONS APPROVED, NOT ACCEPTED
0
$0
4
$149,068
7
$100,713
1
$144,960
0
$0
1
$263,830
0
$0
APPLICATIONS DENIED
0
$0
8
$79,365
19
$98,395
3
$97,930
0
$0
1
$173,470
3
$26,253
APPLICATIONS WITHDRAWN
0
$0
6
$108,478
19
$139,950
1
$135,300
0
$0
0
$0
1
$86,980
FILES CLOSED FOR INCOMPLETENESS
0
$0
0
$0
7
$110,514
0
$0
0
$0
0
$0
0
$0
Aggregated Statistics For Year 2004 (Based on 2 partial tracts)
A) FHA, FSA/RHS & VA Home Purchase Loans
B) Conventional Home Purchase Loans
C) Refinancings
D) Home Improvement Loans
E) Loans on Dwellings For 5+ Families
F) Non-occupant Loans on < 5 Family Dwellings (A B C & D)
G) Loans On Manufactured Home Dwelling (A B C & D)
Number
Average Value
Number
Average Value
Number
Average Value
Number
Average Value
Number
Average Value
Number
Average Value
Number
Average Value
LOANS ORIGINATED
3
$124,987
38
$102,909
65
$94,982
22
$31,913
1
$299,580
5
$61,270
7
$36,861
APPLICATIONS APPROVED, NOT ACCEPTED
0
$0
2
$135,055
5
$122,540
1
$32,860
0
$0
0
$0
0
$0
APPLICATIONS DENIED
0
$0
7
$117,624
21
$96,295
4
$19,208
0
$0
0
$0
4
$85,890
APPLICATIONS WITHDRAWN
0
$0
5
$138,582
16
$115,364
0
$0
0
$0
0
$0
2
$148,100
FILES CLOSED FOR INCOMPLETENESS
0
$0
0
$0
12
$107,190
0
$0
0
$0
0
$0
1
$75,380
Aggregated Statistics For Year 2003 (Based on 2 partial tracts)
A) FHA, FSA/RHS & VA Home Purchase Loans
B) Conventional Home Purchase Loans
C) Refinancings
D) Home Improvement Loans
F) Non-occupant Loans on < 5 Family Dwellings (A B C & D)
Number
Average Value
Number
Average Value
Number
Average Value
Number
Average Value
Number
Average Value
LOANS ORIGINATED
6
$89,150
34
$102,808
139
$93,539
10
$20,198
3
$76,667
APPLICATIONS APPROVED, NOT ACCEPTED
0
$0
2
$97,850
8
$100,626
0
$0
0
$0
APPLICATIONS DENIED
0
$0
4
$98,935
31
$86,773
1
$21,740
0
$0
APPLICATIONS WITHDRAWN
0
$0
4
$157,282
19
$80,720
0
$0
1
$120,800
FILES CLOSED FOR INCOMPLETENESS
0
$0
1
$120,320
1
$148,830
0
$0
0
$0
Aggregated Statistics For Year 2002 (Based on 2 partial tracts)
A) FHA, FSA/RHS & VA Home Purchase Loans
B) Conventional Home Purchase Loans
C) Refinancings
D) Home Improvement Loans
F) Non-occupant Loans on < 5 Family Dwellings (A B C & D)
Number
Average Value
Number
Average Value
Number
Average Value
Number
Average Value
Number
Average Value
LOANS ORIGINATED
5
$83,496
29
$76,012
98
$88,450
14
$14,738
2
$126,600
APPLICATIONS APPROVED, NOT ACCEPTED
0
$0
0
$0
12
$83,593
2
$22,950
0
$0
APPLICATIONS DENIED
0
$0
7
$54,740
14
$84,249
1
$82,140
1
$63,300
APPLICATIONS WITHDRAWN
0
$0
1
$118,380
8
$81,178
0
$0
0
$0
FILES CLOSED FOR INCOMPLETENESS
0
$0
0
$0
2
$105,820
0
$0
0
$0
Aggregated Statistics For Year 2001 (Based on 2 partial tracts)
A) FHA, FSA/RHS & VA Home Purchase Loans
B) Conventional Home Purchase Loans
C) Refinancings
D) Home Improvement Loans
F) Non-occupant Loans on < 5 Family Dwellings (A B C & D)
Number
Average Value
Number
Average Value
Number
Average Value
Number
Average Value
Number
Average Value
LOANS ORIGINATED
8
$76,648
29
$69,064
72
$71,809
13
$18,548
2
$43,490
APPLICATIONS APPROVED, NOT ACCEPTED
0
$0
1
$49,290
6
$47,757
1
$37,210
0
$0
APPLICATIONS DENIED
0
$0
8
$43,669
9
$81,661
2
$23,920
0
$0
APPLICATIONS WITHDRAWN
1
$90,840
4
$79,245
6
$67,327
1
$13,530
0
$0
FILES CLOSED FOR INCOMPLETENESS
0
$0
0
$0
1
$195,210
0
$0
0
$0
Aggregated Statistics For Year 2000 (Based on 2 partial tracts)
A) FHA, FSA/RHS & VA Home Purchase Loans
B) Conventional Home Purchase Loans
C) Refinancings
D) Home Improvement Loans
F) Non-occupant Loans on < 5 Family Dwellings (A B C & D)
Number
Average Value
Number
Average Value
Number
Average Value
Number
Average Value
Number
Average Value
LOANS ORIGINATED
5
$58,080
20
$56,800
29
$68,931
17
$14,638
0
$0
APPLICATIONS APPROVED, NOT ACCEPTED
0
$0
3
$63,783
3
$71,997
1
$16,910
0
$0
APPLICATIONS DENIED
0
$0
8
$35,395
11
$35,669
3
$20,133
1
$64,270
APPLICATIONS WITHDRAWN
1
$112,590
2
$118,865
5
$59,240
0
$0
0
$0
FILES CLOSED FOR INCOMPLETENESS
0
$0
0
$0
1
$84,080
0
$0
0
$0
Aggregated Statistics For Year 1999 (Based on 1 partial tract)
A) FHA, FSA/RHS & VA Home Purchase Loans
B) Conventional Home Purchase Loans
C) Refinancings
D) Home Improvement Loans
F) Non-occupant Loans on < 5 Family Dwellings (A B C & D)
Detailed PMIC statistics for the following Tracts:0302.01
2002 - 2018 National Fire Incident Reporting System (NFIRS) incidents
According to the data from the years 2002 - 2018 the average number of fire incidents per year is 6. The highest number of fires - 15 took place in 2015, and the least - 0 in 2007. The data has a decreasing trend.
When looking into fire subcategories, the most reports belonged to: Outside Fires (64.5%), and Other (15.5%).
Fire incident types reported to NFIRS in Zip Code 56585


+$4,219
-$962
(% of AGI for various income ranges: -9.2% for AGIs $10k-25k, 2.0% for AGIs $25k-50k, 2.2% for AGIs $50k-75k, 17.8% for AGIs $75k-100k)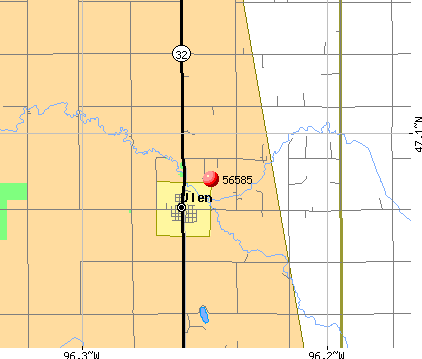 Nearest zip codes: 56552, 56541, 56584, 56554, 56519, 56549.


 According to the data from the years 2002 - 2018 the average number of fire incidents per year is 6. The highest number of fires - 15 took place in 2015, and the least - 0 in 2007. The data has a decreasing trend.
 When looking into fire subcategories, the most reports belonged to: Outside Fires (64.5%), and Other (15.5%).