Estimated zip code population in 2022: 1,308 Zip code population in 2010: 1,160 Zip code population in 2000: 1,159
Houses and condos: 548 Renter-occupied apartments: 147
% of renters here:
30%
State:
28%
March 2022 cost of living index in zip code 56556: 84.9 (less than average, U.S. average is 100)
Land area: 98.6 sq. mi. Water area: 2.2 sq. mi.
Population density: 13 people per square mile
(very low).
OSM Map
General Map
Google Map
MSN Map
OSM Map
General Map
Google Map
MSN Map
OSM Map
General Map
Google Map
MSN Map
OSM Map
General Map
Google Map
MSN Map
Please wait while loading the map...
Real estate property taxes paid for housing units in 2022:
This zip code:
1.0% ($1,493)
Minnesota:
1.0% ($3,087)
Median real estate property taxes paid for housing units with mortgages in 2022: $1,569 (1.1%) Median real estate property taxes paid for housing units with no mortgage in 2022: $1,415 (0.9%)
Business Search- 14 Million verified businesses
Males: 763
(58.3%)
Females: 544
(41.7%)
For population 25 years and over in 56556:
High school or higher: 92.7%
Bachelor's degree or higher: 32.2%
Graduate or professional degree: 4.6%
Unemployed: 2.8%
Mean travel time to work (commute): 18.4 minutes
For population 15 years and over in 56556:
Never married: 32.8%
Now married: 45.9%
Separated: 0.3%
Widowed: 10.8%
Divorced: 10.2%
Zip code 56556 compared to state average:
Median house value below state average.
Length of stay since moving in significantly above state average.
House age above state average.
Number of college students significantly below state average.
Estimated median house/condo value in 2022: $148,086
56556:
$148,086
Minnesota:
$314,600
Median resident age:
This zip code:
35.9 years
Minnesota median age:
39.0 years
Average household size:
This zip code:
2.5 people
Minnesota:
2.4 people
Averages for the 2020 tax year for zip code 56556, filed in 2021:
Average Adjusted Gross Income (AGI) in 2020: $54,348 (Individual Income Tax Returns)
Here:
$54,348
State:
$82,178
Salary/wage: $45,171 (reported on 78.8% of returns)
Here:
$45,171
State:
$67,438
(% of AGI for various income ranges: 1242.2% for AGIs below $25k, 3916.4% for AGIs $25k-50k, 6776.7% for AGIs $50k-75k, 10166.7% for AGIs $75k-100k, 14945.0% for AGIs $100k-200k)
Taxable interest for individuals: $1,065 (reported on 32.7% of returns)
This zip code:
$1,065
Minnesota:
$1,814
(% of AGI for various income ranges: 27.8% for AGIs below $25k, 49.1% for AGIs $25k-50k, 66.7% for AGIs $50k-75k, 63.3% for AGIs $75k-100k, 107.5% for AGIs $100k-200k)
Ordinary dividends: $1,857 (reported on 13.5% of returns)
Here:
$1,857
State:
$6,928
(% of AGI for various income ranges: 59.1% for AGIs $25k-50k, 216.7% for AGIs $75k-100k)
Net capital gain/loss in AGI: +$10,025 (reported on 15.4% of returns)
Here:
+$10,025
State:
+$20,591
(% of AGI for various income ranges: 29.1% for AGIs $25k-50k, 308.3% for AGIs $50k-75k, 1462.5% for AGIs $100k-200k)
Profit/loss from business: +$5,578 (reported on 17.3% of returns)
Here:
+$5,578
State:
+$14,342
(% of AGI for various income ranges: 181.1% for AGIs below $25k, 37.3% for AGIs $25k-50k, 993.3% for AGIs $75k-100k)
Taxable individual retirement arrangement distribution: $7,500 (reported on 11.5% of returns)
56556:
$7,500
Minnesota:
$20,675
(% of AGI for various income ranges: 182.7% for AGIs $25k-50k, 830.0% for AGIs $75k-100k)
Earned income credit: $2,633 (reported on 11.5% of returns)
Here:
$2,633
State:
$2,055
(% of AGI for various income ranges: 96.7% for AGIs below $25k, 64.5% for AGIs $25k-50k)
Percentage of individuals using paid preparers for their 2020 taxes: 96.2%
Here:
96%
State:
94%
(% for various income ranges: 93.3% for AGIs below $25k, 93.8% for AGIs $25k-50k, 100.0% for AGIs $50k-75k, 100.0% for AGIs $75k-100k, 100.0% for AGIs $100k-200k)
Averages for the 2012 tax year for zip code 56556, filed in 2013:
Average Adjusted Gross Income (AGI) in 2012: $42,469 (Individual Income Tax Returns)
Here:
$42,469
State:
$67,192
Salary/wage: $34,688 (reported on 78.4% of returns)
Here:
$34,688
State:
$55,182
(% of AGI for various income ranges: 61.2% for AGIs below $25k, 71.1% for AGIs $25k-50k, 67.7% for AGIs $50k-75k, 68.6% for AGIs $75k-100k, 54.0% for AGIs $100k-200k)
Taxable interest for individuals: $812 (reported on 33.3% of returns)
This zip code:
$812
Minnesota:
$1,664
(% of AGI for various income ranges: 2.4% for AGIs below $25k, 0.7% for AGIs $25k-50k, 0.4% for AGIs $50k-75k, 0.3% for AGIs $100k-200k)
Ordinary dividends: $1,967 (reported on 17.6% of returns)
Here:
$1,967
State:
$5,665
(% of AGI for various income ranges: 1.4% for AGIs below $25k, 1.3% for AGIs $25k-50k, 2.2% for AGIs $75k-100k)
Net capital gain/loss in AGI: +$5,990 (reported on 19.6% of returns)
Here:
+$5,990
State:
+$16,131
(% of AGI for various income ranges: 0.6% for AGIs below $25k, 2.2% for AGIs $50k-75k, 14.8% for AGIs $75k-100k)
Profit/loss from business: +$8,436 (reported on 21.6% of returns)
Here:
+$8,436
State:
+$12,430
(% of AGI for various income ranges: 14.9% for AGIs below $25k, 2.9% for AGIs $25k-50k, 8.6% for AGIs $50k-75k)
Taxable individual retirement arrangement distribution: $6,700 (reported on 11.8% of returns)
56556:
$6,700
Minnesota:
$15,212
Total itemized deductions: $17,530 (22% of AGI, reported on 19.6% of returns)
Here:
$17,530
State:
$24,665
Here:
21.7% of AGI
State:
19.6% of AGI
(% of AGI for various income ranges: 9.6% for AGIs $25k-50k, 13.4% for AGIs $50k-75k, 10.5% for AGIs $100k-200k)
Charity contributions: $3,038 (reported on 15.7% of returns)
Here:
$3,038
State:
$3,948
(% of AGI for various income ranges: 2.5% for AGIs below $25k, 1.2% for AGIs $50k-75k, 2.1% for AGIs $100k-200k)
Taxes paid: $7,110 (reported on 19.6% of returns)
56556:
$7,110
State:
$10,589
(% of AGI for various income ranges: 2.0% for AGIs $25k-50k, 4.1% for AGIs $50k-75k, 6.9% for AGIs $100k-200k)
Earned income credit: $2,150 (reported on 15.7% of returns)
Here:
$2,150
State:
$2,037
(% of AGI for various income ranges: 5.0% for AGIs below $25k, 0.9% for AGIs $25k-50k)
Percentage of individuals using paid preparers for their 2012 taxes: 74.5%
Here:
75%
State:
55%
(% for various income ranges: 71.4% for AGIs below $25k, 71.4% for AGIs $25k-50k, 87.5% for AGIs $50k-75k, 75.0% for AGIs $75k-100k, 75.0% for AGIs $100k-200k)
Averages for the 2004 tax year for zip code 56556, filed in 2005:
Average Adjusted Gross Income (AGI) in 2004: $32,715 (Individual Income Tax Returns)
Here:
$32,715
State:
$53,560
Salary/wage: $27,662 (reported on 77.8% of returns)
Here:
$27,662
State:
$46,177
(% of AGI for various income ranges: 85.3% for AGIs below $10k, 65.9% for AGIs $10k-25k, 71.3% for AGIs $25k-50k, 76.8% for AGIs $50k-75k, 88.1% for AGIs $75k-100k)
Taxable interest for individuals: $1,364 (reported on 48.9% of returns)
This zip code:
$1,364
Minnesota:
$1,796
(% of AGI for various income ranges: 7.2% for AGIs below $10k, 3.1% for AGIs $10k-25k, 2.7% for AGIs $25k-50k, 1.0% for AGIs $50k-75k, 2.0% for AGIs $75k-100k)
Taxable dividends: $1,133 (reported on 21.2% of returns)
Here:
$1,133
State:
$3,096
(% of AGI for various income ranges: 5.1% for AGIs below $10k, 2.0% for AGIs $10k-25k, 0.5% for AGIs $25k-50k, 0.3% for AGIs $50k-75k, 0.4% for AGIs $75k-100k)
Net capital gain/loss: +$590 (reported on 20.2% of returns)
Here:
+$590
State:
+$10,864
(% of AGI for various income ranges: -2.3% for AGIs below $10k, -0.3% for AGIs $10k-25k, 1.1% for AGIs $25k-50k, 0.5% for AGIs $50k-75k, -0.1% for AGIs $75k-100k)
Profit/loss from business: +$6,773 (reported on 19.6% of returns)
Here:
+$6,773
State:
+$10,442
(% of AGI for various income ranges: 13.6% for AGIs below $10k, 4.5% for AGIs $10k-25k, 6.2% for AGIs $25k-50k, 3.9% for AGIs $50k-75k)
IRA payment deduction: $2,517 (reported on 5.9% of returns)
56556:
$2,517
Minnesota:
$2,955
Total itemized deductions: $14,607 (27% of AGI, reported on 17.0% of returns)
Here:
$14,607
State:
$20,035
Here:
27.2% of AGI
State:
21.3% of AGI
(% of AGI for various income ranges: 6.9% for AGIs $10k-25k, 7.4% for AGIs $25k-50k, 7.9% for AGIs $50k-75k, 17.2% for AGIs $75k-100k)
Charity contributions deductions: $2,549 (4% of AGI, reported on 14.3% of returns)
Here:
$2,549
State:
$3,333
Here:
4.5% of AGI
State:
3.4% of AGI
(% of AGI for various income ranges: 1.4% for AGIs $10k-25k, 1.1% for AGIs $25k-50k, 1.2% for AGIs $50k-75k, 1.8% for AGIs $75k-100k)
Total tax: $3,432 (reported on 76.8% of returns)
56556:
$3,432
State:
$8,485
(% of AGI for various income ranges: 4.0% for AGIs below $10k, 3.7% for AGIs $10k-25k, 7.1% for AGIs $25k-50k, 8.0% for AGIs $50k-75k, 11.6% for AGIs $75k-100k, 13.5% for AGIs over 100k)
Earned income credit: $1,628 (reported on 15.8% of returns)
Here:
$1,628
State:
$1,523
Percentage of individuals using paid preparers for their 2004 taxes: 80.6%
Here:
81%
State:
59%
(% for various income ranges: 69.2% for AGIs below $10k, 82.3% for AGIs $10k-25k, 83.9% for AGIs $25k-50k, 82.1% for AGIs $50k-75k, 87.5% for AGIs $75k-100k, 100.0% for AGIs over 100k)
Household received Food Stamps/SNAP in the past 12 months: 36 Household did not receive Food Stamps/SNAP in the past 12 months: 451
Women who had a birth in the past 12 months: 14 (14 now married, 0 unmarried) Women who did not have a birth in the past 12 months: 147 (80 now married, 66 unmarried)
Housing units in zip code 56556 with a mortgage: 165 (8 second mortgage, 3 both second mortgage and home equity loan) Houses without a mortgage: 1
Median monthly owner costs for units with a mortgage: $1,171 Median monthly owner costs for units without a mortgage: $495
Residents with income below the poverty level in 2022:
This zip code:
20.3%
Whole state:
9.6%
Residents with income below 50% of the poverty level in 2022:
This zip code:
5.7%
Whole state:
5.2%
Median number of rooms in houses and condos:
Here:
6.9
State:
7.1
Median number of rooms in apartments:
Here:
2.9
State:
3.8
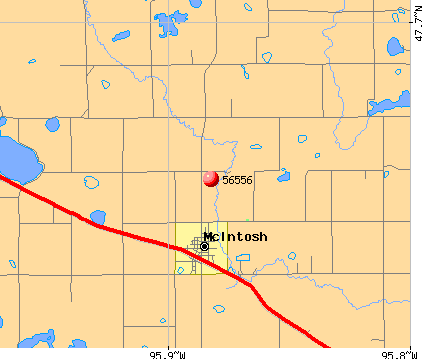
Notable locations in this zip code not listed on our city pages
Notable locations in zip code 56556: City of McIntosh Campground (A), McIntosh (B), McIntosh City Hall (C), McIntosh Volunteer Fire Department (D), McIntosh Police Department (E), McIntosh Public Library (F). Display/hide their locations on the map
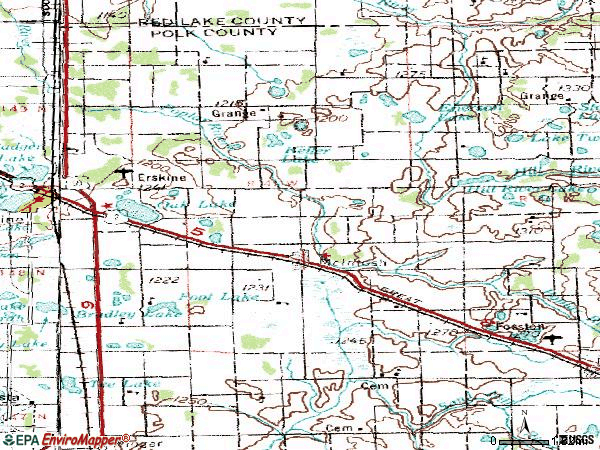
Churches in zip code 56556 include: Asphult Church (A), Gosen Church (B), Salem Church (C), Our Saviour's Lutheran Church (D), Immanuel Lutheran Church (E), Trinity Church (F). Display/hide their locations on the map
Cemeteries: New Sweden Cemetery (1), Oakland Cemetery (2), Olivet Cemetery (3), Saint Johns Cemetery (4), Dovre Cemetery (5), Saint Lukes Cemetery (6), Asphult Cemetery (7). Display/hide their locations on the map
Lakes: Berg Lake (A), Willow Water Lake (B), Wardeberg Lake (C), Twentyeight Lake (D), Sundquist Lake (E), State Lake (F), Schelicher Lake (G), Round Lake (H). Display/hide their locations on the map
Parks in zip code 56556 include: Enerson State Wildlife Management Area (1), Lessor State Wildlife Management Area (2). Display/hide their locations on the map
In group quarters: 88 (-1 institutionalized population)
Size of family households: 159 2-persons, 46 3-persons, 33 4-persons, 19 5-persons, 10 6-persons, 12 7-or-more-persons
Size of nonfamily households: 147 1-person, 57 2-persons, 1 3-persons
260 married couples with children.
36 single-parent households (11 men, 25 women).
73.3% of residents of 56556 zip code speak English at home.
0.3% of residents speak Spanish at home (50% very well, 50% not well).
14.2% of residents speak other Indo-European language at home (88% very well, 5% well, 6% not well).
0.3% of residents speak Asian or Pacific Island language at home (100% well).
12.0% of residents speak other language at home (38% very well, 62% well).
Foreign born population: 114 (8.8%) (10.1% of them are naturalized citizens)
This zip code:
8.8%
Whole state:
8.7%
49%Tanzania
14%Bolivia
4%Honduras
3%Malaysia
2%Afghanistan
21%Norwegian
17%Russian
15%Ugandan
9%German
7%American
4%Scandinavian
3%English
Year of entry for the foreign-born population
1182010 or later
02000 to 2009
101990 to 1999
4Before 1990
Facilities with environmental interests located in this zip code:
MCINTOSH WWTP (TOWNSHIP ROAD 598 in MCINTOSH, MN)
STATE MASTER (Minnesota Pollution Control Agency permits and compilance tracking) - PCS-MNG580031, National Pollutant Discharge Elimination System Permit National Pollutant Discharge Elimination System NON-MAJOR (Tracking pollutant discharge elimination systems) - permit Business SIC classification: SEWERAGE SYSTEMS Business NAICS classification: SEWAGE TREATMENT FACILITIES. Organizations: MCINTOSH CITY OF (CONTACT/OWNER)
DANS STANDARD (230 3RD ST SW in MCINTOSH, MN)
STATE MASTER (Minnesota Pollution Control Agency permits and compilance tracking) - RCRAINFO-MND982650723, CESQG, RCRIS-MND982650723, HAZARDOUS WASTE PROGRAM Small Quantity Generators, between 100 kg and 1000 kg of hazardous waste/month (Resource Conservation and Recovery Act (tracking hazardous waste)) - notification Business SIC classification: GASOLINE SERVICE STATIONS Business NAICS classification: GASOLINE STATIONS WITH CONVENIENCE STORES. Organizations: SAUHUS DAN (CONTACT/OWNER)
, DAN S STANDARD (CONTACT/OWNER)
MCINTOSH (CITY HALL in MCINTOSH, MN)
National Pollutant Discharge Elimination System NON-MAJOR (Tracking pollutant discharge elimination systems) - permit COMMUNITY WATER SYSTEM (SDWIS) - SDWIS-MN1600011 3, WATER TREATMENT PLANT Business SIC classification: SEWERAGE SYSTEMS
ISD 2609 WIN E MAC SCHOOL (110 STATE STREET SOUTHEAST in MCINTOSH, MN)
AIR MINOR (AIRS/AFS) CRITERIA AND HAZARDOUS AIR POLLUTANT INVENTORY (Inventory of air pollution sources) (Resource Conservation and Recovery Act (tracking hazardous waste)) Business SIC classification: MOTOR VEHICLE PARTS, USED Organizations: WIN E MAC SCHOOL 2609 (CONTACT/OWNER)
Alternative names: MCINTOSH SCHOOLS, WIN E MAC SCHOOL 2609
MAC COOP ASSN (325 CLEVELAND AVE SW in MCINTOSH, MN)
(Resource Conservation and Recovery Act (tracking hazardous waste))
KYLES RPR (325 CLEVELAND AVE B in MCINTOSH, MN)
(Resource Conservation and Recovery Act (tracking hazardous waste)) Alternative names: KYLES REPAIR
KYLES REPAIR (HWY 2 EAST in MCINTOSH, MN)
Conditionally Exempt Small Quantity Generators, less than 100 kg/month of hazardous waste (Resource Conservation and Recovery Act (tracking hazardous waste)) - notification Organizations: MANDT KYLE (CONTACT/OWNER)
KYLES RPR (1ST AND STATE ST in MCINTOSH, MN)
Conditionally Exempt Small Quantity Generators, less than 100 kg/month of hazardous waste (Resource Conservation and Recovery Act (tracking hazardous waste)) - notification Organizations: MANDT KYLE (CONTACT/OWNER)
Housing units lacking complete plumbing facilities: 1.7% Housing units lacking complete kitchen facilities: 3.0%
31.7%Bottled, tank, or LP gas
25.3%Electricity
21.3%Fuel oil, kerosene, etc.
11.1%No fuel used
5.7%Utility gas
3.2%Wood
2.6%Other fuel
Population in 1990: 1,088. Population change in the 1990s: +71 (+6.5%).
Place of birth for U.S.-born residents:
This state: 777
Northeast: 16
Midwest: 184
South: 108
West: 104
73% of the 56556 zip code residents lived in the same house 5 years ago. Out of people who lived in different houses, 61% lived in this county. Out of people who lived in different counties, 50% lived in Minnesota.
77% of the 56556 zip code residents lived in the same house 1 year ago. Out of people who lived in different houses, 21% moved from this county. Out of people who lived in different houses, 49% moved from different county within same state. Out of people who lived in different houses, 29% moved from different state. Out of people who lived in different houses, 2% moved from abroad.
Private vs. public school enrollment:
Students in private schools in grades 1 to 8 (elementary and middle school): 4
Here:
3.5%
Minnesota:
12.9%
Students in private schools in grades 9 to 12 (high school):
Here:
0.0%
Minnesota:
8.6%
Students in private undergraduate colleges:
Here:
0.0%
Minnesota:
26.2%
Occupation by median earnings in the past 12 months ($)
55,603Production occupations
54,675Management occupations
53,553Education, training, and library occupations
52,433Construction and extraction occupations
51,968Transportation occupations
51,187Business and financial operations occupations
Companies with federal contracts located in this zip code:
MCINTOSH NURSING HOME (700 N E RIV in MCINTOSH, MN) : $262,816 in 12 contractsfrom 1999 to 2003
Contracts for Nursing Home Care Contracts by Department of Veterans Affairs Signed by year:2000: $0; 2001: $67,000; 2002: $90,896; 2003: $103,920; 2004: $0; 2005: $0; 2006: $0.
Biggest contracts:
$42,761 with Department of Veterans Affairs for Nursing Home Care Contracts. Signed on 2003-07-15. Completion date: 2003-09-15.
$37,384, same as above.Signed on 2003-04-15. Completion date: 2003-06-15.
$25,000, same as above.Signed on 2001-10-15. Completion date: 2001-12-15.
$24,000, same as above.Signed on 2002-01-15. Completion date: 2002-03-15.
Top industries in this zip code by the number of employees in 2005:
Professional, Scientific, and Technical Services: Other Accounting Services (10-19 employees: 1 establishment)
Other Services (except Public Administration): Religious Organizations (5-9: 1, 1-4: 2)
Accommodation and Food Services: Full-Service Restaurants (5-9: 1)
Finance and Insurance: Commercial Banking (5-9: 1)
Accommodation and Food Services: Limited-Service Restaurants (5-9: 1)
People in group quarters in 2010:
37 people in nursing facilities/skilled-nursing facilities
10 people in group homes intended for adults
People in group quarters in 2000:
83 people in nursing homes
Fatal accident statistics in 2010:
Fatal accident count: 1
Vehicles involved in fatal accidents: 1
Fatal accidents caused by drunken drivers: 1
Fatalities: 1
Persons involved in fatal accidents: 1
Pedestrians involved in fatal accidents: 0
Home Mortgage Disclosure Act Aggregated Statistics For Year 2009 (Based on 2 partial tracts)
A) FHA, FSA/RHS & VA Home Purchase Loans
B) Conventional Home Purchase Loans
C) Refinancings
D) Home Improvement Loans
F) Non-occupant Loans on < 5 Family Dwellings (A B C & D)
G) Loans On Manufactured Home Dwelling (A B C & D)
Number
Average Value
Number
Average Value
Number
Average Value
Number
Average Value
Number
Average Value
Number
Average Value
LOANS ORIGINATED
1
$82,270
14
$125,270
46
$156,915
5
$35,150
20
$134,565
2
$71,050
APPLICATIONS APPROVED, NOT ACCEPTED
0
$0
1
$142,100
2
$122,600
1
$8,550
0
$0
1
$48,080
APPLICATIONS DENIED
0
$0
2
$77,995
9
$147,499
0
$0
1
$83,870
2
$75,320
APPLICATIONS WITHDRAWN
1
$95,620
1
$174,150
5
$135,794
1
$69,450
3
$197,653
1
$137,290
FILES CLOSED FOR INCOMPLETENESS
0
$0
0
$0
1
$44,870
0
$0
0
$0
0
$0
Aggregated Statistics For Year 2008 (Based on 2 partial tracts)
A) FHA, FSA/RHS & VA Home Purchase Loans
B) Conventional Home Purchase Loans
C) Refinancings
D) Home Improvement Loans
F) Non-occupant Loans on < 5 Family Dwellings (A B C & D)
G) Loans On Manufactured Home Dwelling (A B C & D)
Number
Average Value
Number
Average Value
Number
Average Value
Number
Average Value
Number
Average Value
Number
Average Value
LOANS ORIGINATED
2
$80,395
14
$126,376
28
$142,708
7
$56,777
13
$160,465
6
$99,540
APPLICATIONS APPROVED, NOT ACCEPTED
0
$0
1
$133,550
5
$99,896
0
$0
1
$179,490
1
$87,610
APPLICATIONS DENIED
0
$0
2
$87,610
14
$120,920
3
$45,050
1
$35,790
1
$30,980
APPLICATIONS WITHDRAWN
1
$13,360
1
$147,440
7
$139,884
1
$47,010
1
$185,900
0
$0
FILES CLOSED FOR INCOMPLETENESS
0
$0
1
$45,410
2
$94,820
0
$0
0
$0
0
$0
Aggregated Statistics For Year 2007 (Based on 2 partial tracts)
A) FHA, FSA/RHS & VA Home Purchase Loans
B) Conventional Home Purchase Loans
C) Refinancings
D) Home Improvement Loans
F) Non-occupant Loans on < 5 Family Dwellings (A B C & D)
G) Loans On Manufactured Home Dwelling (A B C & D)
Number
Average Value
Number
Average Value
Number
Average Value
Number
Average Value
Number
Average Value
Number
Average Value
LOANS ORIGINATED
1
$56,090
21
$119,584
38
$100,936
11
$80,178
15
$165,531
3
$78,527
APPLICATIONS APPROVED, NOT ACCEPTED
0
$0
2
$39,265
2
$146,640
1
$42,740
1
$32,050
1
$42,740
APPLICATIONS DENIED
0
$0
7
$95,546
10
$149,523
3
$39,353
2
$238,785
1
$8,010
APPLICATIONS WITHDRAWN
0
$0
5
$133,122
7
$132,329
1
$92,950
3
$230,240
1
$250,010
FILES CLOSED FOR INCOMPLETENESS
0
$0
1
$30,980
3
$130,343
1
$16,030
1
$30,980
1
$53,420
Aggregated Statistics For Year 2006 (Based on 2 partial tracts)
A) FHA, FSA/RHS & VA Home Purchase Loans
B) Conventional Home Purchase Loans
C) Refinancings
D) Home Improvement Loans
E) Loans on Dwellings For 5+ Families
F) Non-occupant Loans on < 5 Family Dwellings (A B C & D)
G) Loans On Manufactured Home Dwelling (A B C & D)
Number
Average Value
Number
Average Value
Number
Average Value
Number
Average Value
Number
Average Value
Number
Average Value
Number
Average Value
LOANS ORIGINATED
1
$63,040
19
$132,988
28
$115,483
10
$54,168
1
$93,480
17
$142,254
2
$44,605
APPLICATIONS APPROVED, NOT ACCEPTED
0
$0
3
$72,297
5
$94,554
2
$11,220
0
$0
0
$0
0
$0
APPLICATIONS DENIED
1
$14,420
6
$89,745
13
$113,332
5
$62,180
0
$0
2
$118,325
0
$0
APPLICATIONS WITHDRAWN
0
$0
4
$94,288
10
$121,050
1
$40,600
0
$0
2
$106,575
1
$71,050
FILES CLOSED FOR INCOMPLETENESS
0
$0
1
$11,220
2
$164,000
1
$6,410
0
$0
0
$0
0
$0
Aggregated Statistics For Year 2005 (Based on 2 partial tracts)
A) FHA, FSA/RHS & VA Home Purchase Loans
B) Conventional Home Purchase Loans
C) Refinancings
D) Home Improvement Loans
F) Non-occupant Loans on < 5 Family Dwellings (A B C & D)
G) Loans On Manufactured Home Dwelling (A B C & D)
Number
Average Value
Number
Average Value
Number
Average Value
Number
Average Value
Number
Average Value
Number
Average Value
LOANS ORIGINATED
1
$118,060
25
$96,754
36
$104,347
14
$57,198
13
$122,537
4
$53,288
APPLICATIONS APPROVED, NOT ACCEPTED
0
$0
3
$65,173
3
$71,403
2
$34,455
1
$34,720
0
$0
APPLICATIONS DENIED
0
$0
9
$56,150
21
$106,815
5
$38,142
1
$105,240
2
$57,425
APPLICATIONS WITHDRAWN
0
$0
4
$87,742
8
$104,169
2
$72,650
1
$64,100
0
$0
FILES CLOSED FOR INCOMPLETENESS
0
$0
5
$52,672
6
$155,630
1
$70,510
0
$0
0
$0
Aggregated Statistics For Year 2004 (Based on 2 partial tracts)
A) FHA, FSA/RHS & VA Home Purchase Loans
B) Conventional Home Purchase Loans
C) Refinancings
D) Home Improvement Loans
E) Loans on Dwellings For 5+ Families
F) Non-occupant Loans on < 5 Family Dwellings (A B C & D)
G) Loans On Manufactured Home Dwelling (A B C & D)
Number
Average Value
Number
Average Value
Number
Average Value
Number
Average Value
Number
Average Value
Number
Average Value
Number
Average Value
LOANS ORIGINATED
2
$55,025
27
$105,989
41
$104,169
7
$59,601
1
$3,210
15
$111,292
4
$51,015
APPLICATIONS APPROVED, NOT ACCEPTED
0
$0
4
$118,592
7
$105,543
1
$7,480
0
$0
1
$91,350
2
$89,480
APPLICATIONS DENIED
1
$33,120
12
$74,521
16
$94,620
2
$20,030
0
$0
2
$120,460
1
$68,380
APPLICATIONS WITHDRAWN
1
$61,430
2
$73,185
10
$77,566
0
$0
0
$0
1
$80,130
1
$61,970
FILES CLOSED FOR INCOMPLETENESS
0
$0
0
$0
3
$136,933
1
$30,980
0
$0
0
$0
0
$0
Aggregated Statistics For Year 2003 (Based on 2 partial tracts)
A) FHA, FSA/RHS & VA Home Purchase Loans
B) Conventional Home Purchase Loans
C) Refinancings
D) Home Improvement Loans
F) Non-occupant Loans on < 5 Family Dwellings (A B C & D)
Number
Average Value
Number
Average Value
Number
Average Value
Number
Average Value
Number
Average Value
LOANS ORIGINATED
1
$42,200
17
$92,196
61
$107,803
6
$26,977
17
$128,679
APPLICATIONS APPROVED, NOT ACCEPTED
0
$0
1
$97,220
3
$100,607
1
$33,120
1
$97,220
APPLICATIONS DENIED
0
$0
3
$121,797
14
$70,858
1
$3,740
1
$133,550
APPLICATIONS WITHDRAWN
0
$0
4
$108,710
10
$97,865
1
$13,890
2
$198,720
FILES CLOSED FOR INCOMPLETENESS
0
$0
1
$48,080
2
$158,925
1
$24,040
0
$0
Aggregated Statistics For Year 2002 (Based on 2 partial tracts)
A) FHA, FSA/RHS & VA Home Purchase Loans
B) Conventional Home Purchase Loans
C) Refinancings
D) Home Improvement Loans
E) Loans on Dwellings For 5+ Families
F) Non-occupant Loans on < 5 Family Dwellings (A B C & D)
Number
Average Value
Number
Average Value
Number
Average Value
Number
Average Value
Number
Average Value
Number
Average Value
LOANS ORIGINATED
1
$68,910
20
$86,166
44
$98,014
4
$19,498
1
$23,500
13
$94,142
APPLICATIONS APPROVED, NOT ACCEPTED
0
$0
0
$0
3
$67,130
0
$0
0
$0
0
$0
APPLICATIONS DENIED
1
$25,640
5
$66,882
10
$73,025
1
$82,800
0
$0
2
$63,570
APPLICATIONS WITHDRAWN
0
$0
3
$59,473
9
$99,539
1
$84,400
0
$0
1
$60,900
FILES CLOSED FOR INCOMPLETENESS
0
$0
0
$0
3
$66,953
0
$0
0
$0
0
$0
Aggregated Statistics For Year 2001 (Based on 2 partial tracts)
A) FHA, FSA/RHS & VA Home Purchase Loans
B) Conventional Home Purchase Loans
C) Refinancings
D) Home Improvement Loans
F) Non-occupant Loans on < 5 Family Dwellings (A B C & D)
Number
Average Value
Number
Average Value
Number
Average Value
Number
Average Value
Number
Average Value
LOANS ORIGINATED
1
$56,090
19
$72,286
34
$94,082
3
$10,150
12
$82,712
APPLICATIONS APPROVED, NOT ACCEPTED
0
$0
2
$35,255
3
$62,323
0
$0
0
$0
APPLICATIONS DENIED
0
$0
4
$57,960
11
$81,538
0
$0
0
$0
APPLICATIONS WITHDRAWN
0
$0
2
$94,820
4
$74,120
1
$9,620
0
$0
FILES CLOSED FOR INCOMPLETENESS
0
$0
0
$0
2
$56,890
0
$0
0
$0
Aggregated Statistics For Year 2000 (Based on 2 partial tracts)
A) FHA, FSA/RHS & VA Home Purchase Loans
B) Conventional Home Purchase Loans
C) Refinancings
D) Home Improvement Loans
F) Non-occupant Loans on < 5 Family Dwellings (A B C & D)
Number
Average Value
Number
Average Value
Number
Average Value
Number
Average Value
Number
Average Value
LOANS ORIGINATED
1
$18,160
8
$64,705
15
$70,265
5
$27,778
5
$36,112
APPLICATIONS APPROVED, NOT ACCEPTED
0
$0
4
$63,970
5
$47,010
1
$6,410
1
$74,790
APPLICATIONS DENIED
0
$0
7
$48,841
7
$54,336
2
$30,180
2
$27,510
APPLICATIONS WITHDRAWN
1
$36,330
1
$49,680
3
$88,677
1
$5,340
0
$0
FILES CLOSED FOR INCOMPLETENESS
0
$0
0
$0
1
$46,480
0
$0
0
$0
Aggregated Statistics For Year 1999 (Based on 1 partial tract)
A) FHA, FSA/RHS & VA Home Purchase Loans
B) Conventional Home Purchase Loans
C) Refinancings
D) Home Improvement Loans
F) Non-occupant Loans on < 5 Family Dwellings (A B C & D)
Detailed PMIC statistics for the following Tracts:0209.00
2002 - 2018 National Fire Incident Reporting System (NFIRS) incidents
Based on the data from the years 2002 - 2018 the average number of fires per year is 10. The highest number of reported fires - 21 took place in 2015, and the least - 5 in 2016. The data has a dropping trend.
When looking into fire subcategories, the most incidents belonged to: Outside Fires (61.2%), and Structure Fires (22.9%).
Fire incident types reported to NFIRS in Zip Code 56556

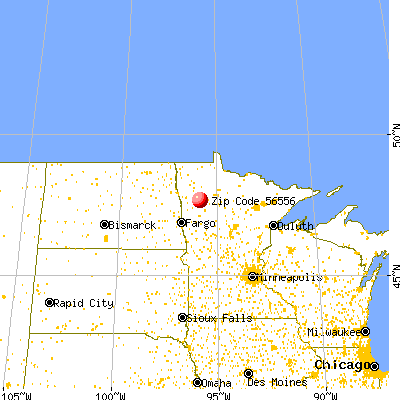


 Nearest zip codes: 56715, 56535, 56592, 56542, 56516, 56684.


 Based on the data from the years 2002 - 2018 the average number of fires per year is 10. The highest number of reported fires - 21 took place in 2015, and the least - 5 in 2016. The data has a dropping trend.
 When looking into fire subcategories, the most incidents belonged to: Outside Fires (61.2%), and Structure Fires (22.9%).