Estimated zip code population in 2022: 396 Zip code population in 2010: 539 Zip code population in 2000: 575
Houses and condos: 176 Renter-occupied apartments: 30
% of renters here:
19%
State:
28%
March 2022 cost of living index in zip code 56523: 85.1 (less than average, U.S. average is 100)
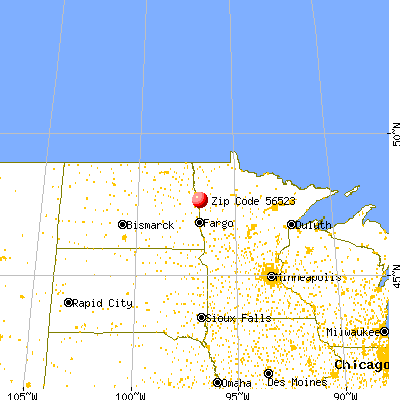
Land area: 83.0 sq. mi. Water area: 0.0 sq. mi.
Population density: 5 people per square mile
(very low).
OSM Map
General Map
Google Map
MSN Map
OSM Map
General Map
Google Map
MSN Map
OSM Map
General Map
Google Map
MSN Map
OSM Map
General Map
Google Map
MSN Map
Please wait while loading the map...
Real estate property taxes paid for housing units in 2022:
This zip code:
1.0% ($1,661)
Minnesota:
1.0% ($3,087)
Median real estate property taxes paid for housing units with mortgages in 2022: $1,580 (0.8%) Median real estate property taxes paid for housing units with no mortgage in 2022: $1,805 (1.5%)
Business Search- 14 Million verified businesses
Males: 212
(53.7%)
Females: 183
(46.3%)
For population 25 years and over in 56523:
High school or higher: 93.7%
Bachelor's degree or higher: 34.9%
Graduate or professional degree: 6.1%
Unemployed: 2.4%
Mean travel time to work (commute): 20.1 minutes
For population 15 years and over in 56523:
Never married: 30.2%
Now married: 55.9%
Separated: 0.8%
Widowed: 2.1%
Divorced: 10.9%
Zip code 56523 compared to state average:
Median house value below state average.
Black race population percentage significantly below state average.
Foreign-born population percentage significantly below state average.
Length of stay since moving in significantly above state average.
Estimated median house/condo value in 2022: $170,024
56523:
$170,024
Minnesota:
$314,600
Median resident age:
This zip code:
42.0 years
Minnesota median age:
39.0 years
Average household size:
This zip code:
2.5 people
Minnesota:
2.4 people
Averages for the 2020 tax year for zip code 56523, filed in 2021:
Average Adjusted Gross Income (AGI) in 2020: $62,852 (Individual Income Tax Returns)
Here:
$62,852
State:
$82,178
Salary/wage: $39,595 (reported on 87.0% of returns)
Here:
$39,595
State:
$67,438
(% of AGI for various income ranges: 1328.0% for AGIs below $25k, 4873.3% for AGIs $25k-50k, 6154.0% for AGIs $50k-75k)
Taxable interest for individuals: $550 (reported on 17.4% of returns)
This zip code:
$550
Minnesota:
$1,814
(% of AGI for various income ranges: 12.0% for AGIs below $25k)
Ordinary dividends: $700 (reported on 13.0% of returns)
Here:
$700
State:
$6,928
(% of AGI for various income ranges: 42.0% for AGIs $50k-75k)
Net capital gain/loss in AGI: +$1,033 (reported on 13.0% of returns)
Here:
+$1,033
State:
+$20,591
(% of AGI for various income ranges: 62.0% for AGIs $50k-75k)
Profit/loss from business: +$4,000 (reported on 13.0% of returns)
Here:
+$4,000
State:
+$14,342
(% of AGI for various income ranges: 240.0% for AGIs below $25k)
Earned income credit: $1,300 (reported on 17.4% of returns)
Here:
$1,300
State:
$2,055
(% of AGI for various income ranges: 104.0% for AGIs below $25k)
Percentage of individuals using paid preparers for their 2020 taxes: 95.7%
Here:
96%
State:
94%
(% for various income ranges: 100.0% for AGIs below $25k, 100.0% for AGIs $25k-50k, 85.7% for AGIs $50k-75k, 100.0% for AGIs $100k-200k)
Averages for the 2012 tax year for zip code 56523, filed in 2013:
Average Adjusted Gross Income (AGI) in 2012: $55,367 (Individual Income Tax Returns)
Here:
$55,367
State:
$67,192
Salary/wage: $34,114 (reported on 87.5% of returns)
Here:
$34,114
State:
$55,182
(% of AGI for various income ranges: 75.2% for AGIs below $25k, 82.1% for AGIs $25k-50k, 117.1% for AGIs $50k-75k, 26.7% for AGIs $100k-200k)
Taxable interest for individuals: $411 (reported on 37.5% of returns)
This zip code:
$411
Minnesota:
$1,664
(% of AGI for various income ranges: 0.4% for AGIs below $25k, 0.4% for AGIs $50k-75k, 0.4% for AGIs $100k-200k)
Ordinary dividends: $15,600 (reported on 8.3% of returns)
Here:
$15,600
State:
$5,665
Profit/loss from business: +$6,000 (reported on 12.5% of returns)
Here:
+$6,000
State:
+$12,430
Total itemized deductions: $19,180 (17% of AGI, reported on 20.8% of returns)
Here:
$19,180
State:
$24,665
Here:
16.5% of AGI
State:
19.6% of AGI
(% of AGI for various income ranges: 15.5% for AGIs $25k-50k, 10.5% for AGIs $100k-200k)
Charity contributions: $2,100 (reported on 12.5% of returns)
Here:
$2,100
State:
$3,948
Taxes paid: $9,200 (reported on 20.8% of returns)
56523:
$9,200
State:
$10,589
(% of AGI for various income ranges: 5.6% for AGIs $25k-50k, 5.9% for AGIs $100k-200k)
Earned income credit: $2,080 (reported on 20.8% of returns)
Here:
$2,080
State:
$2,037
(% of AGI for various income ranges: 5.1% for AGIs below $25k, 2.1% for AGIs $25k-50k)
Percentage of individuals using paid preparers for their 2012 taxes: 75.0%
Here:
75%
State:
55%
(% for various income ranges: 75.0% for AGIs below $25k, 57.1% for AGIs $25k-50k, 125.0% for AGIs $50k-75k, 100.0% for AGIs $100k-200k)
Averages for the 2004 tax year for zip code 56523, filed in 2005:
Average Adjusted Gross Income (AGI) in 2004: $33,799 (Individual Income Tax Returns)
Here:
$33,799
State:
$53,560
Salary/wage: $27,231 (reported on 85.2% of returns)
Here:
$27,231
State:
$46,177
(% of AGI for various income ranges: 88.6% for AGIs below $10k, 72.2% for AGIs $10k-25k, 71.2% for AGIs $25k-50k, 74.6% for AGIs $50k-75k, 53.1% for AGIs $75k-100k)
Taxable interest for individuals: $747 (reported on 40.6% of returns)
This zip code:
$747
Minnesota:
$1,796
Taxable dividends: $226 (reported on 12.7% of returns)
Here:
$226
State:
$3,096
Profit/loss from business: +$4,884 (reported on 17.6% of returns)
Here:
+$4,884
State:
+$10,442
Total itemized deductions: $15,383 (27% of AGI, reported on 19.3% of returns)
Here:
$15,383
State:
$20,035
Here:
27.3% of AGI
State:
21.3% of AGI
Charity contributions deductions: $1,658 (3% of AGI, reported on 15.6% of returns)
Here:
$1,658
State:
$3,333
Here:
2.9% of AGI
State:
3.4% of AGI
Total tax: $3,599 (reported on 76.6% of returns)
56523:
$3,599
State:
$8,485
(% of AGI for various income ranges: 1.7% for AGIs below $10k, 4.8% for AGIs $10k-25k, 6.6% for AGIs $25k-50k, 8.4% for AGIs $50k-75k, 13.5% for AGIs $75k-100k)
Earned income credit: $1,684 (reported on 15.6% of returns)
Here:
$1,684
State:
$1,523
Percentage of individuals using paid preparers for their 2004 taxes: 69.7%
Here:
70%
State:
59%
(% for various income ranges: 59.0% for AGIs below $10k, 67.6% for AGIs $10k-25k, 75.3% for AGIs $25k-50k, 65.7% for AGIs $50k-75k, 82.4% for AGIs $75k-100k)
Household received Food Stamps/SNAP in the past 12 months: 17 Household did not receive Food Stamps/SNAP in the past 12 months: 144
Women who had a birth in the past 12 months: 5 (5 now married, 0 unmarried) Women who did not have a birth in the past 12 months: 78 (27 now married, 51 unmarried)
Housing units in zip code 56523 with a mortgage: 68 (13 second mortgage, 13 both second mortgage and home equity loan) Median monthly owner costs for units with a mortgage: $1,300 Median monthly owner costs for units without a mortgage: $582
Residents with income below the poverty level in 2022:
This zip code:
6.8%
Whole state:
9.6%
Residents with income below 50% of the poverty level in 2022:
This zip code:
4.4%
Whole state:
5.2%
Median number of rooms in houses and condos:
Here:
6.7
State:
7.1
Median number of rooms in apartments:
Here:
4.8
State:
3.8
Notable locations in this zip code not listed on our city pages
Notable locations in zip code 56523: Eldred (A), Climax Municipal Golf Course (B), Climax Volunteer Fire Department (C). Display/hide their locations on the map
Size of family households: 57 2-persons, 24 3-persons, 24 4-persons, 10 5-persons, 1 7-or-more-persons
Size of nonfamily households: 35 1-person, 6 2-persons
73 married couples with children.
30 single-parent households (6 men, 24 women).
97.8% of residents of 56523 zip code speak English at home.
1.9% of residents speak Spanish at home (57% very well, 43% well).
Foreign born population: 9 (2.3%) (23.2% of them are naturalized citizens)
This zip code:
2.3%
Whole state:
8.7%
33%Serbia
11%Honduras
47%Norwegian
13%German
12%Scandinavian
4%Polish
3%Irish
2%Icelander
2%Ukrainian
Year of entry for the foreign-born population
82010 or later
02000 to 2009
11990 to 1999
1Before 1990
Facilities with environmental interests located in this zip code:
FARMERS UNION OIL (206 W BROADWAY in CLIMAX, MN)
STATE MASTER (Minnesota Pollution Control Agency permits and compilance tracking) - RCRAINFO-MND985697622, CESQG, RCRIS-MND985697622, Conditionally Exempt Small Quantity Generators, less than 100 kg/month of hazardous waste (Resource Conservation and Recovery Act (tracking hazardous waste)) - notification Business SIC and NAICS classification: PETROLEUM BULK STATIONS AND TERMINALS Organizations: BURNER BOB (CONTACT/OWNER)
, FARMERS UNION OIL CO (CONTACT/OWNER)
Alternative names: FARMERS UNION OIL CO - CLIMAX
FARMERS ELEVATOR - ELDRED (HIGHWAY 75 in NOT IN A CITY, MN)
AIR MINOR (AIRS/AFS) Business SIC classification: GRAIN AND FIELD BEANS Alternative names: FARMERS ELEV - ELDRED
Housing units lacking complete plumbing facilities: 2.1% Housing units lacking complete kitchen facilities: 2.2%
49.5%Bottled, tank, or LP gas
30.9%Electricity
12.2%Fuel oil, kerosene, etc.
8.4%Wood
Population in 1990: 731.
Place of birth for U.S.-born residents:
This state: 198
Northeast: 2
Midwest: 150
South: 26
West: 7
68% of the 56523 zip code residents lived in the same house 5 years ago. Out of people who lived in different houses, 55% lived in this county. Out of people who lived in different counties, 50% lived in Minnesota.
95% of the 56523 zip code residents lived in the same house 1 year ago. Out of people who lived in different houses, 29% moved from this county. Out of people who lived in different houses, 21% moved from different county within same state. Out of people who lived in different houses, 57% moved from different state.
Private vs. public school enrollment:
Students in private schools in grades 1 to 8 (elementary and middle school): 3
Here:
8.8%
Minnesota:
12.9%
Students in private schools in grades 9 to 12 (high school):
Here:
0.0%
Minnesota:
8.6%
Students in private undergraduate colleges:
Here:
0.0%
Minnesota:
26.2%
Occupation by median earnings in the past 12 months ($)
88,461Installation, maintenance, and repair occupations
74,906Architecture and engineering occupations
62,662Management occupations
50,267Business and financial operations occupations
48,885Transportation occupations
46,918Health technologists and technicians
Companies with federal contracts located in this zip code:
A & S (LLC) (38948 350TH ST SW in CLIMAX, MN) : $1,607,812 in 18 contractsfrom 2003 to 2004
Contracts for Construction of Structures and Facilities -- Other Non-Building Facilities by Army, U.S. Army Corps of Engineers - civil program financing only Signed by year:2000: $0; 2001: $0; 2002: $0; 2003: $253,890; 2004: $1,353,922; 2005: $0; 2006: $0.
Biggest contracts:
$350,000 with Army for Construction of Structures and Facilities -- Other Non-Building Facilities. Taking place in ND. Signed on 2004-07-30. Completion date: 2006-06-25.
$350,000 with U.S. Army Corps of Engineers - civil program financing only for Construction of Structures and Facilities -- Other Non-Building Facilities. Taking place in ND. Signed on 2004-07-30. Completion date: 2006-06-25.
$178,100 with Army for Construction of Structures and Facilities -- Other Non-Building Facilities. Taking place in ND. Signed on 2004-10-27. Completion date: 2006-06-25.
$178,100 with U.S. Army Corps of Engineers - civil program financing only for Construction of Structures and Facilities -- Other Non-Building Facilities. Taking place in ND. Signed on 2004-10-27. Completion date: 2006-06-25.
Top industries in this zip code by the number of employees in 2005:
Wholesale Trade: Grain and Field Bean Merchant Wholesalers (5-9 employees: 1 establishment, 1-4 employees: 1 establishment)
Accommodation and Food Services: Full-Service Restaurants (5-9: 1)
Construction: Poured Concrete Foundation and Structure Contractors (5-9: 1)
Other Services (except Public Administration): Religious Organizations (1-4: 2)
Arts, Entertainment, and Recreation: Golf Courses and Country Clubs (1-4: 1)
Real Estate and Rental and Leasing: Home Health Equipment Rental (1-4: 1)
Finance and Insurance: Direct Property and Casualty Insurance Carriers (1-4: 1)
Construction: Tile and Terrazzo Contractors (1-4: 1)
Home Mortgage Disclosure Act Aggregated Statistics For Year 2009 (Based on 2 partial tracts)
A) FHA, FSA/RHS & VA Home Purchase Loans
B) Conventional Home Purchase Loans
C) Refinancings
D) Home Improvement Loans
F) Non-occupant Loans on < 5 Family Dwellings (A B C & D)
Number
Average Value
Number
Average Value
Number
Average Value
Number
Average Value
Number
Average Value
LOANS ORIGINATED
2
$114,055
9
$95,307
17
$105,094
2
$42,380
1
$66,010
APPLICATIONS APPROVED, NOT ACCEPTED
1
$80,460
0
$0
0
$0
0
$0
0
$0
APPLICATIONS DENIED
0
$0
0
$0
4
$107,902
1
$19,530
0
$0
APPLICATIONS WITHDRAWN
1
$138,270
0
$0
0
$0
0
$0
0
$0
FILES CLOSED FOR INCOMPLETENESS
0
$0
0
$0
0
$0
0
$0
0
$0
Aggregated Statistics For Year 2008 (Based on 2 partial tracts)
A) FHA, FSA/RHS & VA Home Purchase Loans
B) Conventional Home Purchase Loans
C) Refinancings
D) Home Improvement Loans
F) Non-occupant Loans on < 5 Family Dwellings (A B C & D)
G) Loans On Manufactured Home Dwelling (A B C & D)
Number
Average Value
Number
Average Value
Number
Average Value
Number
Average Value
Number
Average Value
Number
Average Value
LOANS ORIGINATED
2
$92,180
4
$51,755
11
$78,653
5
$37,732
1
$34,370
1
$30,080
APPLICATIONS APPROVED, NOT ACCEPTED
0
$0
0
$0
1
$27,730
0
$0
0
$0
0
$0
APPLICATIONS DENIED
0
$0
1
$36,720
2
$34,765
0
$0
0
$0
0
$0
APPLICATIONS WITHDRAWN
0
$0
0
$0
2
$62,105
0
$0
0
$0
0
$0
FILES CLOSED FOR INCOMPLETENESS
0
$0
0
$0
0
$0
0
$0
0
$0
0
$0
Aggregated Statistics For Year 2007 (Based on 2 partial tracts)
A) FHA, FSA/RHS & VA Home Purchase Loans
B) Conventional Home Purchase Loans
C) Refinancings
D) Home Improvement Loans
G) Loans On Manufactured Home Dwelling (A B C & D)
Number
Average Value
Number
Average Value
Number
Average Value
Number
Average Value
Number
Average Value
LOANS ORIGINATED
1
$76,950
4
$82,808
12
$81,375
5
$22,812
0
$0
APPLICATIONS APPROVED, NOT ACCEPTED
0
$0
0
$0
0
$0
1
$26,170
0
$0
APPLICATIONS DENIED
0
$0
3
$54,423
5
$92,572
2
$50,780
1
$63,670
APPLICATIONS WITHDRAWN
0
$0
0
$0
3
$72,260
0
$0
0
$0
FILES CLOSED FOR INCOMPLETENESS
0
$0
0
$0
1
$42,580
0
$0
0
$0
Aggregated Statistics For Year 2006 (Based on 2 partial tracts)
A) FHA, FSA/RHS & VA Home Purchase Loans
B) Conventional Home Purchase Loans
C) Refinancings
D) Home Improvement Loans
F) Non-occupant Loans on < 5 Family Dwellings (A B C & D)
Number
Average Value
Number
Average Value
Number
Average Value
Number
Average Value
Number
Average Value
LOANS ORIGINATED
2
$82,220
6
$94,265
15
$75,594
7
$35,656
1
$76,950
APPLICATIONS APPROVED, NOT ACCEPTED
0
$0
0
$0
2
$95,305
0
$0
0
$0
APPLICATIONS DENIED
0
$0
2
$73,040
10
$83,745
1
$50,780
0
$0
APPLICATIONS WITHDRAWN
0
$0
0
$0
4
$98,430
0
$0
0
$0
FILES CLOSED FOR INCOMPLETENESS
0
$0
0
$0
1
$59,760
0
$0
0
$0
Aggregated Statistics For Year 2005 (Based on 2 partial tracts)
A) FHA, FSA/RHS & VA Home Purchase Loans
B) Conventional Home Purchase Loans
C) Refinancings
D) Home Improvement Loans
F) Non-occupant Loans on < 5 Family Dwellings (A B C & D)
G) Loans On Manufactured Home Dwelling (A B C & D)
Number
Average Value
Number
Average Value
Number
Average Value
Number
Average Value
Number
Average Value
Number
Average Value
LOANS ORIGINATED
1
$45,700
9
$88,667
12
$74,117
7
$20,646
1
$20,700
0
$0
APPLICATIONS APPROVED, NOT ACCEPTED
0
$0
1
$26,170
0
$0
0
$0
0
$0
0
$0
APPLICATIONS DENIED
0
$0
2
$98,820
6
$64,840
3
$33,590
0
$0
1
$36,720
APPLICATIONS WITHDRAWN
0
$0
0
$0
3
$65,620
1
$25,780
0
$0
0
$0
FILES CLOSED FOR INCOMPLETENESS
0
$0
0
$0
1
$104,680
0
$0
0
$0
0
$0
Aggregated Statistics For Year 2004 (Based on 2 partial tracts)
A) FHA, FSA/RHS & VA Home Purchase Loans
B) Conventional Home Purchase Loans
C) Refinancings
D) Home Improvement Loans
F) Non-occupant Loans on < 5 Family Dwellings (A B C & D)
G) Loans On Manufactured Home Dwelling (A B C & D)
Number
Average Value
Number
Average Value
Number
Average Value
Number
Average Value
Number
Average Value
Number
Average Value
LOANS ORIGINATED
1
$67,570
7
$76,501
16
$76,972
6
$29,750
2
$61,910
1
$52,340
APPLICATIONS APPROVED, NOT ACCEPTED
0
$0
0
$0
2
$83,785
0
$0
0
$0
0
$0
APPLICATIONS DENIED
1
$42,180
1
$55,470
4
$89,740
1
$67,570
0
$0
1
$79,680
APPLICATIONS WITHDRAWN
0
$0
1
$112,490
3
$82,417
1
$16,800
0
$0
0
$0
FILES CLOSED FOR INCOMPLETENESS
0
$0
0
$0
1
$54,680
0
$0
0
$0
0
$0
Aggregated Statistics For Year 2003 (Based on 2 partial tracts)
A) FHA, FSA/RHS & VA Home Purchase Loans
B) Conventional Home Purchase Loans
C) Refinancings
D) Home Improvement Loans
Number
Average Value
Number
Average Value
Number
Average Value
Number
Average Value
LOANS ORIGINATED
1
$63,280
9
$70,308
30
$73,146
2
$26,365
APPLICATIONS APPROVED, NOT ACCEPTED
0
$0
0
$0
1
$82,810
0
$0
APPLICATIONS DENIED
0
$0
0
$0
8
$73,530
0
$0
APPLICATIONS WITHDRAWN
1
$78,900
1
$81,240
1
$108,200
0
$0
FILES CLOSED FOR INCOMPLETENESS
0
$0
0
$0
1
$141,010
0
$0
Aggregated Statistics For Year 2002 (Based on 2 partial tracts)
A) FHA, FSA/RHS & VA Home Purchase Loans
B) Conventional Home Purchase Loans
C) Refinancings
D) Home Improvement Loans
F) Non-occupant Loans on < 5 Family Dwellings (A B C & D)
Number
Average Value
Number
Average Value
Number
Average Value
Number
Average Value
Number
Average Value
LOANS ORIGINATED
3
$74,997
7
$70,309
22
$66,509
4
$44,528
1
$64,840
APPLICATIONS APPROVED, NOT ACCEPTED
0
$0
1
$74,210
1
$53,510
0
$0
0
$0
APPLICATIONS DENIED
1
$78,120
2
$72,845
1
$53,120
1
$12,890
0
$0
APPLICATIONS WITHDRAWN
0
$0
1
$66,400
2
$60,935
0
$0
0
$0
FILES CLOSED FOR INCOMPLETENESS
0
$0
0
$0
1
$66,400
0
$0
0
$0
Aggregated Statistics For Year 2001 (Based on 2 partial tracts)
A) FHA, FSA/RHS & VA Home Purchase Loans
B) Conventional Home Purchase Loans
C) Refinancings
D) Home Improvement Loans
F) Non-occupant Loans on < 5 Family Dwellings (A B C & D)
Number
Average Value
Number
Average Value
Number
Average Value
Number
Average Value
Number
Average Value
LOANS ORIGINATED
1
$87,490
4
$55,172
14
$61,408
1
$9,770
1
$30,860
APPLICATIONS APPROVED, NOT ACCEPTED
0
$0
1
$142,570
0
$0
0
$0
0
$0
APPLICATIONS DENIED
0
$0
1
$63,280
4
$48,630
1
$28,900
0
$0
APPLICATIONS WITHDRAWN
0
$0
0
$0
3
$71,740
0
$0
0
$0
FILES CLOSED FOR INCOMPLETENESS
0
$0
0
$0
0
$0
0
$0
0
$0
Aggregated Statistics For Year 2000 (Based on 2 partial tracts)
A) FHA, FSA/RHS & VA Home Purchase Loans
B) Conventional Home Purchase Loans
C) Refinancings
D) Home Improvement Loans
F) Non-occupant Loans on < 5 Family Dwellings (A B C & D)
Number
Average Value
Number
Average Value
Number
Average Value
Number
Average Value
Number
Average Value
LOANS ORIGINATED
2
$47,655
7
$47,263
7
$48,601
3
$11,067
1
$19,140
APPLICATIONS APPROVED, NOT ACCEPTED
0
$0
0
$0
2
$39,255
0
$0
0
$0
APPLICATIONS DENIED
0
$0
1
$60,540
4
$33,398
1
$11,720
0
$0
APPLICATIONS WITHDRAWN
0
$0
1
$71,870
2
$55,075
0
$0
0
$0
FILES CLOSED FOR INCOMPLETENESS
0
$0
0
$0
0
$0
0
$0
0
$0
Aggregated Statistics For Year 1999 (Based on 1 partial tract)


 Nearest zip codes: 56568, 56723, 58219, 56581, 58218, 58223.


