Estimated zip code population in 2022: 1,904 Zip code population in 2010: 1,591 Zip code population in 2000: 1,534
Houses and condos: 1,055 Renter-occupied apartments: 117
% of renters here:
16%
State:
28%
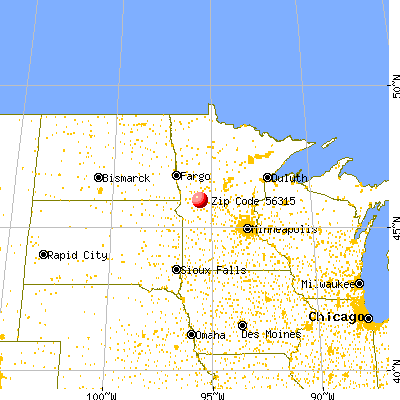
March 2022 cost of living index in zip code 56315: 86.5 (less than average, U.S. average is 100)
Land area: 69.6 sq. mi. Water area: 8.9 sq. mi.
Population density: 27 people per square mile
(very low).
OSM Map
General Map
Google Map
MSN Map
OSM Map
General Map
Google Map
MSN Map
OSM Map
General Map
Google Map
MSN Map
OSM Map
General Map
Google Map
MSN Map
Please wait while loading the map...
Real estate property taxes paid for housing units in 2022:
This zip code:
0.9% ($2,107)
Minnesota:
1.0% ($3,087)
Median real estate property taxes paid for housing units with mortgages in 2022: $2,056 (0.8%) Median real estate property taxes paid for housing units with no mortgage in 2022: $2,197 (0.9%)
Estimated median house/condo value in 2022: $246,590
56315:
$246,590
Minnesota:
$314,600
Median resident age:
This zip code:
41.0 years
Minnesota median age:
39.0 years
Average household size:
This zip code:
2.6 people
Minnesota:
2.4 people
Averages for the 2020 tax year for zip code 56315, filed in 2021:
Average Adjusted Gross Income (AGI) in 2020: $71,706 (Individual Income Tax Returns)
Here:
$71,706
State:
$82,178
Salary/wage: $55,097 (reported on 80.0% of returns)
Here:
$55,097
State:
$67,438
(% of AGI for various income ranges: 1232.7% for AGIs below $25k, 3656.9% for AGIs $25k-50k, 6782.5% for AGIs $50k-75k, 10038.3% for AGIs $75k-100k, 17903.8% for AGIs $100k-200k)
Taxable interest for individuals: $1,244 (reported on 33.8% of returns)
This zip code:
$1,244
Minnesota:
$1,814
(% of AGI for various income ranges: 6.4% for AGIs below $25k, 30.8% for AGIs $25k-50k, 82.5% for AGIs $50k-75k, 51.7% for AGIs $75k-100k, 240.0% for AGIs $100k-200k)
Ordinary dividends: $3,279 (reported on 23.8% of returns)
Here:
$3,279
State:
$6,928
(% of AGI for various income ranges: 16.4% for AGIs below $25k, 73.8% for AGIs $25k-50k, 125.0% for AGIs $50k-75k, 148.3% for AGIs $75k-100k, 400.0% for AGIs $100k-200k)
Net capital gain/loss in AGI: +$8,782 (reported on 21.2% of returns)
Here:
+$8,782
State:
+$20,591
(% of AGI for various income ranges: 63.8% for AGIs $25k-50k, 313.8% for AGIs $50k-75k, 373.3% for AGIs $75k-100k, 1187.5% for AGIs $100k-200k)
Profit/loss from business: +$20,277 (reported on 16.2% of returns)
Here:
+$20,277
State:
+$14,342
(% of AGI for various income ranges: 160.9% for AGIs below $25k, 276.2% for AGIs $25k-50k, 495.0% for AGIs $50k-75k, 115.0% for AGIs $75k-100k, 2043.8% for AGIs $100k-200k)
Taxable individual retirement arrangement distribution: $18,092 (reported on 15.0% of returns)
56315:
$18,092
Minnesota:
$20,675
(% of AGI for various income ranges: 280.0% for AGIs $25k-50k, 1191.2% for AGIs $50k-75k, 1067.5% for AGIs $100k-200k)
Total itemized deductions: $33,850 (reported on 5.0% of returns)
Here:
$33,850
State:
$33,311
(% of AGI for various income ranges: 344.6% for AGIs $25k-50k, 1132.5% for AGIs $100k-200k)
Charity contributions: $6,525 (reported on 5.0% of returns)
Here:
$6,525
State:
$11,879
(% of AGI for various income ranges: 326.2% for AGIs $100k-200k)
Taxes paid: $9,175 (reported on 5.0% of returns)
56315:
$9,175
State:
$8,252
(% of AGI for various income ranges: 101.5% for AGIs $25k-50k, 293.8% for AGIs $100k-200k)
Earned income credit: $1,833 (reported on 11.2% of returns)
Here:
$1,833
State:
$2,055
(% of AGI for various income ranges: 70.9% for AGIs below $25k, 66.9% for AGIs $25k-50k)
Percentage of individuals using paid preparers for their 2020 taxes: 96.2%
Here:
96%
State:
94%
(% for various income ranges: 95.0% for AGIs below $25k, 94.4% for AGIs $25k-50k, 100.0% for AGIs $50k-75k, 100.0% for AGIs $75k-100k, 93.3% for AGIs $100k-200k, 100.0% for AGIs over 200k)
Averages for the 2012 tax year for zip code 56315, filed in 2013:
Average Adjusted Gross Income (AGI) in 2012: $56,534 (Individual Income Tax Returns)
Here:
$56,534
State:
$67,192
Salary/wage: $40,156 (reported on 81.8% of returns)
Here:
$40,156
State:
$55,182
(% of AGI for various income ranges: 69.7% for AGIs below $25k, 72.4% for AGIs $25k-50k, 65.8% for AGIs $50k-75k, 64.3% for AGIs $75k-100k, 44.8% for AGIs $100k-200k)
Taxable interest for individuals: $1,728 (reported on 37.7% of returns)
This zip code:
$1,728
Minnesota:
$1,664
(% of AGI for various income ranges: 1.5% for AGIs below $25k, 0.6% for AGIs $25k-50k, 1.0% for AGIs $50k-75k, 1.3% for AGIs $75k-100k, 1.3% for AGIs $100k-200k)
Ordinary dividends: $1,621 (reported on 24.7% of returns)
Here:
$1,621
State:
$5,665
(% of AGI for various income ranges: 1.3% for AGIs below $25k, 0.6% for AGIs $25k-50k, 0.9% for AGIs $50k-75k, 0.2% for AGIs $75k-100k, 0.8% for AGIs $100k-200k)
Net capital gain/loss in AGI: +$6,788 (reported on 20.8% of returns)
Here:
+$6,788
State:
+$16,131
(% of AGI for various income ranges: 0.3% for AGIs below $25k, 2.4% for AGIs $50k-75k, 3.2% for AGIs $75k-100k, 3.6% for AGIs $100k-200k)
Profit/loss from business: +$9,729 (reported on 18.2% of returns)
Here:
+$9,729
State:
+$12,430
(% of AGI for various income ranges: 7.9% for AGIs below $25k, 8.0% for AGIs $25k-50k, 3.2% for AGIs $50k-75k, 4.1% for AGIs $75k-100k)
Taxable individual retirement arrangement distribution: $10,900 (reported on 14.3% of returns)
56315:
$10,900
Minnesota:
$15,212
(% of AGI for various income ranges: 4.6% for AGIs below $25k, 3.2% for AGIs $25k-50k, 3.6% for AGIs $50k-75k, 7.5% for AGIs $75k-100k)
Total itemized deductions: $21,329 (20% of AGI, reported on 31.2% of returns)
Here:
$21,329
State:
$24,665
Here:
20.1% of AGI
State:
19.6% of AGI
(% of AGI for various income ranges: 10.7% for AGIs below $25k, 11.1% for AGIs $25k-50k, 10.0% for AGIs $50k-75k, 10.2% for AGIs $75k-100k, 13.6% for AGIs $100k-200k)
Charity contributions: $2,885 (reported on 26.0% of returns)
Here:
$2,885
State:
$3,948
(% of AGI for various income ranges: 1.4% for AGIs $25k-50k, 1.1% for AGIs $50k-75k, 1.4% for AGIs $75k-100k, 1.6% for AGIs $100k-200k)
Taxes paid: $8,988 (reported on 31.2% of returns)
56315:
$8,988
State:
$10,589
(% of AGI for various income ranges: 2.1% for AGIs below $25k, 2.5% for AGIs $25k-50k, 3.3% for AGIs $50k-75k, 3.8% for AGIs $75k-100k, 7.6% for AGIs $100k-200k)
Earned income credit: $1,764 (reported on 14.3% of returns)
Here:
$1,764
State:
$2,037
(% of AGI for various income ranges: 3.6% for AGIs below $25k, 1.1% for AGIs $25k-50k)
Percentage of individuals using paid preparers for their 2012 taxes: 68.8%
Here:
69%
State:
55%
(% for various income ranges: 61.5% for AGIs below $25k, 68.4% for AGIs $25k-50k, 69.2% for AGIs $50k-75k, 77.8% for AGIs $75k-100k, 80.0% for AGIs $100k-200k)
Averages for the 2004 tax year for zip code 56315, filed in 2005:
Average Adjusted Gross Income (AGI) in 2004: $37,381 (Individual Income Tax Returns)
Here:
$37,381
State:
$53,560
Salary/wage: $31,188 (reported on 82.2% of returns)
Here:
$31,188
State:
$46,177
(% of AGI for various income ranges: 134.9% for AGIs below $10k, 67.6% for AGIs $10k-25k, 76.4% for AGIs $25k-50k, 76.5% for AGIs $50k-75k, 72.8% for AGIs $75k-100k, 40.5% for AGIs over 100k)
Taxable interest for individuals: $1,256 (reported on 50.3% of returns)
This zip code:
$1,256
Minnesota:
$1,796
(% of AGI for various income ranges: 15.8% for AGIs below $10k, 4.1% for AGIs $10k-25k, 1.1% for AGIs $25k-50k, 0.6% for AGIs $50k-75k, 1.1% for AGIs $75k-100k, 2.0% for AGIs over 100k)
Taxable dividends: $1,103 (reported on 25.3% of returns)
Here:
$1,103
State:
$3,096
(% of AGI for various income ranges: 2.0% for AGIs below $10k, 1.8% for AGIs $10k-25k, 1.0% for AGIs $25k-50k, 0.2% for AGIs $50k-75k, 0.3% for AGIs $75k-100k, 0.8% for AGIs over 100k)
Net capital gain/loss: +$9,947 (reported on 23.2% of returns)
Here:
+$9,947
State:
+$10,864
(% of AGI for various income ranges: -1.3% for AGIs below $10k, 1.0% for AGIs $10k-25k, 2.4% for AGIs $25k-50k, 1.6% for AGIs $50k-75k, 2.9% for AGIs $75k-100k, 23.1% for AGIs over 100k)
Profit/loss from business: +$8,307 (reported on 20.5% of returns)
Here:
+$8,307
State:
+$10,442
(% of AGI for various income ranges: 11.5% for AGIs below $10k, 8.0% for AGIs $10k-25k, 5.1% for AGIs $25k-50k, 4.5% for AGIs $50k-75k, 6.7% for AGIs $75k-100k)
Profit/loss from farming: +$1,238 (reported on 11.0% of returns)
Here:
+$1,238
State:
-$962
(% of AGI for various income ranges: 1.8% for AGIs below $10k, 2.7% for AGIs $10k-25k, 2.7% for AGIs $25k-50k, -1.3% for AGIs $50k-75k, -2.5% for AGIs $75k-100k)
IRA payment deduction: $3,455 (reported on 4.5% of returns)
56315:
$3,455
Minnesota:
$2,955
Total itemized deductions: $15,958 (24% of AGI, reported on 25.9% of returns)
Here:
$15,958
State:
$20,035
Here:
24.2% of AGI
State:
21.3% of AGI
(% of AGI for various income ranges: 10.2% for AGIs $10k-25k, 8.7% for AGIs $25k-50k, 11.7% for AGIs $50k-75k, 14.2% for AGIs $75k-100k, 12.4% for AGIs over 100k)
Charity contributions deductions: $2,546 (4% of AGI, reported on 20.8% of returns)
Here:
$2,546
State:
$3,333
Here:
3.6% of AGI
State:
3.4% of AGI
(% of AGI for various income ranges: 1.3% for AGIs $10k-25k, 0.9% for AGIs $25k-50k, 1.2% for AGIs $50k-75k, 1.9% for AGIs $75k-100k, 2.2% for AGIs over 100k)
Total tax: $4,382 (reported on 78.2% of returns)
56315:
$4,382
State:
$8,485
(% of AGI for various income ranges: 5.6% for AGIs below $10k, 4.9% for AGIs $10k-25k, 7.2% for AGIs $25k-50k, 8.6% for AGIs $50k-75k, 9.5% for AGIs $75k-100k, 14.9% for AGIs over 100k)
Earned income credit: $1,338 (reported on 10.5% of returns)
Here:
$1,338
State:
$1,523
Percentage of individuals using paid preparers for their 2004 taxes: 72.1%
Here:
72%
State:
59%
(% for various income ranges: 59.2% for AGIs below $10k, 74.2% for AGIs $10k-25k, 69.0% for AGIs $25k-50k, 77.6% for AGIs $50k-75k, 85.1% for AGIs $75k-100k, 94.7% for AGIs over 100k)
Household received Food Stamps/SNAP in the past 12 months: 30 Household did not receive Food Stamps/SNAP in the past 12 months: 709
Women who had a birth in the past 12 months: 37 (37 now married, 0 unmarried) Women who did not have a birth in the past 12 months: 400 (254 now married, 146 unmarried)
Housing units in zip code 56315 with a mortgage: 388 (19 second mortgage, 13 both second mortgage and home equity loan) Median monthly owner costs for units with a mortgage: $1,513 Median monthly owner costs for units without a mortgage: $668
Residents with income below the poverty level in 2022:
This zip code:
7.7%
Whole state:
9.6%
Residents with income below 50% of the poverty level in 2022:
This zip code:
2.9%
Whole state:
5.2%
Median number of rooms in houses and condos:
Here:
6.6
State:
7.1
Median number of rooms in apartments:
Here:
4.9
State:
3.8
Notable locations in this zip code not listed on our city pages
Notable locations in zip code 56315: Acorn Acres Resort and Campground (A), Brandon Fire Department (B), Brandon Auditorium (C), Brandon Police Department (D), Millerville Fire Department (E). Display/hide their locations on the map
Churches in zip code 56315 include: Saint Petrie Church (A), Saint Ann's Church (B), Grace Lutheran Church (C), West Moe Church (D). Display/hide their locations on the map
Cemeteries: Brandon Cemetery (1), Chippewa Cemetery (2), Millerville Cemetery (3), West Moe Cemetery (4), Saint Petri Cemetery (5). Display/hide their locations on the map
Lakes, reservoirs, and swamps: Barsness Lake (A), Baumbach Lake (B), Whiskey Lake (C), Lake Thorstad (D), Thorson Lake (E), Redick Swamp (F), Quam Lake (G), Nelson Lake (H). Display/hide their locations on the map
Size of family households: 262 2-persons, 63 3-persons, 108 4-persons, 56 5-persons, 13 6-persons, 14 7-or-more-persons
Size of nonfamily households: 171 1-person, 51 2-persons
380 married couples with children.
71 single-parent households (21 men, 50 women).
98.9% of residents of 56315 zip code speak English at home.
0.3% of residents speak Spanish at home (60% very well, 40% well).
0.5% of residents speak other Indo-European language at home (100% very well).
0.2% of residents speak Asian or Pacific Island language at home (100% well).
Foreign born population: 9 (0.5%) (56.9% of them are naturalized citizens)
This zip code:
0.5%
Whole state:
8.7%
44%Germany
33%Singapore
11%France
53%German
12%Norwegian
8%American
6%Polish
5%Irish
2%French
2%Czech
Year of entry for the foreign-born population
02010 or later
62000 to 2009
21990 to 1999
1Before 1990
Facilities with environmental interests located in this zip code:
MILLERVILLE WWTP (COUNTY ROAD 60 in BRANDON, MN)
STATE MASTER (Minnesota Pollution Control Agency permits and compilance tracking) - PCS-MN0054305, NPDES NON-MAJOR National Pollutant Discharge Elimination System NON-MAJOR (Tracking pollutant discharge elimination systems) - permit National Pollutant Discharge Elimination System NON-MAJOR (Tracking pollutant discharge elimination systems) - permit Business SIC classification: SEWERAGE SYSTEMS Business NAICS classification: SEWAGE TREATMENT FACILITIES. Organizations: MILLERVILLE CITY OF (CONTACT/OWNER)
BRANDON (CITY HALL in BRANDON, MN)
National Pollutant Discharge Elimination System NON-MAJOR (Tracking pollutant discharge elimination systems) - permit COMMUNITY WATER SYSTEM (SDWIS) - SDWIS-MN1210009 3, WATER TREATMENT PLANT Business SIC classification: SEWERAGE SYSTEMS
BRANDON EL. (206 W. THIRD ST. in BRANDON, MN)
(National Center for Education Statistics) - STATE ID-010207001
BRANDON SEC. (206 W. THIRD ST. in BRANDON, MN)
(National Center for Education Statistics) - STATE ID-010207002
BRANDON SCHOOLS (3RD AND STOWES in BRANDON, MN)
Conditionally Exempt Small Quantity Generators, less than 100 kg/month of hazardous waste (Resource Conservation and Recovery Act (tracking hazardous waste)) - notification Organizations: BRANDON PUBLIC SCHOOLS (CONTACT/OWNER)
Housing units lacking complete plumbing facilities: 0.3% Housing units lacking complete kitchen facilities: 0.7%
53.2%Bottled, tank, or LP gas
35.7%Electricity
6.0%Fuel oil, kerosene, etc.
3.8%Wood
0.8%Utility gas
0.6%No fuel used
Population in 1990: 1,453. Population change in the 1990s: +81 (+5.6%).
Place of birth for U.S.-born residents:
This state: 1,547
Northeast: 27
Midwest: 255
South: 36
West: 18
69% of the 56315 zip code residents lived in the same house 5 years ago. Out of people who lived in different houses, 62% lived in this county. Out of people who lived in different counties, 50% lived in Minnesota.
96% of the 56315 zip code residents lived in the same house 1 year ago. Out of people who lived in different houses, 69% moved from this county. Out of people who lived in different houses, 28% moved from different county within same state. Out of people who lived in different houses, 4% moved from different state.
Private vs. public school enrollment:
Students in private schools in grades 1 to 8 (elementary and middle school): 13
Here:
6.9%
Minnesota:
12.9%
Students in private schools in grades 9 to 12 (high school): 4
Here:
4.1%
Minnesota:
8.6%
Students in private undergraduate colleges: 1
Here:
3.0%
Minnesota:
26.2%
Occupation by median earnings in the past 12 months ($)
104,814Computer and mathematical occupations
78,008Community and social service occupations
69,934Sales and related occupations
69,018Health technologists and technicians
67,259Architecture and engineering occupations
64,980Business and financial operations occupations
Top industries in this zip code by the number of employees in 2005:
Wholesale Trade: Metal Service Centers and Other Metal Merchant Wholesalers (20-49 employees: 1 establishment)
Accommodation and Food Services: Limited-Service Restaurants (10-19: 1, 5-9: 1)
Construction: Site Preparation Contractors (10-19: 1)
Construction: Highway, Street, and Bridge Construction (5-9: 1, 1-4: 1)
Fatal accident statistics in 2012:
Fatal accident count: 1
Vehicles involved in fatal accidents: 1
Fatal accidents caused by drunken drivers: 1
Fatalities: 1
Persons involved in fatal accidents: 1
Pedestrians involved in fatal accidents: 0
Fatal accident statistics in 2010:
Fatal accident count: 1
Vehicles involved in fatal accidents: 2
Fatal accidents caused by drunken drivers: 1
Fatalities: 1
Persons involved in fatal accidents: 3
Pedestrians involved in fatal accidents: 0
2002 - 2018 National Fire Incident Reporting System (NFIRS) incidents
Based on the data from the years 2002 - 2018 the average number of fire incidents per year is 14. The highest number of fires - 23 took place in 2012, and the least - 6 in 2007. The data has a rising trend.
When looking into fire subcategories, the most incidents belonged to: Outside Fires (48.0%), and Structure Fires (32.8%).
Fire incident types reported to NFIRS in Zip Code 56315


+$1,238
-$962
(% of AGI for various income ranges: 1.8% for AGIs below $10k, 2.7% for AGIs $10k-25k, 2.7% for AGIs $25k-50k, -1.3% for AGIs $50k-75k, -2.5% for AGIs $75k-100k)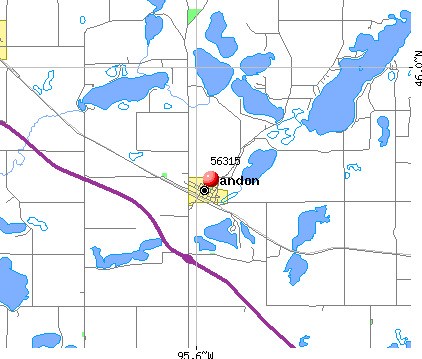 Nearest zip codes: 56332, 56326, 56343, 56327, 56308, 56309.


 Based on the data from the years 2002 - 2018 the average number of fire incidents per year is 14. The highest number of fires - 23 took place in 2012, and the least - 6 in 2007. The data has a rising trend.
 When looking into fire subcategories, the most incidents belonged to: Outside Fires (48.0%), and Structure Fires (32.8%).