Estimated zip code population in 2022: 1,508 Zip code population in 2010: 1,322 Zip code population in 2000: 1,367
Houses and condos: 664 Renter-occupied apartments: 26
% of renters here:
4%
State:
32%
March 2022 cost of living index in zip code 54864: 87.3 (less than average, U.S. average is 100)
Land area: 50.9 sq. mi. Water area: 0.2 sq. mi.
Population density: 30 people per square mile
(very low).
OSM Map
General Map
Google Map
MSN Map
OSM Map
General Map
Google Map
MSN Map
OSM Map
General Map
Google Map
MSN Map
OSM Map
General Map
Google Map
MSN Map
Please wait while loading the map...
Real estate property taxes paid for housing units in 2022:
This zip code:
1.1% ($2,444)
Wisconsin:
1.4% ($3,497)
Median real estate property taxes paid for housing units with mortgages in 2022: $2,474 (1.1%) Median real estate property taxes paid for housing units with no mortgage in 2022: $2,384 (1.0%)
Business Search- 14 Million verified businesses
Males: 834
(55.3%)
Females: 674
(44.7%)
For population 25 years and over in 54864:
High school or higher: 95.6%
Bachelor's degree or higher: 23.2%
Graduate or professional degree: 6.6%
Unemployed: 3.5%
Mean travel time to work (commute): 29.4 minutes
For population 15 years and over in 54864:
Never married: 24.1%
Now married: 60.6%
Separated: 0.3%
Widowed: 6.0%
Divorced: 9.0%
Zip code 54864 compared to state average:
Black race population percentage significantly below state average.
Hispanic race population percentage significantly below state average.
Foreign-born population percentage significantly below state average.
Renting percentage significantly below state average.
Length of stay since moving in significantly above state average.
Estimated median house/condo value in 2022: $229,312
54864:
$229,312
Wisconsin:
$252,800
According to our research of Wisconsin and other state lists, there were 2 registered sex offenders living in 54864 zip code as of May 25, 2024. The ratio of all residents to sex offenders in zip code 54864 is 708 to 1. The ratio of registered sex offenders to all residents in this zip code is lower than the state average.
Median resident age:
This zip code:
44.2 years
Wisconsin median age:
40.4 years
Average household size:
This zip code:
2.6 people
Wisconsin:
2.3 people
Averages for the 2020 tax year for zip code 54864, filed in 2021:
Average Adjusted Gross Income (AGI) in 2020: $69,088 (Individual Income Tax Returns)
Here:
$69,088
State:
$72,319
Salary/wage: $59,742 (reported on 82.6% of returns)
Here:
$59,742
State:
$59,242
(% of AGI for various income ranges: 1195.4% for AGIs below $25k, 3633.3% for AGIs $25k-50k, 6028.8% for AGIs $50k-75k, 8247.1% for AGIs $75k-100k, 18633.0% for AGIs $100k-200k)
Taxable interest for individuals: $904 (reported on 39.1% of returns)
This zip code:
$904
Wisconsin:
$1,431
(% of AGI for various income ranges: 12.3% for AGIs below $25k, 8.9% for AGIs $25k-50k, 30.0% for AGIs $50k-75k, 14.3% for AGIs $75k-100k, 186.0% for AGIs $100k-200k)
Ordinary dividends: $2,129 (reported on 20.3% of returns)
Here:
$2,129
State:
$6,481
(% of AGI for various income ranges: 34.4% for AGIs $25k-50k, 91.2% for AGIs $50k-75k, 194.0% for AGIs $100k-200k)
Net capital gain/loss in AGI: +$6,754 (reported on 18.8% of returns)
Here:
+$6,754
State:
+$18,329
(% of AGI for various income ranges: 4.6% for AGIs below $25k, 250.0% for AGIs $50k-75k, 672.0% for AGIs $100k-200k)
Profit/loss from business: +$10,855 (reported on 15.9% of returns)
Here:
+$10,855
State:
+$14,562
(% of AGI for various income ranges: 266.9% for AGIs below $25k, 211.2% for AGIs $50k-75k, 678.0% for AGIs $100k-200k)
Taxable individual retirement arrangement distribution: $12,671 (reported on 10.1% of returns)
54864:
$12,671
Wisconsin:
$19,348
(% of AGI for various income ranges: 185.4% for AGIs below $25k, 305.0% for AGIs $50k-75k, 402.0% for AGIs $100k-200k)
Total itemized deductions: $31,967 (reported on 4.3% of returns)
Here:
$31,967
State:
$33,000
(% of AGI for various income ranges: 1370.0% for AGIs $75k-100k)
Charity contributions: $7,350 (reported on 2.9% of returns)
Here:
$7,350
State:
$12,044
(% of AGI for various income ranges: 183.8% for AGIs $50k-75k)
Taxes paid: $9,000 (reported on 4.3% of returns)
54864:
$9,000
State:
$8,228
(% of AGI for various income ranges: 385.7% for AGIs $75k-100k)
Earned income credit: $2,062 (reported on 11.6% of returns)
Here:
$2,062
State:
$2,155
(% of AGI for various income ranges: 76.9% for AGIs below $25k, 72.2% for AGIs $25k-50k)
Percentage of individuals using paid preparers for their 2020 taxes: 92.8%
Here:
93%
State:
94%
(% for various income ranges: 90.0% for AGIs below $25k, 91.7% for AGIs $25k-50k, 90.9% for AGIs $50k-75k, 88.9% for AGIs $75k-100k, 100.0% for AGIs $100k-200k, 100.0% for AGIs over 200k)
Averages for the 2012 tax year for zip code 54864, filed in 2013:
Average Adjusted Gross Income (AGI) in 2012: $57,008 (Individual Income Tax Returns)
Here:
$57,008
State:
$57,939
Salary/wage: $48,454 (reported on 84.8% of returns)
Here:
$48,454
State:
$48,248
(% of AGI for various income ranges: 72.4% for AGIs below $25k, 68.3% for AGIs $25k-50k, 80.1% for AGIs $50k-75k, 84.8% for AGIs $75k-100k, 62.7% for AGIs $100k-200k)
Taxable interest for individuals: $596 (reported on 42.4% of returns)
This zip code:
$596
Wisconsin:
$1,224
(% of AGI for various income ranges: 0.7% for AGIs below $25k, 0.9% for AGIs $25k-50k, 0.2% for AGIs $50k-75k, 0.3% for AGIs $75k-100k, 0.4% for AGIs $100k-200k)
Ordinary dividends: $1,877 (reported on 19.7% of returns)
Here:
$1,877
State:
$5,137
(% of AGI for various income ranges: 1.5% for AGIs below $25k, 1.1% for AGIs $25k-50k, 0.6% for AGIs $50k-75k, 0.6% for AGIs $100k-200k)
Net capital gain/loss in AGI: +$3,700 (reported on 13.6% of returns)
Here:
+$3,700
State:
+$11,137
(% of AGI for various income ranges: 2.4% for AGIs $25k-50k, 0.4% for AGIs $50k-75k, 1.2% for AGIs $100k-200k)
Profit/loss from business: +$9,483 (reported on 18.2% of returns)
Here:
+$9,483
State:
+$11,943
(% of AGI for various income ranges: 7.5% for AGIs below $25k, 10.0% for AGIs $25k-50k, 5.2% for AGIs $75k-100k)
Taxable individual retirement arrangement distribution: $8,414 (reported on 10.6% of returns)
54864:
$8,414
Wisconsin:
$14,087
Total itemized deductions: $18,883 (20% of AGI, reported on 36.4% of returns)
Here:
$18,883
State:
$22,257
Here:
19.7% of AGI
State:
20.1% of AGI
(% of AGI for various income ranges: 13.5% for AGIs $25k-50k, 13.4% for AGIs $50k-75k, 13.8% for AGIs $75k-100k, 12.2% for AGIs $100k-200k)
Charity contributions: $2,667 (reported on 27.3% of returns)
Here:
$2,667
State:
$3,370
(% of AGI for various income ranges: 1.1% for AGIs $25k-50k, 1.1% for AGIs $50k-75k, 1.6% for AGIs $75k-100k, 1.5% for AGIs $100k-200k)
Taxes paid: $8,312 (reported on 36.4% of returns)
54864:
$8,312
State:
$10,731
(% of AGI for various income ranges: 3.9% for AGIs $25k-50k, 5.3% for AGIs $50k-75k, 5.7% for AGIs $75k-100k, 6.7% for AGIs $100k-200k)
Earned income credit: $1,989 (reported on 13.6% of returns)
Here:
$1,989
State:
$2,094
(% of AGI for various income ranges: 4.8% for AGIs below $25k, 0.8% for AGIs $25k-50k)
Percentage of individuals using paid preparers for their 2012 taxes: 51.5%
Here:
52%
State:
54%
(% for various income ranges: 45.5% for AGIs below $25k, 53.3% for AGIs $25k-50k, 58.3% for AGIs $50k-75k, 50.0% for AGIs $75k-100k, 55.6% for AGIs $100k-200k)
Averages for the 2004 tax year for zip code 54864, filed in 2005:
Average Adjusted Gross Income (AGI) in 2004: $42,257 (Individual Income Tax Returns)
Here:
$42,257
State:
$47,735
Salary/wage: $38,310 (reported on 87.1% of returns)
Here:
$38,310
State:
$41,540
(% of AGI for various income ranges: 87.2% for AGIs below $10k, 74.8% for AGIs $10k-25k, 77.1% for AGIs $25k-50k, 85.3% for AGIs $50k-75k, 84.6% for AGIs $75k-100k, 68.3% for AGIs over 100k)
Taxable interest for individuals: $644 (reported on 57.6% of returns)
This zip code:
$644
Wisconsin:
$1,420
(% of AGI for various income ranges: 3.5% for AGIs below $10k, 2.0% for AGIs $10k-25k, 0.9% for AGIs $25k-50k, 0.5% for AGIs $50k-75k, 0.6% for AGIs $75k-100k, 0.9% for AGIs over 100k)
Taxable dividends: $1,189 (reported on 25.9% of returns)
Here:
$1,189
State:
$2,869
(% of AGI for various income ranges: 1.0% for AGIs below $10k, 1.3% for AGIs $10k-25k, 0.9% for AGIs $25k-50k, 0.3% for AGIs $50k-75k, 0.9% for AGIs $75k-100k, 0.6% for AGIs over 100k)
Net capital gain/loss: +$3,222 (reported on 17.0% of returns)
Here:
+$3,222
State:
+$9,569
(% of AGI for various income ranges: 1.0% for AGIs $10k-25k, 2.0% for AGIs $25k-50k, 0.2% for AGIs $50k-75k, 1.1% for AGIs $75k-100k, 2.5% for AGIs over 100k)
Profit/loss from business: +$6,008 (reported on 20.5% of returns)
Here:
+$6,008
State:
+$10,417
(% of AGI for various income ranges: -9.9% for AGIs below $10k, 9.4% for AGIs $10k-25k, 4.7% for AGIs $25k-50k, 2.4% for AGIs $50k-75k, 2.2% for AGIs $75k-100k)
IRA payment deduction: $2,906 (reported on 5.0% of returns)
54864:
$2,906
Wisconsin:
$2,900
Total itemized deductions: $15,703 (22% of AGI, reported on 36.6% of returns)
Here:
$15,703
State:
$18,160
Here:
22.4% of AGI
State:
21.1% of AGI
(% of AGI for various income ranges: 13.8% for AGIs $10k-25k, 10.6% for AGIs $25k-50k, 13.7% for AGIs $50k-75k, 16.5% for AGIs $75k-100k, 15.4% for AGIs over 100k)
Charity contributions deductions: $2,042 (3% of AGI, reported on 30.3% of returns)
Here:
$2,042
State:
$2,711
Here:
2.7% of AGI
State:
3.0% of AGI
(% of AGI for various income ranges: 1.4% for AGIs $10k-25k, 1.1% for AGIs $25k-50k, 0.8% for AGIs $50k-75k, 2.4% for AGIs $75k-100k, 2.1% for AGIs over 100k)
Total tax: $4,951 (reported on 77.9% of returns)
54864:
$4,951
State:
$7,114
(% of AGI for various income ranges: 2.7% for AGIs below $10k, 4.6% for AGIs $10k-25k, 6.6% for AGIs $25k-50k, 7.6% for AGIs $50k-75k, 9.7% for AGIs $75k-100k, 16.6% for AGIs over 100k)
Earned income credit: $1,812 (reported on 12.6% of returns)
Here:
$1,812
State:
$1,544
Percentage of individuals using paid preparers for their 2004 taxes: 51.3%
Here:
51%
State:
57%
(% for various income ranges: 43.6% for AGIs below $10k, 50.6% for AGIs $10k-25k, 49.7% for AGIs $25k-50k, 59.1% for AGIs $50k-75k, 47.5% for AGIs $75k-100k, 66.7% for AGIs over 100k)
Household received Food Stamps/SNAP in the past 12 months: 19 Household did not receive Food Stamps/SNAP in the past 12 months: 559
Women who had a birth in the past 12 months: 15 (15 now married, 0 unmarried) Women who did not have a birth in the past 12 months: 252 (140 now married, 111 unmarried)
Housing units in zip code 54864 with a mortgage: 319 (40 second mortgage, 3 home equity loan, 25 both second mortgage and home equity loan) Median monthly owner costs for units with a mortgage: $1,637 Median monthly owner costs for units without a mortgage: $527
Residents with income below the poverty level in 2022:
This zip code:
5.9%
Whole state:
10.7%
Residents with income below 50% of the poverty level in 2022:
This zip code:
2.3%
Whole state:
5.7%
Median number of rooms in houses and condos:
Here:
6.2
State:
6.5
Median number of rooms in apartments:
Here:
5.1
State:
4.1
Notable locations in this zip code not listed on our city pages
284 married couples with children.
73 single-parent households (73 women).
98.6% of residents of 54864 zip code speak English at home.
0.8% of residents speak Spanish at home (9% well, 91% not well).
Foreign born population: 9 (0.7%) (20.0% of them are naturalized citizens)
This zip code:
0.7%
Whole state:
5.0%
67%Guatemala
11%Sweden
11%United Kingdom, excluding England and Scotland
11%Honduras
17%German
12%Swedish
9%Finnish
7%Scandinavian
6%Polish
5%Norwegian
5%American
Year of entry for the foreign-born population
142010 or later
52000 to 2009
01990 to 1999
1Before 1990
Facilities with environmental interests located in this zip code:
DOUGLAS COUNTY HIGHWAY DEPARTMENT (HIGHWAY P in POPLAR, WI)
AIR MINOR (AIRS/AFS) Business SIC classification: ASPHALT PAVING MIXTURES AND BLOCKS
Housing units lacking complete plumbing facilities: 5.2% Housing units lacking complete kitchen facilities: 5.9%
64.4%Bottled, tank, or LP gas
16.6%Utility gas
11.6%Wood
4.6%Electricity
1.8%Fuel oil, kerosene, etc.
1.2%Other fuel
Population in 1990: 1,064. Population change in the 1990s: +303 (+28.5%).
Place of birth for U.S.-born residents:
This state: 512
Northeast: 15
Midwest: 902
South: 7
West: 65
66% of the 54864 zip code residents lived in the same house 5 years ago. Out of people who lived in different houses, 54% lived in this county. Out of people who lived in different counties, 50% lived in Wisconsin.
98% of the 54864 zip code residents lived in the same house 1 year ago. Out of people who lived in different houses, 11% moved from this county. Out of people who lived in different houses, 117% moved from different state.
Private vs. public school enrollment:
Students in private schools in grades 1 to 8 (elementary and middle school): 31
Here:
18.1%
Wisconsin:
16.7%
Students in private schools in grades 9 to 12 (high school): 11
Here:
13.3%
Wisconsin:
12.5%
Students in private undergraduate colleges:
Here:
0.0%
Wisconsin:
17.5%
Occupation by median earnings in the past 12 months ($)
146,575Computer and mathematical occupations
73,678Installation, maintenance, and repair occupations
72,538Management occupations
71,966Transportation occupations
69,555Law enforcement workers including supervisors
67,487Health diagnosing and treating practitioners and other technical occupations
Companies with federal contracts located in this zip code:
LUNDBERG MARSHALL & ASSOC (5168 S CEMETERY RD in POPLAR, WI; small business) : $3,045,211 in 25 contractsfrom 1999 to 2005
Contracts for Technical Assistance by ENERGY, Department of, Air Force Signed by year:2000: $190,000; 2001: $649,486; 2002: $375,000; 2003: $790,000; 2004: $267,725; 2005: $280,000; 2006: $0.
Biggest contracts:
$393,000 with ENERGY, Department of for Technical Assistance. Signed on 1999-11-15. Completion date: 2001-12-15.
$355,000, same as above.Signed on 2003-01-15. Completion date: 2003-12-15.
$295,000, same as above.Signed on 2001-01-15. Completion date: 2001-12-15.
$280,000, same as above.Signed on 2005-02-02. Completion date: 2005-03-01.
MATT LONG (5502 S COUNTY R in POPLAR, WI; small business) 2 employees, $100000 revenue.
$2,000 with National Park Service for Construction of Structures and Facilities -- Water Supply Facilities. Signed on 2000-05-15. Completion date: 2000-06-15.
Top industries in this zip code by the number of employees in 2005:
Health Care and Social Assistance: Offices of Physical, Occupational and Speech Therapists, and Audiologists (10-19 employees: 1 establishment)
Other Services (except Public Administration): Automotive Body, Paint, and Interior Repair and Maintenance (10-19: 1)
Other Services (except Public Administration): Religious Organizations (5-9: 1, 1-4: 1)
Health Care and Social Assistance: Child Day Care Services (5-9: 1, 1-4: 1)
Accommodation and Food Services: Full-Service Restaurants (5-9: 1)
People in group quarters in 2000:
94 people in nursing homes
Fatal accident statistics in 2012:
Fatal accident count: 1
Vehicles involved in fatal accidents: 1
Fatal accidents caused by drunken drivers: 1
Fatalities: 1
Persons involved in fatal accidents: 1
Pedestrians involved in fatal accidents: 0
Fatal accident statistics in 2011:
Fatal accident count: 1
Vehicles involved in fatal accidents: 1
Fatal accidents caused by drunken drivers: 0
Fatalities: 1
Persons involved in fatal accidents: 2
Pedestrians involved in fatal accidents: 0
Home Mortgage Disclosure Act Aggregated Statistics For Year 2009 (Based on 2 partial tracts)
A) FHA, FSA/RHS & VA Home Purchase Loans
B) Conventional Home Purchase Loans
C) Refinancings
D) Home Improvement Loans
F) Non-occupant Loans on < 5 Family Dwellings (A B C & D)
G) Loans On Manufactured Home Dwelling (A B C & D)
Number
Average Value
Number
Average Value
Number
Average Value
Number
Average Value
Number
Average Value
Number
Average Value
LOANS ORIGINATED
3
$157,210
13
$118,291
93
$152,040
11
$55,316
8
$161,828
8
$82,988
APPLICATIONS APPROVED, NOT ACCEPTED
0
$0
0
$0
9
$177,148
2
$59,000
1
$124,030
2
$68,615
APPLICATIONS DENIED
0
$0
2
$99,150
29
$151,801
3
$50,897
1
$180,580
3
$131,700
APPLICATIONS WITHDRAWN
1
$116,870
1
$39,590
12
$168,393
0
$0
2
$47,880
1
$114,610
FILES CLOSED FOR INCOMPLETENESS
0
$0
0
$0
3
$163,240
1
$103,300
0
$0
0
$0
Aggregated Statistics For Year 2008 (Based on 2 partial tracts)
A) FHA, FSA/RHS & VA Home Purchase Loans
B) Conventional Home Purchase Loans
C) Refinancings
D) Home Improvement Loans
F) Non-occupant Loans on < 5 Family Dwellings (A B C & D)
G) Loans On Manufactured Home Dwelling (A B C & D)
Number
Average Value
Number
Average Value
Number
Average Value
Number
Average Value
Number
Average Value
Number
Average Value
LOANS ORIGINATED
3
$134,713
24
$135,170
48
$142,616
12
$53,251
10
$132,176
8
$88,218
APPLICATIONS APPROVED, NOT ACCEPTED
0
$0
1
$103,680
5
$131,346
1
$11,310
0
$0
1
$113,100
APPLICATIONS DENIED
1
$104,430
2
$72,385
20
$133,967
2
$78,230
1
$87,460
1
$48,260
APPLICATIONS WITHDRAWN
1
$107,070
0
$0
9
$157,419
0
$0
1
$178,320
0
$0
FILES CLOSED FOR INCOMPLETENESS
0
$0
0
$0
0
$0
0
$0
0
$0
0
$0
Aggregated Statistics For Year 2007 (Based on 2 partial tracts)
A) FHA, FSA/RHS & VA Home Purchase Loans
B) Conventional Home Purchase Loans
C) Refinancings
D) Home Improvement Loans
F) Non-occupant Loans on < 5 Family Dwellings (A B C & D)
G) Loans On Manufactured Home Dwelling (A B C & D)
Number
Average Value
Number
Average Value
Number
Average Value
Number
Average Value
Number
Average Value
Number
Average Value
LOANS ORIGINATED
3
$126,293
23
$152,390
50
$109,089
20
$46,220
13
$101,732
10
$91,121
APPLICATIONS APPROVED, NOT ACCEPTED
0
$0
3
$162,990
8
$101,555
3
$85,327
1
$167,390
1
$91,230
APPLICATIONS DENIED
0
$0
5
$134,514
19
$113,199
3
$78,040
2
$137,795
4
$95,948
APPLICATIONS WITHDRAWN
0
$0
2
$104,805
14
$135,316
2
$69,370
0
$0
0
$0
FILES CLOSED FOR INCOMPLETENESS
0
$0
0
$0
3
$99,903
0
$0
0
$0
0
$0
Aggregated Statistics For Year 2006 (Based on 2 partial tracts)
A) FHA, FSA/RHS & VA Home Purchase Loans
B) Conventional Home Purchase Loans
C) Refinancings
D) Home Improvement Loans
F) Non-occupant Loans on < 5 Family Dwellings (A B C & D)
G) Loans On Manufactured Home Dwelling (A B C & D)
Number
Average Value
Number
Average Value
Number
Average Value
Number
Average Value
Number
Average Value
Number
Average Value
LOANS ORIGINATED
2
$114,230
28
$127,264
53
$109,551
13
$34,945
8
$117,152
6
$67,295
APPLICATIONS APPROVED, NOT ACCEPTED
0
$0
4
$114,985
12
$98,522
1
$25,640
2
$193,780
0
$0
APPLICATIONS DENIED
0
$0
6
$184,542
35
$112,863
3
$47,000
2
$141,000
1
$87,460
APPLICATIONS WITHDRAWN
0
$0
3
$139,867
23
$95,250
2
$100,280
1
$219,410
0
$0
FILES CLOSED FOR INCOMPLETENESS
0
$0
1
$129,690
5
$138,058
0
$0
0
$0
0
$0
Aggregated Statistics For Year 2005 (Based on 2 partial tracts)
A) FHA, FSA/RHS & VA Home Purchase Loans
B) Conventional Home Purchase Loans
C) Refinancings
D) Home Improvement Loans
F) Non-occupant Loans on < 5 Family Dwellings (A B C & D)
G) Loans On Manufactured Home Dwelling (A B C & D)
Number
Average Value
Number
Average Value
Number
Average Value
Number
Average Value
Number
Average Value
Number
Average Value
LOANS ORIGINATED
2
$130,440
38
$123,468
66
$113,488
22
$47,040
11
$114,951
9
$53,324
APPLICATIONS APPROVED, NOT ACCEPTED
0
$0
6
$88,847
9
$130,651
2
$17,340
2
$88,785
3
$58,057
APPLICATIONS DENIED
0
$0
9
$107,487
28
$119,805
6
$64,843
2
$118,755
3
$67,733
APPLICATIONS WITHDRAWN
0
$0
5
$99,378
24
$123,845
1
$179,450
2
$134,780
2
$65,220
FILES CLOSED FOR INCOMPLETENESS
0
$0
0
$0
9
$144,893
0
$0
1
$226,950
0
$0
Aggregated Statistics For Year 2004 (Based on 2 partial tracts)
B) Conventional Home Purchase Loans
C) Refinancings
D) Home Improvement Loans
F) Non-occupant Loans on < 5 Family Dwellings (A B C & D)
G) Loans On Manufactured Home Dwelling (A B C & D)
Number
Average Value
Number
Average Value
Number
Average Value
Number
Average Value
Number
Average Value
LOANS ORIGINATED
28
$120,519
56
$108,367
18
$49,261
10
$102,544
9
$67,232
APPLICATIONS APPROVED, NOT ACCEPTED
2
$51,085
11
$114,779
2
$25,260
0
$0
1
$89,730
APPLICATIONS DENIED
4
$85,672
23
$82,383
4
$35,060
1
$47,130
6
$71,567
APPLICATIONS WITHDRAWN
3
$106,943
22
$99,974
2
$27,900
2
$68,050
3
$60,447
FILES CLOSED FOR INCOMPLETENESS
0
$0
5
$106,692
1
$52,400
0
$0
0
$0
Aggregated Statistics For Year 2003 (Based on 2 partial tracts)
A) FHA, FSA/RHS & VA Home Purchase Loans
B) Conventional Home Purchase Loans
C) Refinancings
D) Home Improvement Loans
F) Non-occupant Loans on < 5 Family Dwellings (A B C & D)
Number
Average Value
Number
Average Value
Number
Average Value
Number
Average Value
Number
Average Value
LOANS ORIGINATED
1
$174,170
40
$100,980
172
$98,732
16
$41,117
15
$97,593
APPLICATIONS APPROVED, NOT ACCEPTED
0
$0
3
$75,400
10
$105,371
0
$0
0
$0
APPLICATIONS DENIED
0
$0
9
$89,140
40
$93,430
3
$12,693
2
$95,190
APPLICATIONS WITHDRAWN
0
$0
4
$115,645
18
$99,989
0
$0
1
$135,340
FILES CLOSED FOR INCOMPLETENESS
0
$0
2
$56,175
3
$63,963
0
$0
0
$0
Aggregated Statistics For Year 2002 (Based on 2 partial tracts)
A) FHA, FSA/RHS & VA Home Purchase Loans
B) Conventional Home Purchase Loans
C) Refinancings
D) Home Improvement Loans
F) Non-occupant Loans on < 5 Family Dwellings (A B C & D)
Number
Average Value
Number
Average Value
Number
Average Value
Number
Average Value
Number
Average Value
LOANS ORIGINATED
3
$69,747
30
$90,178
152
$87,712
14
$29,702
14
$84,717
APPLICATIONS APPROVED, NOT ACCEPTED
0
$0
3
$54,790
6
$96,763
2
$29,220
1
$72,760
APPLICATIONS DENIED
0
$0
6
$69,997
35
$85,051
5
$39,660
2
$70,690
APPLICATIONS WITHDRAWN
0
$0
3
$109,080
20
$92,101
1
$20,730
1
$94,630
FILES CLOSED FOR INCOMPLETENESS
0
$0
0
$0
3
$149,670
0
$0
0
$0
Aggregated Statistics For Year 2001 (Based on 2 partial tracts)
A) FHA, FSA/RHS & VA Home Purchase Loans
B) Conventional Home Purchase Loans
C) Refinancings
D) Home Improvement Loans
F) Non-occupant Loans on < 5 Family Dwellings (A B C & D)
Number
Average Value
Number
Average Value
Number
Average Value
Number
Average Value
Number
Average Value
LOANS ORIGINATED
2
$51,460
25
$98,276
113
$82,259
22
$25,345
11
$86,778
APPLICATIONS APPROVED, NOT ACCEPTED
0
$0
2
$54,100
6
$82,123
1
$26,390
0
$0
APPLICATIONS DENIED
0
$0
6
$69,053
31
$71,265
3
$39,963
2
$93,495
APPLICATIONS WITHDRAWN
0
$0
3
$71,003
16
$60,862
0
$0
2
$23,375
FILES CLOSED FOR INCOMPLETENESS
0
$0
0
$0
6
$92,680
0
$0
0
$0
Aggregated Statistics For Year 2000 (Based on 2 partial tracts)
A) FHA, FSA/RHS & VA Home Purchase Loans
B) Conventional Home Purchase Loans
C) Refinancings
D) Home Improvement Loans
F) Non-occupant Loans on < 5 Family Dwellings (A B C & D)
Number
Average Value
Number
Average Value
Number
Average Value
Number
Average Value
Number
Average Value
LOANS ORIGINATED
2
$98,965
25
$73,485
45
$57,899
21
$23,697
5
$53,006
APPLICATIONS APPROVED, NOT ACCEPTED
0
$0
3
$66,730
4
$54,478
1
$7,160
0
$0
APPLICATIONS DENIED
0
$0
8
$54,194
17
$47,990
2
$24,130
1
$65,600
APPLICATIONS WITHDRAWN
0
$0
2
$60,320
7
$47,126
2
$118,565
0
$0
FILES CLOSED FOR INCOMPLETENESS
0
$0
0
$0
2
$48,445
0
$0
0
$0
Aggregated Statistics For Year 1999 (Based on 1 partial tract)
A) FHA, FSA/RHS & VA Home Purchase Loans
B) Conventional Home Purchase Loans
C) Refinancings
D) Home Improvement Loans
F) Non-occupant Loans on < 5 Family Dwellings (A B C & D)


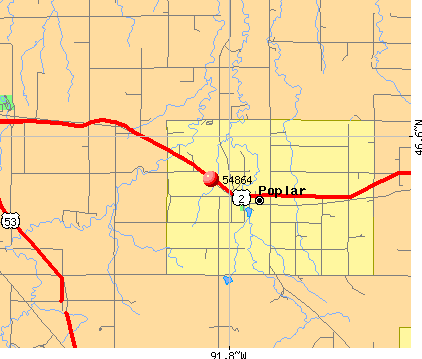 Nearest zip codes: 54842, 54854, 54849, 54874, 54820, 55802.


