Estimated zip code population in 2022: 1,049 Zip code population in 2010: 1,080 Zip code population in 2000: 1,032
Houses and condos: 494 Renter-occupied apartments: 12
% of renters here:
3%
State:
32%
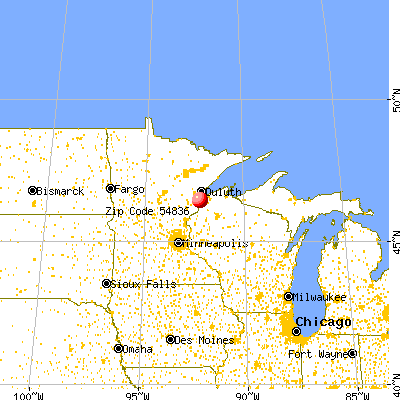
March 2022 cost of living index in zip code 54836: 85.7 (less than average, U.S. average is 100)
Land area: 130.9 sq. mi. Water area: 0.5 sq. mi.
Population density: 8 people per square mile
(very low).
OSM Map
General Map
Google Map
MSN Map
OSM Map
General Map
Google Map
MSN Map
OSM Map
General Map
Google Map
MSN Map
OSM Map
General Map
Google Map
MSN Map
Please wait while loading the map...
Real estate property taxes paid for housing units in 2022:
This zip code:
1.0% ($2,243)
Wisconsin:
1.4% ($3,497)
Median real estate property taxes paid for housing units with mortgages in 2022: $2,303 (1.1%) Median real estate property taxes paid for housing units with no mortgage in 2022: $2,037 (0.9%)
Business Search- 14 Million verified businesses
Males: 614
(58.5%)
Females: 436
(41.5%)
For population 25 years and over in 54836:
High school or higher: 89.9%
Bachelor's degree or higher: 21.2%
Graduate or professional degree: 5.8%
Unemployed: 2.5%
Mean travel time to work (commute): 31.1 minutes
For population 15 years and over in 54836:
Never married: 22.0%
Now married: 64.1%
Separated: 0.0%
Widowed: 2.1%
Divorced: 11.7%
Zip code 54836 compared to state average:
Black race population percentage significantly below state average.
Median age above state average.
Foreign-born population percentage significantly below state average.
Renting percentage significantly below state average.
Length of stay since moving in significantly above state average.
Percentage of population with a bachelor's degree or higher below state average.
Estimated median house/condo value in 2022: $214,672
54836:
$214,672
Wisconsin:
$252,800
According to our research of Wisconsin and other state lists, there was 1 registered sex offender living in 54836 zip code as of May 23, 2024. The ratio of all residents to sex offenders in zip code 54836 is 1,012 to 1. The ratio of registered sex offenders to all residents in this zip code is much lower than the state average.
Median resident age:
This zip code:
46.8 years
Wisconsin median age:
40.4 years
Average household size:
This zip code:
2.7 people
Wisconsin:
2.3 people
Averages for the 2020 tax year for zip code 54836, filed in 2021:
Average Adjusted Gross Income (AGI) in 2020: $66,091 (Individual Income Tax Returns)
Here:
$66,091
State:
$72,319
Salary/wage: $58,674 (reported on 83.6% of returns)
Here:
$58,674
State:
$59,242
(% of AGI for various income ranges: 1277.8% for AGIs below $25k, 3400.0% for AGIs $25k-50k, 4915.0% for AGIs $50k-75k, 9402.0% for AGIs $75k-100k, 20210.0% for AGIs $100k-200k)
Taxable interest for individuals: $533 (reported on 43.6% of returns)
This zip code:
$533
Wisconsin:
$1,431
(% of AGI for various income ranges: 7.8% for AGIs below $25k, 10.0% for AGIs $25k-50k, 93.8% for AGIs $50k-75k, 6.0% for AGIs $75k-100k, 48.6% for AGIs $100k-200k)
Ordinary dividends: $1,690 (reported on 18.2% of returns)
Here:
$1,690
State:
$6,481
(% of AGI for various income ranges: 84.4% for AGIs below $25k, 80.0% for AGIs $50k-75k, 41.4% for AGIs $100k-200k)
Net capital gain/loss in AGI: +$3,400 (reported on 14.5% of returns)
Here:
+$3,400
State:
+$18,329
(% of AGI for various income ranges: 33.3% for AGIs below $25k, 98.8% for AGIs $50k-75k, 232.9% for AGIs $100k-200k)
Profit/loss from business: +$11,880 (reported on 9.1% of returns)
Here:
+$11,880
State:
+$14,562
(% of AGI for various income ranges: 474.4% for AGIs below $25k, 334.0% for AGIs $75k-100k)
Taxable individual retirement arrangement distribution: $13,300 (reported on 9.1% of returns)
54836:
$13,300
Wisconsin:
$19,348
(% of AGI for various income ranges: 348.9% for AGIs $25k-50k, 702.0% for AGIs $75k-100k)
Earned income credit: $2,025 (reported on 7.3% of returns)
Here:
$2,025
State:
$2,155
(% of AGI for various income ranges: 90.0% for AGIs below $25k)
Percentage of individuals using paid preparers for their 2020 taxes: 89.1%
Here:
89%
State:
94%
(% for various income ranges: 84.6% for AGIs below $25k, 91.7% for AGIs $25k-50k, 90.0% for AGIs $50k-75k, 100.0% for AGIs $75k-100k, 84.6% for AGIs $100k-200k)
Averages for the 2012 tax year for zip code 54836, filed in 2013:
Average Adjusted Gross Income (AGI) in 2012: $55,933 (Individual Income Tax Returns)
Here:
$55,933
State:
$57,939
Salary/wage: $49,268 (reported on 89.8% of returns)
Here:
$49,268
State:
$48,248
(% of AGI for various income ranges: 79.7% for AGIs below $25k, 78.4% for AGIs $25k-50k, 74.4% for AGIs $50k-75k, 83.3% for AGIs $75k-100k, 79.3% for AGIs $100k-200k)
Taxable interest for individuals: $335 (reported on 46.9% of returns)
This zip code:
$335
Wisconsin:
$1,224
(% of AGI for various income ranges: 0.3% for AGIs below $25k, 0.7% for AGIs $25k-50k, 0.3% for AGIs $50k-75k, 0.1% for AGIs $75k-100k, 0.1% for AGIs $100k-200k)
Ordinary dividends: $1,138 (reported on 16.3% of returns)
Here:
$1,138
State:
$5,137
(% of AGI for various income ranges: 0.4% for AGIs $25k-50k, 0.3% for AGIs $50k-75k, 0.9% for AGIs $75k-100k)
Net capital gain/loss in AGI: +$700 (reported on 8.2% of returns)
Here:
+$700
State:
+$11,137
Profit/loss from business: +$2,380 (reported on 10.2% of returns)
Here:
+$2,380
State:
+$11,943
Taxable individual retirement arrangement distribution: $11,175 (reported on 8.2% of returns)
54836:
$11,175
Wisconsin:
$14,087
Total itemized deductions: $18,011 (20% of AGI, reported on 36.7% of returns)
Here:
$18,011
State:
$22,257
Here:
20.4% of AGI
State:
20.1% of AGI
(% of AGI for various income ranges: 8.6% for AGIs $25k-50k, 13.6% for AGIs $50k-75k, 13.9% for AGIs $75k-100k, 13.3% for AGIs $100k-200k)
Charity contributions: $1,467 (reported on 24.5% of returns)
Here:
$1,467
State:
$3,370
(% of AGI for various income ranges: 0.8% for AGIs $50k-75k, 0.5% for AGIs $75k-100k, 1.1% for AGIs $100k-200k)
Taxes paid: $7,533 (reported on 36.7% of returns)
54836:
$7,533
State:
$10,731
(% of AGI for various income ranges: 2.6% for AGIs $25k-50k, 4.6% for AGIs $50k-75k, 5.4% for AGIs $75k-100k, 7.1% for AGIs $100k-200k)
Earned income credit: $2,260 (reported on 10.2% of returns)
Here:
$2,260
State:
$2,094
(% of AGI for various income ranges: 5.9% for AGIs below $25k)
Percentage of individuals using paid preparers for their 2012 taxes: 46.9%
Here:
47%
State:
54%
(% for various income ranges: 35.7% for AGIs below $25k, 41.7% for AGIs $25k-50k, 60.0% for AGIs $50k-75k, 42.9% for AGIs $75k-100k, 66.7% for AGIs $100k-200k)
Averages for the 2004 tax year for zip code 54836, filed in 2005:
Average Adjusted Gross Income (AGI) in 2004: $42,240 (Individual Income Tax Returns)
Here:
$42,240
State:
$47,735
Salary/wage: $39,163 (reported on 90.0% of returns)
Here:
$39,163
State:
$41,540
(% of AGI for various income ranges: 95.0% for AGIs below $10k, 68.5% for AGIs $10k-25k, 83.6% for AGIs $25k-50k, 82.1% for AGIs $50k-75k, 89.1% for AGIs $75k-100k, 84.9% for AGIs over 100k)
Taxable interest for individuals: $569 (reported on 52.3% of returns)
This zip code:
$569
Wisconsin:
$1,420
(% of AGI for various income ranges: 0.6% for AGIs below $10k, 0.9% for AGIs $10k-25k, 0.8% for AGIs $25k-50k, 1.0% for AGIs $50k-75k, 0.5% for AGIs $75k-100k)
Taxable dividends: $476 (reported on 17.9% of returns)
Here:
$476
State:
$2,869
(% of AGI for various income ranges: 0.2% for AGIs $10k-25k, 0.2% for AGIs $25k-50k, 0.4% for AGIs $50k-75k, 0.1% for AGIs $75k-100k)
Net capital gain/loss: +$812 (reported on 10.2% of returns)
Here:
+$812
State:
+$9,569
Profit/loss from business: +$1,345 (reported on 12.3% of returns)
Here:
+$1,345
State:
+$10,417
IRA payment deduction: $3,133 (reported on 3.2% of returns)
54836:
$3,133
Wisconsin:
$2,900
Total itemized deductions: $14,722 (22% of AGI, reported on 33.6% of returns)
Here:
$14,722
State:
$18,160
Here:
22.1% of AGI
State:
21.1% of AGI
(% of AGI for various income ranges: 11.3% for AGIs $10k-25k, 7.9% for AGIs $25k-50k, 12.3% for AGIs $50k-75k, 14.8% for AGIs $75k-100k, 13.4% for AGIs over 100k)
Charity contributions deductions: $1,352 (2% of AGI, reported on 26.0% of returns)
Here:
$1,352
State:
$2,711
Here:
2.0% of AGI
State:
3.0% of AGI
(% of AGI for various income ranges: 0.9% for AGIs $10k-25k, 0.7% for AGIs $25k-50k, 0.6% for AGIs $50k-75k, 1.6% for AGIs $75k-100k)
Total tax: $4,560 (reported on 79.4% of returns)
54836:
$4,560
State:
$7,114
(% of AGI for various income ranges: 2.2% for AGIs below $10k, 3.5% for AGIs $10k-25k, 6.5% for AGIs $25k-50k, 8.1% for AGIs $50k-75k, 9.6% for AGIs $75k-100k, 17.1% for AGIs over 100k)
Earned income credit: $1,482 (reported on 11.9% of returns)
Here:
$1,482
State:
$1,544
Percentage of individuals using paid preparers for their 2004 taxes: 48.5%
Here:
49%
State:
57%
(% for various income ranges: 35.7% for AGIs below $10k, 52.4% for AGIs $10k-25k, 52.0% for AGIs $25k-50k, 45.5% for AGIs $50k-75k, 47.4% for AGIs $75k-100k, 78.6% for AGIs over 100k)
Likely homosexual households (counted as self-reported same-sex unmarried-partner households)
Lesbian couples: 1.1% of all households
Gay men: 0.0% of all households
Household received Food Stamps/SNAP in the past 12 months: 14 Household did not receive Food Stamps/SNAP in the past 12 months: 376
Women who had a birth in the past 12 months: 6 (6 now married, 0 unmarried) Women who did not have a birth in the past 12 months: 152 (95 now married, 56 unmarried)
Housing units in zip code 54836 with a mortgage: 253 (31 second mortgage, 32 both second mortgage and home equity loan) Houses without a mortgage: 3
Median monthly owner costs for units with a mortgage: $1,309 Median monthly owner costs for units without a mortgage: $521
Residents with income below the poverty level in 2022:
This zip code:
5.7%
Whole state:
10.7%
Residents with income below 50% of the poverty level in 2022:
This zip code:
0.5%
Whole state:
5.7%
Median number of rooms in houses and condos:
Here:
5.7
State:
6.5
Median number of rooms in apartments:
Here:
4.0
State:
4.1
Notable locations in this zip code not listed on our city pages
Lakes, reservoirs, and swamps: Lake Seventeen (A), Bear Lake (B), Summit Lake (C), Black Lake (D), Breitzman Lake (E), Interfalls Lake 78 (F), Belden Swamp (G). Display/hide their locations on the map
Size of family households: 177 2-persons, 35 3-persons, 52 4-persons, 8 5-persons, 18 7-or-more-persons
Size of nonfamily households: 93 1-person, 7 2-persons
178 married couples with children.
82 single-parent households (16 men, 66 women).
99.1% of residents of 54836 zip code speak English at home.
0.7% of residents speak other Indo-European language at home (100% very well).
Foreign born population: 0 (0.0%)
:
0.0%
Whole state:
5.0%
18%American
16%German
12%English
10%Polish
9%Norwegian
5%Finnish
5%Irish
Facilities with environmental interests located in this zip code:
AT&T LONG LINES (RURAL ROUTE in FOXBORO, WI)
(Resource Conservation and Recovery Act (tracking hazardous waste))
Housing units lacking complete plumbing facilities: 14.6% Housing units lacking complete kitchen facilities: 12.8%
53.1%Bottled, tank, or LP gas
19.6%Electricity
16.5%Wood
6.5%Fuel oil, kerosene, etc.
2.9%Other fuel
1.6%No fuel used
0.5%Utility gas
Population in 1990: 1,528.
Place of birth for U.S.-born residents:
This state: 475
Northeast: 20
Midwest: 486
South: 29
West: 45
71% of the 54836 zip code residents lived in the same house 5 years ago. Out of people who lived in different houses, 70% lived in this county. Out of people who lived in different counties, 50% lived in Wisconsin.
96% of the 54836 zip code residents lived in the same house 1 year ago. Out of people who lived in different houses, 42% moved from this county. Out of people who lived in different houses, 32% moved from different county within same state. Out of people who lived in different houses, 26% moved from different state.
Private vs. public school enrollment:
Students in private schools in grades 1 to 8 (elementary and middle school): 76
Here:
51.7%
Wisconsin:
16.7%
Students in private schools in grades 9 to 12 (high school): 12
Here:
18.8%
Wisconsin:
12.5%
Students in private undergraduate colleges:
Here:
0.0%
Wisconsin:
17.5%
Occupation by median earnings in the past 12 months ($)
84,916Health diagnosing and treating practitioners and other technical occupations
84,800Architecture and engineering occupations
81,215Construction and extraction occupations
79,919Installation, maintenance, and repair occupations
73,390Transportation occupations
69,728Production occupations
Top industries in this zip code by the number of employees in 2005:
Administrative and Support and Waste Management and Remediation Services: All Other Support Services (20-49 employees: 1 establishment)
Construction: Electrical Contractors (5-9: 1)
Accommodation and Food Services: Full-Service Restaurants (5-9: 1)
Accommodation and Food Services: Drinking Places (Alcoholic Beverages) (1-4: 2)
Other Services (except Public Administration): Commercial and Industrial Machinery and Equipment (except Automotive and Electronic) Repair and Maintenance (1-4: 1)
Construction: Site Preparation Contractors (1-4: 1)
Administrative and Support and Waste Management and Remediation Services: Other Services to Buildings and Dwellings (1-4: 1)
Professional, Scientific, and Technical Services: Surveying and Mapping (except Geophysical) Services (1-4: 1)
Fatal accident statistics in 2011:
Fatal accident count: 1
Vehicles involved in fatal accidents: 2
Fatal accidents caused by drunken drivers: 1
Fatalities: 2
Persons involved in fatal accidents: 3
Pedestrians involved in fatal accidents: 0
Home Mortgage Disclosure Act Aggregated Statistics For Year 2009 (Based on 2 partial tracts)
A) FHA, FSA/RHS & VA Home Purchase Loans
B) Conventional Home Purchase Loans
C) Refinancings
D) Home Improvement Loans
F) Non-occupant Loans on < 5 Family Dwellings (A B C & D)
G) Loans On Manufactured Home Dwelling (A B C & D)
Number
Average Value
Number
Average Value
Number
Average Value
Number
Average Value
Number
Average Value
Number
Average Value
LOANS ORIGINATED
3
$153,360
14
$109,404
94
$150,583
11
$71,754
39
$162,197
6
$67,577
APPLICATIONS APPROVED, NOT ACCEPTED
0
$0
1
$188,430
9
$178,127
2
$57,190
3
$217,393
1
$129,780
APPLICATIONS DENIED
0
$0
6
$65,500
24
$140,255
3
$66,353
7
$90,027
3
$92,993
APPLICATIONS WITHDRAWN
1
$79,550
3
$168,270
15
$152,212
1
$231,690
5
$162,990
1
$83,580
FILES CLOSED FOR INCOMPLETENESS
1
$156,170
0
$0
1
$87,980
0
$0
0
$0
0
$0
Aggregated Statistics For Year 2008 (Based on 2 partial tracts)
A) FHA, FSA/RHS & VA Home Purchase Loans
B) Conventional Home Purchase Loans
C) Refinancings
D) Home Improvement Loans
F) Non-occupant Loans on < 5 Family Dwellings (A B C & D)
G) Loans On Manufactured Home Dwelling (A B C & D)
Number
Average Value
Number
Average Value
Number
Average Value
Number
Average Value
Number
Average Value
Number
Average Value
LOANS ORIGINATED
2
$123,725
15
$148,791
50
$134,821
7
$43,101
22
$144,490
4
$101,182
APPLICATIONS APPROVED, NOT ACCEPTED
0
$0
2
$147,190
9
$133,931
1
$129,040
3
$142,120
3
$74,177
APPLICATIONS DENIED
0
$0
2
$91,100
29
$134,188
6
$92,750
4
$125,560
5
$73,906
APPLICATIONS WITHDRAWN
0
$0
1
$151,770
8
$155,989
0
$0
1
$116,950
0
$0
FILES CLOSED FOR INCOMPLETENESS
0
$0
0
$0
1
$205,300
0
$0
0
$0
0
$0
Aggregated Statistics For Year 2007 (Based on 2 partial tracts)
A) FHA, FSA/RHS & VA Home Purchase Loans
B) Conventional Home Purchase Loans
C) Refinancings
D) Home Improvement Loans
F) Non-occupant Loans on < 5 Family Dwellings (A B C & D)
G) Loans On Manufactured Home Dwelling (A B C & D)
Number
Average Value
Number
Average Value
Number
Average Value
Number
Average Value
Number
Average Value
Number
Average Value
LOANS ORIGINATED
2
$127,395
32
$155,668
50
$135,547
15
$72,049
25
$169,296
7
$87,041
APPLICATIONS APPROVED, NOT ACCEPTED
0
$0
3
$150,427
12
$146,854
2
$42,710
3
$129,777
1
$33,360
APPLICATIONS DENIED
1
$86,880
5
$84,464
36
$130,143
7
$87,879
4
$91,558
2
$67,270
APPLICATIONS WITHDRAWN
0
$0
3
$123,177
11
$177,235
2
$68,190
1
$240,860
1
$58,660
FILES CLOSED FOR INCOMPLETENESS
0
$0
1
$182,930
4
$146,640
0
$0
0
$0
0
$0
Aggregated Statistics For Year 2006 (Based on 2 partial tracts)
A) FHA, FSA/RHS & VA Home Purchase Loans
B) Conventional Home Purchase Loans
C) Refinancings
D) Home Improvement Loans
F) Non-occupant Loans on < 5 Family Dwellings (A B C & D)
G) Loans On Manufactured Home Dwelling (A B C & D)
Number
Average Value
Number
Average Value
Number
Average Value
Number
Average Value
Number
Average Value
Number
Average Value
LOANS ORIGINATED
1
$137,840
29
$127,008
55
$123,571
18
$47,231
26
$127,027
7
$59,074
APPLICATIONS APPROVED, NOT ACCEPTED
0
$0
1
$140,410
11
$137,375
1
$47,290
1
$294,380
0
$0
APPLICATIONS DENIED
0
$0
8
$82,898
36
$120,265
5
$85,418
2
$72,955
4
$63,788
APPLICATIONS WITHDRAWN
0
$0
3
$184,890
17
$168,744
1
$75,150
2
$262,850
0
$0
FILES CLOSED FOR INCOMPLETENESS
0
$0
0
$0
5
$169,002
0
$0
0
$0
0
$0
Aggregated Statistics For Year 2005 (Based on 2 partial tracts)
A) FHA, FSA/RHS & VA Home Purchase Loans
B) Conventional Home Purchase Loans
C) Refinancings
D) Home Improvement Loans
F) Non-occupant Loans on < 5 Family Dwellings (A B C & D)
G) Loans On Manufactured Home Dwelling (A B C & D)
Number
Average Value
Number
Average Value
Number
Average Value
Number
Average Value
Number
Average Value
Number
Average Value
LOANS ORIGINATED
2
$94,950
39
$128,470
68
$119,587
15
$47,463
31
$132,425
7
$81,543
APPLICATIONS APPROVED, NOT ACCEPTED
0
$0
2
$117,310
5
$89,378
1
$29,330
1
$133,080
0
$0
APPLICATIONS DENIED
1
$53,160
6
$154,522
36
$104,196
6
$61,467
4
$152,872
5
$90,624
APPLICATIONS WITHDRAWN
0
$0
6
$113,830
15
$145,443
3
$85,417
3
$89,940
1
$79,190
FILES CLOSED FOR INCOMPLETENESS
0
$0
1
$217,760
7
$147,740
0
$0
1
$325,170
0
$0
Aggregated Statistics For Year 2004 (Based on 2 partial tracts)
A) FHA, FSA/RHS & VA Home Purchase Loans
B) Conventional Home Purchase Loans
C) Refinancings
D) Home Improvement Loans
F) Non-occupant Loans on < 5 Family Dwellings (A B C & D)
G) Loans On Manufactured Home Dwelling (A B C & D)
Number
Average Value
Number
Average Value
Number
Average Value
Number
Average Value
Number
Average Value
Number
Average Value
LOANS ORIGINATED
1
$126,110
32
$126,638
61
$117,354
12
$54,348
30
$140,530
6
$66,048
APPLICATIONS APPROVED, NOT ACCEPTED
0
$0
3
$117,190
5
$115,112
0
$0
2
$120,610
0
$0
APPLICATIONS DENIED
0
$0
5
$179,268
30
$118,094
3
$57,800
5
$142,240
3
$48,390
APPLICATIONS WITHDRAWN
0
$0
3
$97,637
25
$116,447
2
$66,905
2
$116,580
2
$62,870
FILES CLOSED FOR INCOMPLETENESS
0
$0
1
$31,160
7
$116,003
0
$0
1
$68,550
0
$0
Aggregated Statistics For Year 2003 (Based on 2 partial tracts)
A) FHA, FSA/RHS & VA Home Purchase Loans
B) Conventional Home Purchase Loans
C) Refinancings
D) Home Improvement Loans
F) Non-occupant Loans on < 5 Family Dwellings (A B C & D)
Number
Average Value
Number
Average Value
Number
Average Value
Number
Average Value
Number
Average Value
LOANS ORIGINATED
1
$98,980
29
$104,367
136
$106,446
7
$40,850
47
$118,147
APPLICATIONS APPROVED, NOT ACCEPTED
0
$0
1
$98,250
11
$89,684
0
$0
3
$119,147
APPLICATIONS DENIED
0
$0
6
$75,213
43
$90,729
2
$32,260
6
$99,227
APPLICATIONS WITHDRAWN
0
$0
4
$150,765
19
$109,189
0
$0
3
$142,120
FILES CLOSED FOR INCOMPLETENESS
0
$0
1
$57,190
5
$94,656
0
$0
1
$54,620
Aggregated Statistics For Year 2002 (Based on 2 partial tracts)
A) FHA, FSA/RHS & VA Home Purchase Loans
B) Conventional Home Purchase Loans
C) Refinancings
D) Home Improvement Loans
F) Non-occupant Loans on < 5 Family Dwellings (A B C & D)
Number
Average Value
Number
Average Value
Number
Average Value
Number
Average Value
Number
Average Value
LOANS ORIGINATED
1
$60,860
33
$122,722
117
$96,980
6
$35,072
45
$119,780
APPLICATIONS APPROVED, NOT ACCEPTED
0
$0
3
$77,840
10
$84,941
1
$77,350
2
$113,830
APPLICATIONS DENIED
0
$0
4
$84,868
24
$88,458
2
$34,095
3
$77,597
APPLICATIONS WITHDRAWN
0
$0
4
$108,148
15
$95,121
1
$5,870
3
$93,240
FILES CLOSED FOR INCOMPLETENESS
0
$0
0
$0
5
$103,454
0
$0
0
$0
Aggregated Statistics For Year 2001 (Based on 2 partial tracts)
A) FHA, FSA/RHS & VA Home Purchase Loans
B) Conventional Home Purchase Loans
C) Refinancings
D) Home Improvement Loans
F) Non-occupant Loans on < 5 Family Dwellings (A B C & D)
Number
Average Value
Number
Average Value
Number
Average Value
Number
Average Value
Number
Average Value
LOANS ORIGINATED
2
$101,730
23
$95,300
106
$82,648
12
$34,430
36
$99,960
APPLICATIONS APPROVED, NOT ACCEPTED
0
$0
3
$92,750
10
$77,719
1
$24,200
2
$69,105
APPLICATIONS DENIED
0
$0
2
$54,625
23
$73,766
1
$20,530
1
$30,430
APPLICATIONS WITHDRAWN
0
$0
2
$99,530
18
$76,354
1
$16,500
2
$94,035
FILES CLOSED FOR INCOMPLETENESS
0
$0
0
$0
4
$101,365
0
$0
0
$0
Aggregated Statistics For Year 2000 (Based on 2 partial tracts)
B) Conventional Home Purchase Loans
C) Refinancings
D) Home Improvement Loans
F) Non-occupant Loans on < 5 Family Dwellings (A B C & D)
Number
Average Value
Number
Average Value
Number
Average Value
Number
Average Value
LOANS ORIGINATED
33
$94,516
36
$67,913
13
$37,957
16
$98,891
APPLICATIONS APPROVED, NOT ACCEPTED
5
$61,516
4
$61,222
2
$35,925
1
$84,680
APPLICATIONS DENIED
10
$66,208
22
$51,957
4
$26,120
0
$0
APPLICATIONS WITHDRAWN
1
$115,850
14
$56,011
1
$18,330
1
$78,820
FILES CLOSED FOR INCOMPLETENESS
0
$0
2
$108,145
0
$0
0
$0
Aggregated Statistics For Year 1999 (Based on 1 partial tract)
B) Conventional Home Purchase Loans
C) Refinancings
D) Home Improvement Loans
F) Non-occupant Loans on < 5 Family Dwellings (A B C & D)


 Nearest zip codes: 54880, 55797, 55808, 55749, 54874, 55807.


