Estimated zip code population in 2022: 2,387 Zip code population in 2010: 2,226 Zip code population in 2000: 2,192
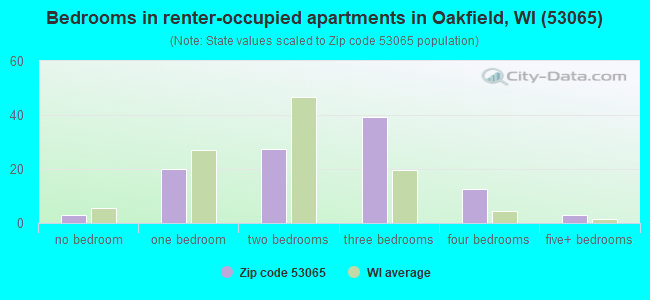
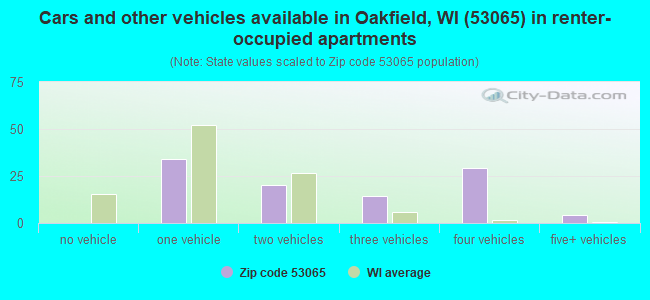
Houses and condos: 946 Renter-occupied apartments: 106
% of renters here:
12%
State:
32%
March 2022 cost of living index in zip code 53065: 86.6 (less than average, U.S. average is 100)
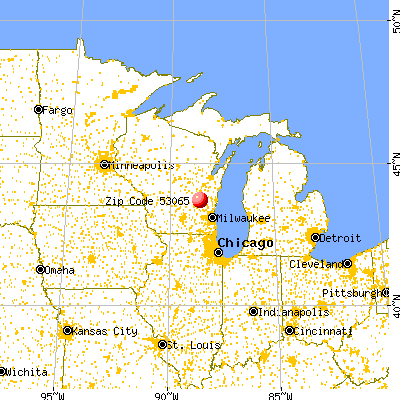
Land area: 44.7 sq. mi. Water area: 0.3 sq. mi.
Population density: 53 people per square mile
(very low).
OSM Map
General Map
Google Map
MSN Map
OSM Map
General Map
Google Map
MSN Map
OSM Map
General Map
Google Map
MSN Map
OSM Map
General Map
Google Map
MSN Map
Please wait while loading the map...
Real estate property taxes paid for housing units in 2022:
This zip code:
1.5% ($3,875)
Wisconsin:
1.4% ($3,497)
Median real estate property taxes paid for housing units with mortgages in 2022: $3,793 (1.5%) Median real estate property taxes paid for housing units with no mortgage in 2022: $3,960 (1.4%)
Business Search- 14 Million verified businesses
Males: 1,222
(51.2%)
Females: 1,165
(48.8%)
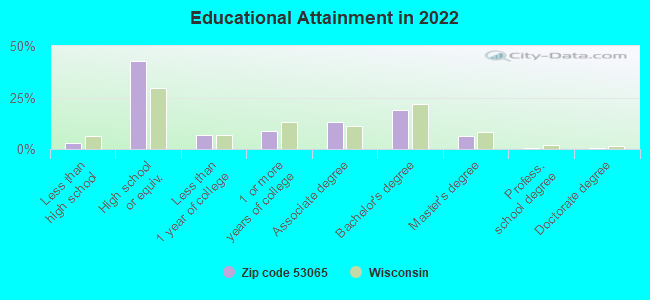
For population 25 years and over in 53065:
High school or higher: 96.5%
Bachelor's degree or higher: 26.1%
Graduate or professional degree: 7.3%
Unemployed: 1.2%
Mean travel time to work (commute): 22.6 minutes
For population 15 years and over in 53065:
Never married: 22.8%
Now married: 63.9%
Separated: 0.3%
Widowed: 6.6%
Divorced: 6.3%
Zip code 53065 compared to state average:
Median household income above state average.
Unemployed percentage below state average.
Black race population percentage significantly below state average.
Hispanic race population percentage significantly below state average.
Median age above state average.
Foreign-born population percentage significantly below state average.
Renting percentage significantly below state average.
Length of stay since moving in above state average.
Estimated median house/condo value in 2022: $263,288
53065:
$263,288
Wisconsin:
$252,800
According to our research of Wisconsin and other state lists, there were 2 registered sex offenders living in 53065 zip code as of May 23, 2024. The ratio of all residents to sex offenders in zip code 53065 is 1,190 to 1. The ratio of registered sex offenders to all residents in this zip code is much lower than the state average.
Median resident age:
This zip code:
46.4 years
Wisconsin median age:
40.4 years
Average household size:
This zip code:
2.6 people
Wisconsin:
2.3 people
Averages for the 2020 tax year for zip code 53065, filed in 2021:
Average Adjusted Gross Income (AGI) in 2020: $69,007 (Individual Income Tax Returns)
Here:
$69,007
State:
$72,319
Salary/wage: $61,764 (reported on 84.8% of returns)
Here:
$61,764
State:
$59,242
(% of AGI for various income ranges: 1192.9% for AGIs below $25k, 3752.9% for AGIs $25k-50k, 6484.2% for AGIs $50k-75k, 9632.0% for AGIs $75k-100k, 16842.9% for AGIs $100k-200k)
Taxable interest for individuals: $441 (reported on 43.8% of returns)
This zip code:
$441
Wisconsin:
$1,431
(% of AGI for various income ranges: 21.8% for AGIs below $25k, 29.4% for AGIs $25k-50k, 22.5% for AGIs $50k-75k, 40.0% for AGIs $75k-100k, 30.0% for AGIs $100k-200k)
Ordinary dividends: $2,313 (reported on 21.9% of returns)
Here:
$2,313
State:
$6,481
(% of AGI for various income ranges: 29.4% for AGIs below $25k, 42.4% for AGIs $25k-50k, 59.2% for AGIs $50k-75k, 118.0% for AGIs $75k-100k, 157.9% for AGIs $100k-200k)
Net capital gain/loss in AGI: +$4,205 (reported on 20.0% of returns)
Here:
+$4,205
State:
+$18,329
(% of AGI for various income ranges: 28.2% for AGIs below $25k, 37.1% for AGIs $25k-50k, 77.5% for AGIs $50k-75k, 86.0% for AGIs $75k-100k, 423.6% for AGIs $100k-200k)
Profit/loss from business: +$9,108 (reported on 11.4% of returns)
Here:
+$9,108
State:
+$14,562
(% of AGI for various income ranges: 107.1% for AGIs $25k-50k, 509.2% for AGIs $50k-75k, 214.3% for AGIs $100k-200k)
Taxable individual retirement arrangement distribution: $14,680 (reported on 14.3% of returns)
53065:
$14,680
Wisconsin:
$19,348
(% of AGI for various income ranges: 118.2% for AGIs below $25k, 231.2% for AGIs $25k-50k, 288.3% for AGIs $50k-75k, 360.0% for AGIs $75k-100k, 644.3% for AGIs $100k-200k)
Total itemized deductions: $31,125 (reported on 3.8% of returns)
Here:
$31,125
State:
$33,000
(% of AGI for various income ranges: 276.5% for AGIs $25k-50k, 553.6% for AGIs $100k-200k)
Charity contributions: $3,900 (reported on 1.9% of returns)
Here:
$3,900
State:
$12,044
(% of AGI for various income ranges: 65.0% for AGIs $50k-75k)
Taxes paid: $9,050 (reported on 3.8% of returns)
53065:
$9,050
State:
$8,228
(% of AGI for various income ranges: 91.2% for AGIs $25k-50k, 147.9% for AGIs $100k-200k)
Earned income credit: $1,883 (reported on 5.7% of returns)
Here:
$1,883
State:
$2,155
(% of AGI for various income ranges: 32.9% for AGIs below $25k, 33.5% for AGIs $25k-50k)
Percentage of individuals using paid preparers for their 2020 taxes: 92.4%
Here:
92%
State:
94%
(% for various income ranges: 88.5% for AGIs below $25k, 91.3% for AGIs $25k-50k, 94.1% for AGIs $50k-75k, 92.9% for AGIs $75k-100k, 95.5% for AGIs $100k-200k, 100.0% for AGIs over 200k)
Averages for the 2012 tax year for zip code 53065, filed in 2013:
Average Adjusted Gross Income (AGI) in 2012: $53,212 (Individual Income Tax Returns)
Here:
$53,212
State:
$57,939
Salary/wage: $45,822 (reported on 88.3% of returns)
Here:
$45,822
State:
$48,248
(% of AGI for various income ranges: 76.2% for AGIs below $25k, 74.2% for AGIs $25k-50k, 78.0% for AGIs $50k-75k, 82.9% for AGIs $75k-100k, 70.9% for AGIs $100k-200k)
Taxable interest for individuals: $478 (reported on 44.7% of returns)
This zip code:
$478
Wisconsin:
$1,224
(% of AGI for various income ranges: 1.2% for AGIs below $25k, 0.7% for AGIs $25k-50k, 0.3% for AGIs $50k-75k, 0.2% for AGIs $75k-100k, 0.2% for AGIs $100k-200k)
Ordinary dividends: $1,912 (reported on 23.3% of returns)
Here:
$1,912
State:
$5,137
(% of AGI for various income ranges: 1.2% for AGIs below $25k, 0.8% for AGIs $25k-50k, 0.6% for AGIs $50k-75k, 0.6% for AGIs $75k-100k, 1.1% for AGIs $100k-200k)
Net capital gain/loss in AGI: +$3,689 (reported on 18.4% of returns)
Here:
+$3,689
State:
+$11,137
(% of AGI for various income ranges: 0.5% for AGIs $25k-50k, 1.5% for AGIs $75k-100k, 2.6% for AGIs $100k-200k)
Profit/loss from business: +$9,717 (reported on 11.7% of returns)
Here:
+$9,717
State:
+$11,943
(% of AGI for various income ranges: 2.1% for AGIs below $25k, 1.1% for AGIs $25k-50k, 3.0% for AGIs $50k-75k, 3.6% for AGIs $100k-200k)
Taxable individual retirement arrangement distribution: $7,886 (reported on 13.6% of returns)
53065:
$7,886
Wisconsin:
$14,087
(% of AGI for various income ranges: 3.8% for AGIs below $25k, 3.2% for AGIs $25k-50k, 2.3% for AGIs $50k-75k, 3.3% for AGIs $75k-100k)
Total itemized deductions: $18,519 (21% of AGI, reported on 35.9% of returns)
Here:
$18,519
State:
$22,257
Here:
20.9% of AGI
State:
20.1% of AGI
(% of AGI for various income ranges: 12.0% for AGIs $25k-50k, 11.5% for AGIs $50k-75k, 14.4% for AGIs $75k-100k, 14.7% for AGIs $100k-200k)
Charity contributions: $2,055 (reported on 30.1% of returns)
Here:
$2,055
State:
$3,370
(% of AGI for various income ranges: 0.7% for AGIs $25k-50k, 1.1% for AGIs $50k-75k, 1.3% for AGIs $75k-100k, 1.6% for AGIs $100k-200k)
Taxes paid: $9,030 (reported on 35.9% of returns)
53065:
$9,030
State:
$10,731
(% of AGI for various income ranges: 4.4% for AGIs $25k-50k, 5.1% for AGIs $50k-75k, 6.8% for AGIs $75k-100k, 8.4% for AGIs $100k-200k)
Earned income credit: $1,710 (reported on 9.7% of returns)
Here:
$1,710
State:
$2,094
(% of AGI for various income ranges: 2.8% for AGIs below $25k, 0.7% for AGIs $25k-50k)
Percentage of individuals using paid preparers for their 2012 taxes: 60.2%
Here:
60%
State:
54%
(% for various income ranges: 48.5% for AGIs below $25k, 58.3% for AGIs $25k-50k, 66.7% for AGIs $50k-75k, 66.7% for AGIs $75k-100k, 76.9% for AGIs $100k-200k)
Averages for the 2004 tax year for zip code 53065, filed in 2005:
Average Adjusted Gross Income (AGI) in 2004: $43,577 (Individual Income Tax Returns)
Here:
$43,577
State:
$47,735
Salary/wage: $40,679 (reported on 89.1% of returns)
Here:
$40,679
State:
$41,540
(% of AGI for various income ranges: 136.9% for AGIs below $10k, 73.1% for AGIs $10k-25k, 85.7% for AGIs $25k-50k, 87.9% for AGIs $50k-75k, 84.3% for AGIs $75k-100k, 70.5% for AGIs over 100k)
Taxable interest for individuals: $658 (reported on 61.1% of returns)
This zip code:
$658
Wisconsin:
$1,420
(% of AGI for various income ranges: 6.1% for AGIs below $10k, 4.6% for AGIs $10k-25k, 0.7% for AGIs $25k-50k, 0.4% for AGIs $50k-75k, 0.6% for AGIs $75k-100k, 0.4% for AGIs over 100k)
Taxable dividends: $993 (reported on 27.5% of returns)
Here:
$993
State:
$2,869
(% of AGI for various income ranges: 3.7% for AGIs below $10k, 0.8% for AGIs $10k-25k, 0.3% for AGIs $25k-50k, 0.5% for AGIs $50k-75k, 0.5% for AGIs $75k-100k, 1.1% for AGIs over 100k)
Net capital gain/loss: +$4,991 (reported on 21.5% of returns)
Here:
+$4,991
State:
+$9,569
(% of AGI for various income ranges: 1.3% for AGIs below $10k, 0.9% for AGIs $10k-25k, 0.9% for AGIs $25k-50k, 0.7% for AGIs $50k-75k, 3.6% for AGIs $75k-100k, 6.8% for AGIs over 100k)
Profit/loss from business: +$8,656 (reported on 12.6% of returns)
Here:
+$8,656
State:
+$10,417
(% of AGI for various income ranges: 3.4% for AGIs below $10k, 3.4% for AGIs $10k-25k, 2.7% for AGIs $25k-50k, 1.7% for AGIs $50k-75k, 4.0% for AGIs $75k-100k, 1.3% for AGIs over 100k)
Profit/loss from farming: +$1,370 (reported on 5.3% of returns)
Here:
+$1,370
State:
-$2,654
IRA payment deduction: $2,900 (reported on 3.0% of returns)
53065:
$2,900
Wisconsin:
$2,900
Total itemized deductions: $15,343 (22% of AGI, reported on 39.6% of returns)
Here:
$15,343
State:
$18,160
Here:
22.3% of AGI
State:
21.1% of AGI
(% of AGI for various income ranges: 14.5% for AGIs $10k-25k, 11.3% for AGIs $25k-50k, 14.9% for AGIs $50k-75k, 15.5% for AGIs $75k-100k, 14.2% for AGIs over 100k)
Charity contributions deductions: $1,960 (3% of AGI, reported on 34.7% of returns)
Here:
$1,960
State:
$2,711
Here:
2.7% of AGI
State:
3.0% of AGI
(% of AGI for various income ranges: 1.4% for AGIs $10k-25k, 1.0% for AGIs $25k-50k, 1.4% for AGIs $50k-75k, 1.8% for AGIs $75k-100k, 2.5% for AGIs over 100k)
Total tax: $4,796 (reported on 81.4% of returns)
53065:
$4,796
State:
$7,114
(% of AGI for various income ranges: 2.7% for AGIs below $10k, 4.8% for AGIs $10k-25k, 7.1% for AGIs $25k-50k, 7.4% for AGIs $50k-75k, 9.8% for AGIs $75k-100k, 15.1% for AGIs over 100k)
Earned income credit: $1,459 (reported on 6.0% of returns)
Here:
$1,459
State:
$1,544
Percentage of individuals using paid preparers for their 2004 taxes: 59.7%
Here:
60%
State:
57%
(% for various income ranges: 47.8% for AGIs below $10k, 58.2% for AGIs $10k-25k, 59.8% for AGIs $25k-50k, 67.0% for AGIs $50k-75k, 64.5% for AGIs $75k-100k, 66.0% for AGIs over 100k)
Household received Food Stamps/SNAP in the past 12 months: 46 Household did not receive Food Stamps/SNAP in the past 12 months: 857
Women who had a birth in the past 12 months: 11 (5 now married, 5 unmarried) Women who did not have a birth in the past 12 months: 461 (259 now married, 202 unmarried)
Housing units in zip code 53065 with a mortgage: 474 (51 second mortgage, 4 home equity loan, 35 both second mortgage and home equity loan) Houses without a mortgage: 15
Median monthly owner costs for units with a mortgage: $1,639 Median monthly owner costs for units without a mortgage: $705
Residents with income below the poverty level in 2022:
This zip code:
4.3%
Whole state:
10.7%
Residents with income below 50% of the poverty level in 2022:
This zip code:
1.3%
Whole state:
5.7%
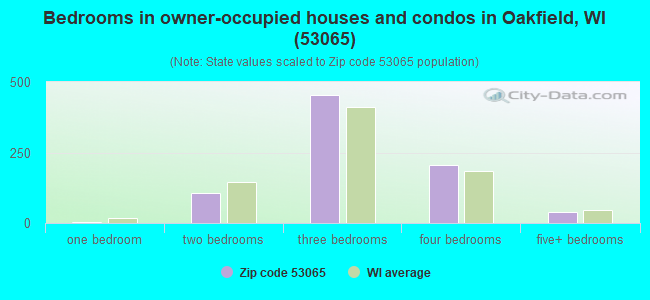
Median number of rooms in houses and condos:
Here:
6.9
State:
6.5
Median number of rooms in apartments:
Here:
5.4
State:
4.1
Notable locations in this zip code not listed on our city pages
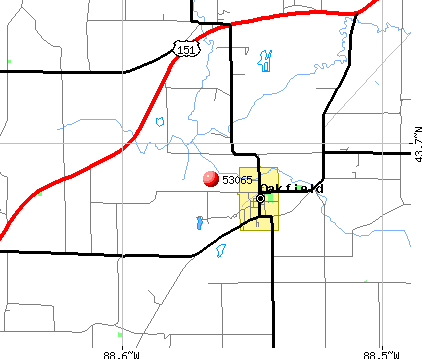
Notable locations in zip code 53065: Lamartine Volunteer Fire Department (A), Oakfield Volunteer Fire Department (B). Display/hide their locations on the map
Churches in zip code 53065 include: Lamartine United Methodist Church (A), Oakfield United Methodist Church (B), Saint James Catholic Church (C), Saint Lukes Lutheran Church (D). Display/hide their locations on the map
348 married couples with children.
56 single-parent households (30 men, 26 women).
98.0% of residents of 53065 zip code speak English at home.
0.7% of residents speak Spanish at home (73% very well, 20% well, 7% not well).
0.3% of residents speak other Indo-European language at home (100% very well).
1.1% of residents speak Asian or Pacific Island language at home (85% very well, 15% well).
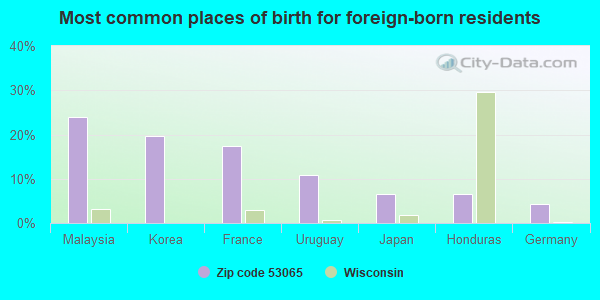
Foreign born population: 46 (2.0%) (49.0% of them are naturalized citizens)
This zip code:
2.0%
Whole state:
5.0%
24%Malaysia
20%Korea
17%France
11%Uruguay
7%Japan
7%Honduras
4%Germany
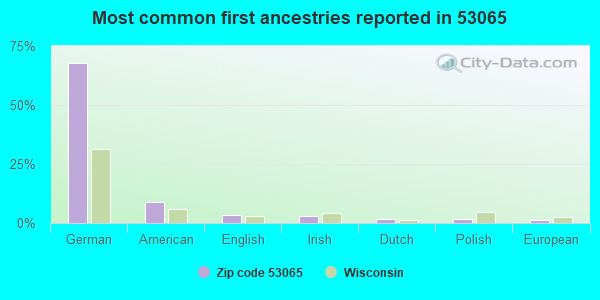
68%German
9%American
3%English
3%Irish
2%Dutch
2%Polish
1%European
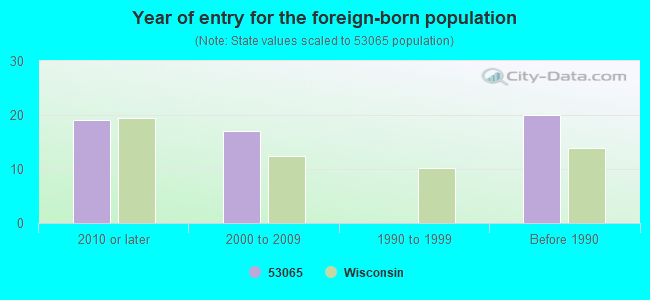
Year of entry for the foreign-born population
192010 or later
172000 to 2009
01990 to 1999
20Before 1990
Facilities with environmental interests located in this zip code:
D MUELLER INDUSTRIES INC (201 MAIN ST in OAKFIELD, WI)
(Resource Conservation and Recovery Act (tracking hazardous waste)) Alternative names: ROMORT MFG CO INC
Housing units lacking complete plumbing facilities: 2.0% Housing units lacking complete kitchen facilities: 1.6%
51.5%Utility gas
20.8%Bottled, tank, or LP gas
12.0%Electricity
11.6%Fuel oil, kerosene, etc.
2.7%Wood
1.8%No fuel used
Population in 1990: 2,377.
Place of birth for U.S.-born residents:
This state: 2,104
Northeast: 11
Midwest: 116
South: 51
West: 37
65% of the 53065 zip code residents lived in the same house 5 years ago. Out of people who lived in different houses, 70% lived in this county. Out of people who lived in different counties, 50% lived in Wisconsin.
93% of the 53065 zip code residents lived in the same house 1 year ago. Out of people who lived in different houses, 81% moved from this county. Out of people who lived in different houses, 12% moved from different county within same state.
Private vs. public school enrollment:
Students in private schools in grades 1 to 8 (elementary and middle school): 16
Here:
7.0%
Wisconsin:
16.7%
Students in private schools in grades 9 to 12 (high school): 19
Here:
13.3%
Wisconsin:
12.5%
Students in private undergraduate colleges: 8
Here:
10.9%
Wisconsin:
17.5%
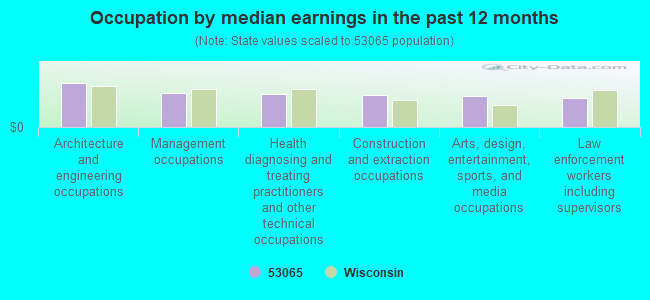
Occupation by median earnings in the past 12 months ($)
111,837Architecture and engineering occupations
86,384Management occupations
83,259Health diagnosing and treating practitioners and other technical occupations
81,771Construction and extraction occupations
79,998Arts, design, entertainment, sports, and media occupations
73,104Law enforcement workers including supervisors
Companies with federal contracts located in this zip code:
LE FEBRE STONE (N2712 CENTER LINE RD in OAKFIELD, WI; small business) 14 employees, $500000 revenue.
$18,000 with U.S. Fish and Wildlife Service for Miscellaneous Items. Signed on 2000-03-15. Completion date: 2000-07-15.
Top industries in this zip code by the number of employees in 2005:
Finance and Insurance: Commercial Banking (20-49 employees: 1 establishment)
Health Care and Social Assistance: Child Day Care Services (10-19: 1)
Construction: Plumbing, Heating, and Air-Conditioning Contractors (5-9: 1, 1-4: 1)
Accommodation and Food Services: Drinking Places (Alcoholic Beverages) (5-9: 1)
Home Mortgage Disclosure Act Aggregated Statistics For Year 2009 (Based on 2 partial tracts)
A) FHA, FSA/RHS & VA Home Purchase Loans
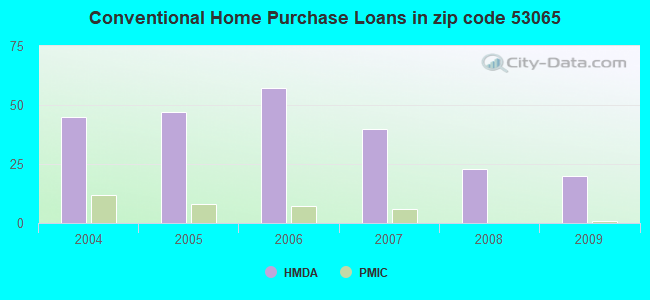
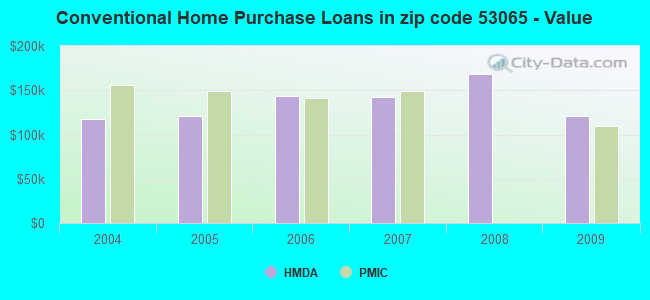
B) Conventional Home Purchase Loans
C) Refinancings
D) Home Improvement Loans
F) Non-occupant Loans on < 5 Family Dwellings (A B C & D)
G) Loans On Manufactured Home Dwelling (A B C & D)
Number
Average Value
Number
Average Value
Number
Average Value
Number
Average Value
Number
Average Value
Number
Average Value
LOANS ORIGINATED
7
$144,284
20
$120,390
172
$153,092
12
$78,944
13
$132,497
5
$52,892
APPLICATIONS APPROVED, NOT ACCEPTED
1
$121,870
1
$84,370
8
$173,800
2
$49,835
0
$0
1
$21,220
APPLICATIONS DENIED
2
$114,715
8
$47,058
29
$154,587
2
$35,525
1
$224,990
8
$52,300
APPLICATIONS WITHDRAWN
0
$0
2
$118,665
19
$189,232
1
$84,860
0
$0
0
$0
FILES CLOSED FOR INCOMPLETENESS
0
$0
0
$0
5
$134,600
0
$0
0
$0
0
$0
Aggregated Statistics For Year 2008 (Based on 2 partial tracts)
A) FHA, FSA/RHS & VA Home Purchase Loans
B) Conventional Home Purchase Loans
C) Refinancings
D) Home Improvement Loans
F) Non-occupant Loans on < 5 Family Dwellings (A B C & D)
G) Loans On Manufactured Home Dwelling (A B C & D)
Number
Average Value
Number
Average Value
Number
Average Value
Number
Average Value
Number
Average Value
Number
Average Value
LOANS ORIGINATED
7
$153,800
23
$167,906
90
$161,490
13
$70,405
12
$177,295
1
$90,790
APPLICATIONS APPROVED, NOT ACCEPTED
1
$168,740
1
$308,870
7
$153,730
1
$23,190
0
$0
0
$0
APPLICATIONS DENIED
1
$242,750
2
$113,235
29
$155,625
4
$57,235
0
$0
2
$65,130
APPLICATIONS WITHDRAWN
0
$0
2
$198,100
13
$139,518
0
$0
0
$0
0
$0
FILES CLOSED FOR INCOMPLETENESS
1
$106,570
0
$0
4
$128,160
0
$0
0
$0
0
$0
Aggregated Statistics For Year 2007 (Based on 2 partial tracts)
A) FHA, FSA/RHS & VA Home Purchase Loans
B) Conventional Home Purchase Loans
C) Refinancings
D) Home Improvement Loans
F) Non-occupant Loans on < 5 Family Dwellings (A B C & D)
G) Loans On Manufactured Home Dwelling (A B C & D)
Number
Average Value
Number
Average Value
Number
Average Value
Number
Average Value
Number
Average Value
Number
Average Value
LOANS ORIGINATED
2
$187,490
40
$142,482
79
$127,928
20
$56,272
8
$87,579
5
$51,116
APPLICATIONS APPROVED, NOT ACCEPTED
0
$0
1
$87,330
5
$141,606
1
$108,550
0
$0
0
$0
APPLICATIONS DENIED
1
$138,650
4
$115,332
32
$142,901
5
$50,622
3
$136,507
3
$47,037
APPLICATIONS WITHDRAWN
0
$0
1
$128,280
12
$157,189
1
$98,680
1
$140,620
0
$0
FILES CLOSED FOR INCOMPLETENESS
0
$0
0
$0
3
$199,990
0
$0
0
$0
0
$0
Aggregated Statistics For Year 2006 (Based on 2 partial tracts)
A) FHA, FSA/RHS & VA Home Purchase Loans
B) Conventional Home Purchase Loans
C) Refinancings
D) Home Improvement Loans
F) Non-occupant Loans on < 5 Family Dwellings (A B C & D)
G) Loans On Manufactured Home Dwelling (A B C & D)
Number
Average Value
Number
Average Value
Number
Average Value
Number
Average Value
Number
Average Value
Number
Average Value
LOANS ORIGINATED
3
$137,660
57
$143,605
81
$117,259
13
$40,421
13
$114,089
3
$49,670
APPLICATIONS APPROVED, NOT ACCEPTED
0
$0
3
$108,220
11
$140,260
1
$28,120
0
$0
1
$17,270
APPLICATIONS DENIED
0
$0
8
$59,886
28
$135,914
3
$130,917
1
$94,240
7
$33,129
APPLICATIONS WITHDRAWN
0
$0
5
$105,488
19
$130,803
1
$30,590
1
$56,250
0
$0
FILES CLOSED FOR INCOMPLETENESS
0
$0
0
$0
9
$168,852
0
$0
0
$0
0
$0
Aggregated Statistics For Year 2005 (Based on 2 partial tracts)
A) FHA, FSA/RHS & VA Home Purchase Loans
B) Conventional Home Purchase Loans
C) Refinancings
D) Home Improvement Loans
F) Non-occupant Loans on < 5 Family Dwellings (A B C & D)
G) Loans On Manufactured Home Dwelling (A B C & D)
Number
Average Value
Number
Average Value
Number
Average Value
Number
Average Value
Number
Average Value
Number
Average Value
LOANS ORIGINATED
3
$136,673
47
$120,946
99
$136,916
19
$39,005
9
$112,002
7
$60,689
APPLICATIONS APPROVED, NOT ACCEPTED
0
$0
8
$115,270
9
$177,843
1
$27,140
1
$96,710
2
$25,165
APPLICATIONS DENIED
1
$102,630
9
$70,611
49
$155,874
4
$34,292
3
$122,527
8
$47,490
APPLICATIONS WITHDRAWN
0
$0
3
$147,857
21
$153,706
1
$55,260
0
$0
0
$0
FILES CLOSED FOR INCOMPLETENESS
0
$0
1
$166,770
10
$172,542
0
$0
0
$0
0
$0
Aggregated Statistics For Year 2004 (Based on 2 partial tracts)
A) FHA, FSA/RHS & VA Home Purchase Loans
B) Conventional Home Purchase Loans
C) Refinancings
D) Home Improvement Loans
F) Non-occupant Loans on < 5 Family Dwellings (A B C & D)
G) Loans On Manufactured Home Dwelling (A B C & D)
Detailed PMIC statistics for the following Tracts:0419.00
2003 - 2018 National Fire Incident Reporting System (NFIRS) incidents
According to the data from the years 2003 - 2018 the average number of fires per year is 15. The highest number of fire incidents - 34 took place in 2012, and the least - 3 in 2004. The data has a rising trend.
When looking into fire subcategories, the most incidents belonged to: Outside Fires (49.0%), and Structure Fires (33.9%).
Fire incident types reported to NFIRS in Zip Code 53065


+$1,370
-$2,654
 Nearest zip codes: 53006, 54974, 54932, 53048, 54935, 53050.


 According to the data from the years 2003 - 2018 the average number of fires per year is 15. The highest number of fire incidents - 34 took place in 2012, and the least - 3 in 2004. The data has a rising trend.
 When looking into fire subcategories, the most incidents belonged to: Outside Fires (49.0%), and Structure Fires (33.9%).