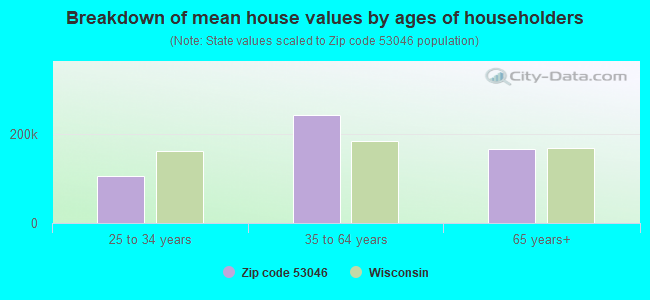
Estimated median house/condo value in 2022: $233,026
53046:
$233,026
Wisconsin:
$252,800
Median resident age:
This zip code:
42.3 years
Wisconsin median age:
40.4 years
Average household size:
This zip code:
2.1 people
Wisconsin:
2.3 people
Averages for the 2020 tax year for zip code 53046, filed in 2021:
Average Adjusted Gross Income (AGI) in 2020: $73,216 (Individual Income Tax Returns)
Here:
$73,216
State:
$72,319
Salary/wage: $61,816 (reported on 84.0% of returns)
Here:
$61,816
State:
$59,242
(% of AGI for various income ranges: 1136.4% for AGIs below $25k, 3464.2% for AGIs $25k-50k, 6426.0% for AGIs $50k-75k, 10847.1% for AGIs $75k-100k, 14744.5% for AGIs $100k-200k)
Taxable interest for individuals: $988 (reported on 39.5% of returns)
This zip code:
$988
Wisconsin:
$1,431
(% of AGI for various income ranges: 7.1% for AGIs below $25k, 15.8% for AGIs $25k-50k, 10.0% for AGIs $50k-75k, 34.3% for AGIs $75k-100k, 203.6% for AGIs $100k-200k)
Ordinary dividends: $2,764 (reported on 27.2% of returns)
Here:
$2,764
State:
$6,481
(% of AGI for various income ranges: 48.6% for AGIs below $25k, 35.8% for AGIs $25k-50k, 34.0% for AGIs $50k-75k, 134.3% for AGIs $75k-100k, 232.7% for AGIs $100k-200k)
Net capital gain/loss in AGI: +$7,486 (reported on 25.9% of returns)
Here:
+$7,486
State:
+$18,329
(% of AGI for various income ranges: 25.0% for AGIs below $25k, 44.2% for AGIs $25k-50k, 43.0% for AGIs $50k-75k, 420.0% for AGIs $75k-100k, 638.2% for AGIs $100k-200k)
Profit/loss from business: +$9,150 (reported on 14.8% of returns)
Here:
+$9,150
State:
+$14,562
(% of AGI for various income ranges: 215.0% for AGIs below $25k, 192.0% for AGIs $50k-75k, 550.0% for AGIs $100k-200k)
Taxable individual retirement arrangement distribution: $24,791 (reported on 13.6% of returns)
53046:
$24,791
Wisconsin:
$19,348
(% of AGI for various income ranges: 263.6% for AGIs below $25k, 560.0% for AGIs $50k-75k, 1634.5% for AGIs $100k-200k)
Total itemized deductions: $26,471 (reported on 8.6% of returns)
Here:
$26,471
State:
$33,000
(% of AGI for various income ranges: 561.0% for AGIs $50k-75k, 1174.5% for AGIs $100k-200k)
Charity contributions: $6,080 (reported on 6.2% of returns)
Here:
$6,080
State:
$12,044
(% of AGI for various income ranges: 276.4% for AGIs $100k-200k)
Taxes paid: $8,300 (reported on 8.6% of returns)
53046:
$8,300
State:
$8,228
(% of AGI for various income ranges: 186.0% for AGIs $50k-75k, 359.1% for AGIs $100k-200k)
Earned income credit: $1,550 (reported on 7.4% of returns)
Here:
$1,550
State:
$2,155
(% of AGI for various income ranges: 66.4% for AGIs below $25k)
Percentage of individuals using paid preparers for their 2020 taxes: 95.1%
Here:
95%
State:
94%
(% for various income ranges: 85.7% for AGIs below $25k, 100.0% for AGIs $25k-50k, 92.9% for AGIs $50k-75k, 100.0% for AGIs $75k-100k, 100.0% for AGIs $100k-200k, 100.0% for AGIs over 200k)
Averages for the 2012 tax year for zip code 53046, filed in 2013:
Average Adjusted Gross Income (AGI) in 2012: $46,866 (Individual Income Tax Returns)
Here:
$46,866
State:
$57,939
Salary/wage: $41,909 (reported on 87.7% of returns)
Here:
$41,909
State:
$48,248
(% of AGI for various income ranges: 74.4% for AGIs below $25k, 80.1% for AGIs $25k-50k, 77.1% for AGIs $50k-75k, 82.8% for AGIs $75k-100k, 76.1% for AGIs $100k-200k)
Taxable interest for individuals: $365 (reported on 40.0% of returns)
This zip code:
$365
Wisconsin:
$1,224
(% of AGI for various income ranges: 0.9% for AGIs below $25k, 0.2% for AGIs $25k-50k, 0.4% for AGIs $50k-75k, 0.1% for AGIs $75k-100k, 0.3% for AGIs $100k-200k)
Ordinary dividends: $885 (reported on 20.0% of returns)
Here:
$885
State:
$5,137
(% of AGI for various income ranges: 0.2% for AGIs below $25k, 0.5% for AGIs $25k-50k, 0.6% for AGIs $50k-75k, 0.6% for AGIs $75k-100k)
Profit/loss from business: +$7,729 (reported on 10.8% of returns)
Here:
+$7,729
State:
+$11,943
Taxable individual retirement arrangement distribution: $9,270 (reported on 15.4% of returns)
53046:
$9,270
Wisconsin:
$14,087
(% of AGI for various income ranges: 7.4% for AGIs below $25k, 4.0% for AGIs $25k-50k, 6.9% for AGIs $50k-75k)
Total itemized deductions: $17,654 (25% of AGI, reported on 36.9% of returns)
Here:
$17,654
State:
$22,257
Here:
24.9% of AGI
State:
20.1% of AGI
(% of AGI for various income ranges: 12.7% for AGIs below $25k, 10.6% for AGIs $25k-50k, 14.2% for AGIs $50k-75k, 16.7% for AGIs $75k-100k, 14.7% for AGIs $100k-200k)
Charity contributions: $2,088 (reported on 26.2% of returns)
Here:
$2,088
State:
$3,370
(% of AGI for various income ranges: 1.2% for AGIs $25k-50k, 1.2% for AGIs $50k-75k, 1.3% for AGIs $75k-100k, 1.4% for AGIs $100k-200k)
Taxes paid: $7,238 (reported on 36.9% of returns)
53046:
$7,238
State:
$10,731
(% of AGI for various income ranges: 3.9% for AGIs below $25k, 3.1% for AGIs $25k-50k, 5.9% for AGIs $50k-75k, 6.8% for AGIs $75k-100k, 7.5% for AGIs $100k-200k)
Earned income credit: $1,617 (reported on 9.2% of returns)
Here:
$1,617
State:
$2,094
(% of AGI for various income ranges: 2.7% for AGIs below $25k, 0.4% for AGIs $25k-50k)
Percentage of individuals using paid preparers for their 2012 taxes: 47.7%
Here:
48%
State:
54%
(% for various income ranges: 45.5% for AGIs below $25k, 42.1% for AGIs $25k-50k, 54.5% for AGIs $50k-75k, 42.9% for AGIs $75k-100k, 66.7% for AGIs $100k-200k)
Averages for the 2004 tax year for zip code 53046, filed in 2005:
Average Adjusted Gross Income (AGI) in 2004: $42,453 (Individual Income Tax Returns)
Here:
$42,453
State:
$47,735
Salary/wage: $39,196 (reported on 85.7% of returns)
Here:
$39,196
State:
$41,540
(% of AGI for various income ranges: 96.7% for AGIs below $10k, 68.0% for AGIs $10k-25k, 83.5% for AGIs $25k-50k, 83.0% for AGIs $50k-75k, 79.3% for AGIs $75k-100k, 69.0% for AGIs over 100k)
Taxable interest for individuals: $398 (reported on 49.6% of returns)
This zip code:
$398
Wisconsin:
$1,420
(% of AGI for various income ranges: 3.3% for AGIs below $10k, 0.9% for AGIs $10k-25k, 0.7% for AGIs $25k-50k, 0.3% for AGIs $50k-75k, 0.2% for AGIs $75k-100k, 0.4% for AGIs over 100k)
Taxable dividends: $1,078 (reported on 22.7% of returns)
Here:
$1,078
State:
$2,869
(% of AGI for various income ranges: 1.4% for AGIs $10k-25k, 0.6% for AGIs $25k-50k, 0.9% for AGIs $50k-75k, 0.3% for AGIs $75k-100k)
Net capital gain/loss: +$1,284 (reported on 14.5% of returns)
Here:
+$1,284
State:
+$9,569
(% of AGI for various income ranges: 2.9% for AGIs below $10k, -0.2% for AGIs $25k-50k, 0.6% for AGIs $50k-75k, 1.4% for AGIs $75k-100k)
Profit/loss from business: +$3,400 (reported on 10.7% of returns)
Here:
+$3,400
State:
+$10,417
IRA payment deduction: $2,600 (reported on 2.0% of returns)
53046:
$2,600
Wisconsin:
$2,900
Total itemized deductions: $14,575 (24% of AGI, reported on 41.8% of returns)
Here:
$14,575
State:
$18,160
Here:
24.2% of AGI
State:
21.1% of AGI
(% of AGI for various income ranges: 30.4% for AGIs below $10k, 12.2% for AGIs $10k-25k, 11.4% for AGIs $25k-50k, 15.0% for AGIs $50k-75k, 17.2% for AGIs $75k-100k, 13.9% for AGIs over 100k)
Charity contributions deductions: $1,616 (3% of AGI, reported on 33.6% of returns)
Here:
$1,616
State:
$2,711
Here:
2.6% of AGI
State:
3.0% of AGI
(% of AGI for various income ranges: 2.2% for AGIs $10k-25k, 1.0% for AGIs $25k-50k, 1.0% for AGIs $50k-75k, 1.8% for AGIs $75k-100k, 1.4% for AGIs over 100k)
Total tax: $4,729 (reported on 82.8% of returns)
53046:
$4,729
State:
$7,114
(% of AGI for various income ranges: 2.6% for AGIs below $10k, 4.4% for AGIs $10k-25k, 7.6% for AGIs $25k-50k, 8.6% for AGIs $50k-75k, 10.4% for AGIs $75k-100k, 14.5% for AGIs over 100k)
Earned income credit: $1,116 (reported on 8.4% of returns)
Here:
$1,116
State:
$1,544
Percentage of individuals using paid preparers for their 2004 taxes: 50.8%
Here:
51%
State:
57%
(% for various income ranges: 39.2% for AGIs below $10k, 49.5% for AGIs $10k-25k, 53.0% for AGIs $25k-50k, 51.0% for AGIs $50k-75k, 58.8% for AGIs $75k-100k, 62.5% for AGIs over 100k)
Household received Food Stamps/SNAP in the past 12 months: 31 Household did not receive Food Stamps/SNAP in the past 12 months: 617
Women who had a birth in the past 12 months: 13 (13 now married, 0 unmarried) Women who did not have a birth in the past 12 months: 231 (133 now married, 97 unmarried)
Housing units in zip code 53046 with a mortgage: 275 (25 second mortgage, 25 both second mortgage and home equity loan) Residents with income below the poverty level in 2022:
This zip code:
5.5%
Whole state:
10.7%
Median number of rooms in houses and condos:
Here:
5.8
State:
6.5
Median number of rooms in apartments:
Here:
2.1
State:
4.1
Notable locations in this zip code not listed on our city pages
Size of family households: 143 2-persons, 83 3-persons, 57 4-persons, 15 5-persons, 12 6-persons, 5 7-or-more-persons
Size of nonfamily households: 295 1-person, 36 2-persons, 4 3-persons
245 married couples with children.
37 single-parent households (13 men, 24 women).
92.3% of residents of 53046 zip code speak English at home.
2.8% of residents speak Spanish at home (86% very well, 14% well).
1.6% of residents speak other Indo-European language at home (100% very well).
1.8% of residents speak Asian or Pacific Island language at home (91% very well, 9% well).
1.3% of residents speak other language at home (100% very well).
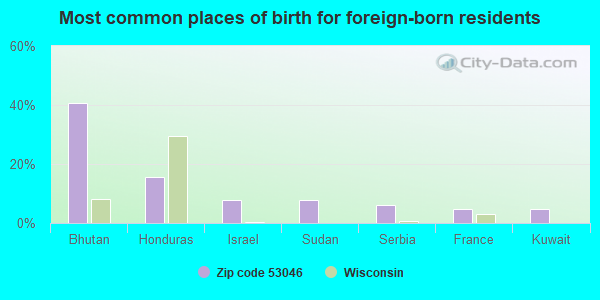
Foreign born population: 64 (4.8%) (72.4% of them are naturalized citizens)
This zip code:
4.8%
Whole state:
5.0%
41%Bhutan
16%Honduras
8%Israel
8%Sudan
6%Serbia
5%France
5%Kuwait
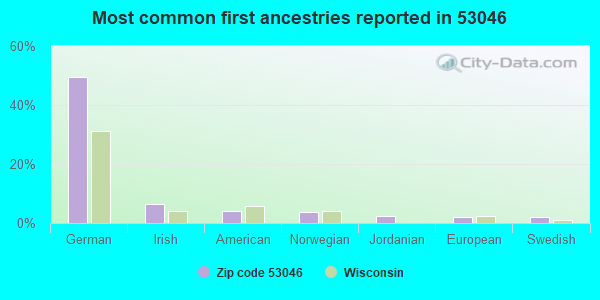
49%German
7%Irish
4%American
4%Norwegian
2%Jordanian
2%European
2%Swedish
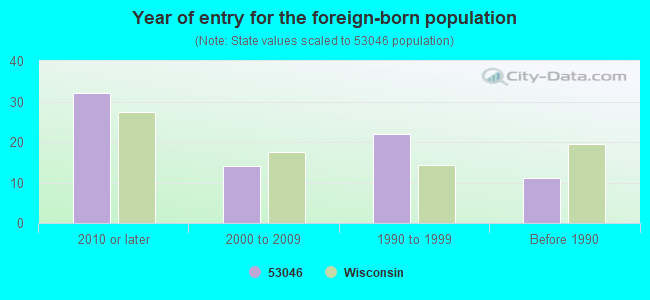
Year of entry for the foreign-born population
322010 or later
142000 to 2009
221990 to 1999
11Before 1990
Facilities with environmental interests located in this zip code:
A F W FOUNDRY INC (21020 W. GOOD HOPE RD in LANNON, WI)
COMPLIANCE ACTIVITY (Tracking inspections of insecticide, fungicide, and rodenticide, and toxic substances) CRITERIA AND HAZARDOUS AIR POLLUTANT INVENTORY (Inventory of air pollution sources) TRI REPORTER (Tracking of toxic chemicals releasing facilities) STATE MASTER (Wisconsin database) - TRIS-53046FWFND21020, TRI REPORTER, NEI-WI268198370, AIR PROGRAM Business SIC classification: ALUMINUM FOUNDRIES; COPPER FOUNDRIES; NONFERROUS FOUNDRIES, EXCEPT ALUMINUM AND COPPER Business NAICS classification: ALUMINUM FOUNDRIES (EXCEPT DIE-CASTING).; COPPER FOUNDRIES (EXCEPT DIE-CASTING). Organizations: A F W FOUNDRY, INC. Alternative names: AFW FNDY. INC.
ALLISTER FABRICATING INC (21319 W GOOD HOPE RD in LANNON, WI)
Small Quantity Generators, between 100 kg and 1000 kg of hazardous waste/month (Resource Conservation and Recovery Act (tracking hazardous waste)) STATE MASTER (Wisconsin database) - RCRAINFO-WID001781673, SQG Business SIC classification: FABRICATED PLATE WORK (BOILER SHOPS); SHEET METALWORK; FABRICATED METAL PRODUCTS
CHEMRITE INDUSTRIES LLC (19725 W EDGEWOOD DR in LANNON, WI)
TRI REPORTER (Tracking of toxic chemicals releasing facilities) STATE MASTER (Wisconsin database) - TRIS-53046CHMRT19725, TRI REPORTER, SDWIS-WI2681558, DRINKING WATER SYSTEM Business SIC classification: SPECIALTY CLEANING, POLISHING, AND SANITATION PREPARATIONS Alternative names: CHEMRITE INDS. INC.
ACCORD PREMIER (7494 CIRCLE DR in LANNON, WI)
Small Quantity Generators, between 100 kg and 1000 kg of hazardous waste/month (Resource Conservation and Recovery Act (tracking hazardous waste)) - notification
Housing units lacking complete plumbing facilities: 8.0% Housing units lacking complete kitchen facilities: 1.9%
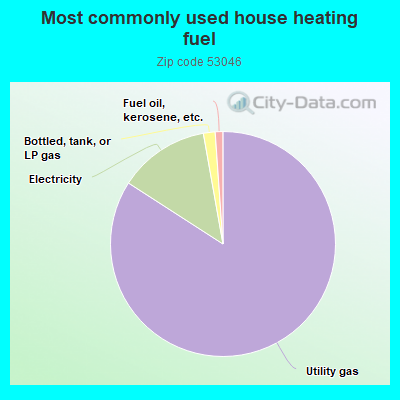
84.3%Utility gas
13.1%Electricity
1.7%Bottled, tank, or LP gas
1.1%Fuel oil, kerosene, etc.
Population in 1990: 924. Population change in the 1990s: +271 (+29.3%).
Place of birth for U.S.-born residents:
This state: 1,054
Northeast: 50
Midwest: 106
South: 20
West: 37
68% of the 53046 zip code residents lived in the same house 5 years ago. Out of people who lived in different houses, 42% lived in this county. Out of people who lived in different counties, 50% lived in Wisconsin.
90% of the 53046 zip code residents lived in the same house 1 year ago. Out of people who lived in different houses, 43% moved from this county. Out of people who lived in different houses, 53% moved from different county within same state. Out of people who lived in different houses, 3% moved from abroad.
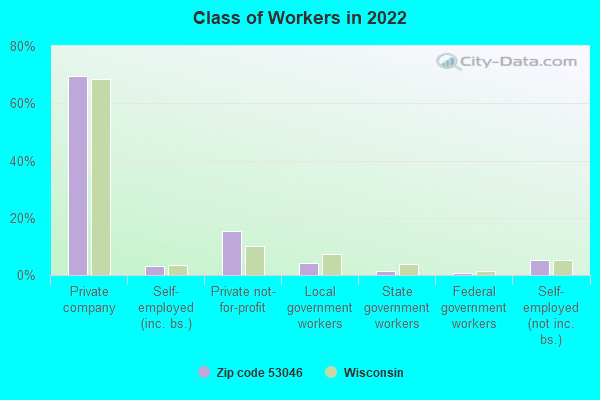
Private vs. public school enrollment:
Students in private schools in grades 1 to 8 (elementary and middle school): 15
Here:
11.1%
Wisconsin:
16.7%
Students in private schools in grades 9 to 12 (high school):
Here:
0.0%
Wisconsin:
12.5%
Students in private undergraduate colleges: 8
Here:
17.6%
Wisconsin:
17.5%
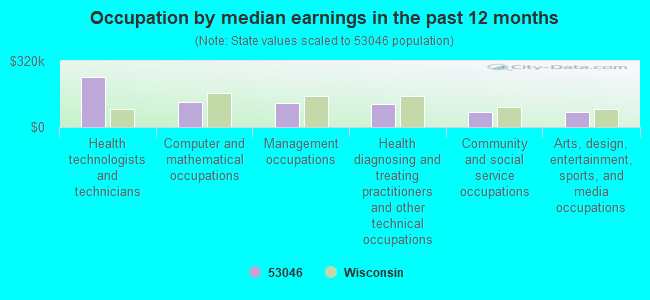
Occupation by median earnings in the past 12 months ($)
241,981Health technologists and technicians
119,443Computer and mathematical occupations
116,970Management occupations
109,355Health diagnosing and treating practitioners and other technical occupations
73,398Community and social service occupations
70,879Arts, design, entertainment, sports, and media occupations
Top industries in this zip code by the number of employees in 2005:
Construction: Power and Communication Line and Related Structures Construction (50-99 employees: 1 establishment)
Wholesale Trade: Brick, Stone, and Related Construction Material Merchant Wholesalers (20-49: 1, 10-19: 1)
Construction: Site Preparation Contractors (20-49: 1, 1-4: 3)
Home Mortgage Disclosure Act Aggregated Statistics For Year 2009 (Based on 2 partial tracts)
A) FHA, FSA/RHS & VA Home Purchase Loans
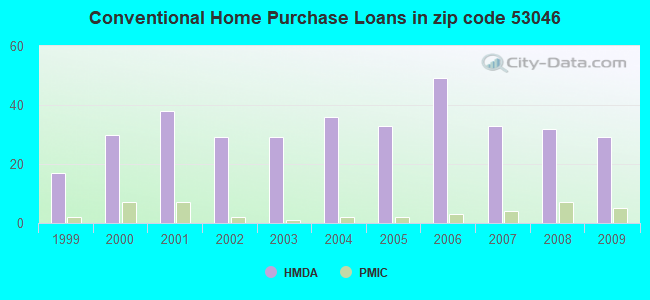
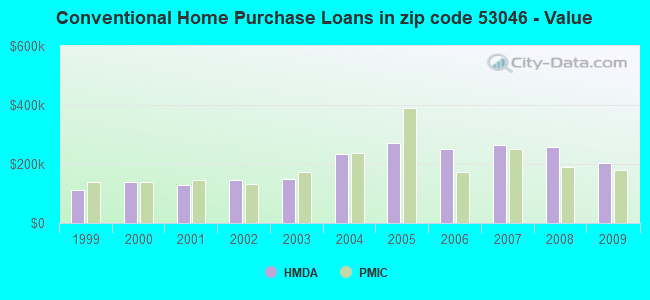
B) Conventional Home Purchase Loans
C) Refinancings
D) Home Improvement Loans
F) Non-occupant Loans on < 5 Family Dwellings (A B C & D)
G) Loans On Manufactured Home Dwelling (A B C & D)
Number
Average Value
Number
Average Value
Number
Average Value
Number
Average Value
Number
Average Value
Number
Average Value
LOANS ORIGINATED
5
$162,536
29
$204,330
109
$221,710
7
$60,399
3
$116,610
6
$45,747
APPLICATIONS APPROVED, NOT ACCEPTED
0
$0
2
$145,315
5
$163,374
1
$5,380
0
$0
2
$40,065
APPLICATIONS DENIED
0
$0
4
$184,332
25
$221,523
0
$0
0
$0
2
$57,705
APPLICATIONS WITHDRAWN
1
$252,950
3
$158,470
13
$219,098
1
$14,950
1
$300,790
1
$39,470
FILES CLOSED FOR INCOMPLETENESS
1
$122,590
0
$0
4
$127,075
0
$0
0
$0
0
$0
Aggregated Statistics For Year 2008 (Based on 2 partial tracts)
A) FHA, FSA/RHS & VA Home Purchase Loans
B) Conventional Home Purchase Loans
C) Refinancings
D) Home Improvement Loans
F) Non-occupant Loans on < 5 Family Dwellings (A B C & D)
G) Loans On Manufactured Home Dwelling (A B C & D)
Number
Average Value
Number
Average Value
Number
Average Value
Number
Average Value
Number
Average Value
Number
Average Value
LOANS ORIGINATED
2
$254,750
32
$258,841
56
$238,848
7
$58,690
2
$158,770
1
$39,470
APPLICATIONS APPROVED, NOT ACCEPTED
1
$87,310
2
$283,750
8
$217,598
1
$4,780
0
$0
0
$0
APPLICATIONS DENIED
1
$107,640
1
$134,550
16
$209,076
5
$36,478
1
$77,740
1
$29,300
APPLICATIONS WITHDRAWN
0
$0
1
$398,270
10
$146,869
1
$111,230
1
$340,860
0
$0
FILES CLOSED FOR INCOMPLETENESS
0
$0
0
$0
1
$292,420
1
$167,440
0
$0
0
$0
Aggregated Statistics For Year 2007 (Based on 2 partial tracts)
A) FHA, FSA/RHS & VA Home Purchase Loans
B) Conventional Home Purchase Loans
C) Refinancings
D) Home Improvement Loans
E) Loans on Dwellings For 5+ Families
F) Non-occupant Loans on < 5 Family Dwellings (A B C & D)
G) Loans On Manufactured Home Dwelling (A B C & D)
Number
Average Value
Number
Average Value
Number
Average Value
Number
Average Value
Number
Average Value
Number
Average Value
Number
Average Value
LOANS ORIGINATED
1
$116,010
33
$265,911
51
$195,933
12
$110,580
1
$31,690
1
$174,620
4
$37,822
APPLICATIONS APPROVED, NOT ACCEPTED
0
$0
1
$122,590
9
$289,100
2
$135,745
0
$0
0
$0
0
$0
APPLICATIONS DENIED
0
$0
7
$265,341
14
$197,724
2
$117,805
0
$0
1
$110,630
4
$56,510
APPLICATIONS WITHDRAWN
0
$0
2
$206,010
8
$173,121
1
$104,650
0
$0
0
$0
0
$0
FILES CLOSED FOR INCOMPLETENESS
0
$0
1
$116,610
2
$310,960
1
$107,640
0
$0
0
$0
1
$32,890
Aggregated Statistics For Year 2006 (Based on 2 partial tracts)
A) FHA, FSA/RHS & VA Home Purchase Loans
B) Conventional Home Purchase Loans
C) Refinancings
D) Home Improvement Loans
F) Non-occupant Loans on < 5 Family Dwellings (A B C & D)
G) Loans On Manufactured Home Dwelling (A B C & D)
Number
Average Value
Number
Average Value
Number
Average Value
Number
Average Value
Number
Average Value
Number
Average Value
LOANS ORIGINATED
1
$117,810
49
$250,952
49
$208,970
6
$107,540
3
$241,790
4
$36,628
APPLICATIONS APPROVED, NOT ACCEPTED
0
$0
11
$340,643
7
$121,309
1
$45,450
0
$0
2
$40,365
APPLICATIONS DENIED
0
$0
3
$340,460
19
$191,360
1
$220,660
0
$0
2
$48,735
APPLICATIONS WITHDRAWN
0
$0
2
$437,435
13
$208,564
0
$0
0
$0
0
$0
FILES CLOSED FOR INCOMPLETENESS
0
$0
2
$130,665
4
$198,685
1
$11,960
0
$0
0
$0
Aggregated Statistics For Year 2005 (Based on 2 partial tracts)
A) FHA, FSA/RHS & VA Home Purchase Loans
B) Conventional Home Purchase Loans
C) Refinancings
D) Home Improvement Loans
F) Non-occupant Loans on < 5 Family Dwellings (A B C & D)
G) Loans On Manufactured Home Dwelling (A B C & D)
Number
Average Value
Number
Average Value
Number
Average Value
Number
Average Value
Number
Average Value
Number
Average Value
LOANS ORIGINATED
1
$252,360
33
$269,571
74
$175,812
6
$70,265
3
$194,750
2
$35,280
APPLICATIONS APPROVED, NOT ACCEPTED
0
$0
4
$212,140
7
$152,917
0
$0
0
$0
2
$32,290
APPLICATIONS DENIED
0
$0
5
$46,524
19
$174,396
1
$69,970
2
$130,960
5
$29,660
APPLICATIONS WITHDRAWN
0
$0
1
$293,020
18
$194,449
1
$115,410
0
$0
0
$0
FILES CLOSED FOR INCOMPLETENESS
0
$0
1
$428,170
8
$263,569
0
$0
0
$0
0
$0
Aggregated Statistics For Year 2004 (Based on 2 partial tracts)
A) FHA, FSA/RHS & VA Home Purchase Loans
B) Conventional Home Purchase Loans
C) Refinancings
D) Home Improvement Loans
F) Non-occupant Loans on < 5 Family Dwellings (A B C & D)
G) Loans On Manufactured Home Dwelling (A B C & D)
Number
Average Value
Number
Average Value
Number
Average Value
Number
Average Value
Number
Average Value
Number
Average Value
LOANS ORIGINATED
2
$169,830
36
$234,183
75
$145,298
5
$83,242
2
$130,065
2
$46,945
APPLICATIONS APPROVED, NOT ACCEPTED
0
$0
7
$88,504
10
$96,756
0
$0
0
$0
8
$40,962
APPLICATIONS DENIED
1
$66,980
4
$30,200
19
$127,846
4
$48,738
1
$135,750
5
$32,532
APPLICATIONS WITHDRAWN
0
$0
3
$188,570
9
$111,693
1
$12,560
0
$0
1
$33,490
FILES CLOSED FOR INCOMPLETENESS
0
$0
0
$0
10
$125,161
0
$0
0
$0
1
$38,270
Aggregated Statistics For Year 2003 (Based on 2 partial tracts)
A) FHA, FSA/RHS & VA Home Purchase Loans
B) Conventional Home Purchase Loans
C) Refinancings
D) Home Improvement Loans
E) Loans on Dwellings For 5+ Families
F) Non-occupant Loans on < 5 Family Dwellings (A B C & D)
Number
Average Value
Number
Average Value
Number
Average Value
Number
Average Value
Number
Average Value
Number
Average Value
LOANS ORIGINATED
0
$0
29
$149,191
163
$137,566
15
$38,391
1
$277,470
2
$115,115
APPLICATIONS APPROVED, NOT ACCEPTED
0
$0
3
$135,147
11
$123,786
1
$4,190
0
$0
0
$0
APPLICATIONS DENIED
0
$0
4
$44,252
32
$142,530
2
$14,055
0
$0
0
$0
APPLICATIONS WITHDRAWN
0
$0
3
$157,873
14
$175,214
1
$44,850
0
$0
1
$81,930
FILES CLOSED FOR INCOMPLETENESS
1
$175,810
0
$0
2
$146,210
0
$0
0
$0
0
$0
Aggregated Statistics For Year 2002 (Based on 2 partial tracts)
A) FHA, FSA/RHS & VA Home Purchase Loans
B) Conventional Home Purchase Loans
C) Refinancings
D) Home Improvement Loans
F) Non-occupant Loans on < 5 Family Dwellings (A B C & D)
Number
Average Value
Number
Average Value
Number
Average Value
Number
Average Value
Number
Average Value
LOANS ORIGINATED
1
$208,700
29
$146,180
141
$131,598
5
$11,242
2
$158,170
APPLICATIONS APPROVED, NOT ACCEPTED
0
$0
2
$97,775
12
$116,361
1
$4,190
0
$0
APPLICATIONS DENIED
0
$0
3
$130,163
16
$115,938
2
$29,600
0
$0
APPLICATIONS WITHDRAWN
0
$0
2
$136,045
8
$128,420
1
$12,560
0
$0
FILES CLOSED FOR INCOMPLETENESS
0
$0
2
$127,375
2
$129,170
0
$0
0
$0
Aggregated Statistics For Year 2001 (Based on 2 partial tracts)
A) FHA, FSA/RHS & VA Home Purchase Loans
B) Conventional Home Purchase Loans
C) Refinancings
D) Home Improvement Loans
F) Non-occupant Loans on < 5 Family Dwellings (A B C & D)
Number
Average Value
Number
Average Value
Number
Average Value
Number
Average Value
Number
Average Value
LOANS ORIGINATED
1
$162,660
38
$129,561
103
$119,954
7
$11,789
0
$0
APPLICATIONS APPROVED, NOT ACCEPTED
0
$0
3
$57,010
11
$89,156
1
$53,220
0
$0
APPLICATIONS DENIED
0
$0
2
$79,235
13
$86,296
2
$24,815
0
$0
APPLICATIONS WITHDRAWN
0
$0
2
$84,320
7
$100,977
1
$23,920
0
$0
FILES CLOSED FOR INCOMPLETENESS
0
$0
0
$0
4
$119,300
1
$8,970
1
$71,760
Aggregated Statistics For Year 2000 (Based on 2 partial tracts)
A) FHA, FSA/RHS & VA Home Purchase Loans
B) Conventional Home Purchase Loans
C) Refinancings
D) Home Improvement Loans
F) Non-occupant Loans on < 5 Family Dwellings (A B C & D)
Number
Average Value
Number
Average Value
Number
Average Value
Number
Average Value
Number
Average Value
LOANS ORIGINATED
2
$111,525
30
$139,653
20
$87,637
14
$17,556
1
$75,350
APPLICATIONS APPROVED, NOT ACCEPTED
0
$0
4
$84,618
9
$86,378
1
$25,710
0
$0
APPLICATIONS DENIED
0
$0
5
$62,192
8
$111,004
2
$5,980
0
$0
APPLICATIONS WITHDRAWN
0
$0
1
$149,500
5
$66,020
1
$16,740
0
$0
FILES CLOSED FOR INCOMPLETENESS
0
$0
0
$0
3
$121,793
0
$0
0
$0
Aggregated Statistics For Year 1999 (Based on 1 partial tract)
B) Conventional Home Purchase Loans
C) Refinancings
D) Home Improvement Loans
F) Non-occupant Loans on < 5 Family Dwellings (A B C & D)

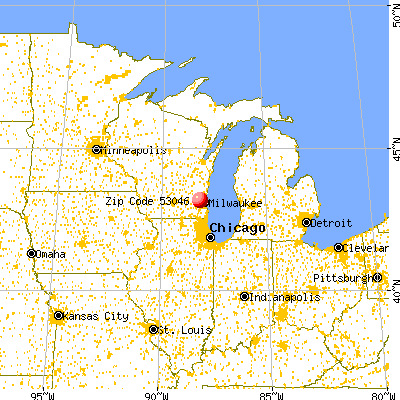


 Nearest zip codes: 53051, 53089, 53022, 53045, 53007, 53017.