Estimated zip code population in 2022: 2,271 Zip code population in 2010: 2,297 Zip code population in 2000: 1,968
Houses and condos: 924 Renter-occupied apartments: 63
% of renters here:
7%
State:
32%
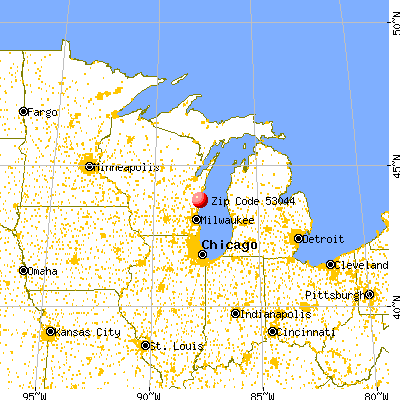
March 2022 cost of living index in zip code 53044: 91.1 (less than average, U.S. average is 100)
Land area: 3.9 sq. mi. Water area: 0.1 sq. mi.
Population density: 578 people per square mile
(low).
OSM Map
General Map
Google Map
MSN Map
OSM Map
General Map
Google Map
MSN Map
OSM Map
General Map
Google Map
MSN Map
OSM Map
General Map
Google Map
MSN Map
Please wait while loading the map...
Real estate property taxes paid for housing units in 2022:
This zip code:
1.2% ($4,423)
Wisconsin:
1.4% ($3,497)
Median real estate property taxes paid for housing units with mortgages in 2022: $4,207 (1.2%) Median real estate property taxes paid for housing units with no mortgage in 2022: $4,726 (1.2%)
Estimated median house/condo value in 2022: $366,418
53044:
$366,418
Wisconsin:
$252,800
Median resident age:
This zip code:
42.8 years
Wisconsin median age:
40.4 years
Average household size:
This zip code:
2.6 people
Wisconsin:
2.3 people
Averages for the 2020 tax year for zip code 53044, filed in 2021:
Average Adjusted Gross Income (AGI) in 2020: $170,018 (Individual Income Tax Returns)
Here:
$170,018
State:
$72,319
Salary/wage: $131,295 (reported on 82.5% of returns)
Here:
$131,295
State:
$59,242
(% of AGI for various income ranges: 1213.2% for AGIs below $25k, 3460.0% for AGIs $25k-50k, 5898.8% for AGIs $50k-75k, 9557.1% for AGIs $75k-100k, 20256.0% for AGIs $100k-200k, 127585.0% for AGIs over 200k)
Taxable interest for individuals: $2,866 (reported on 53.5% of returns)
This zip code:
$2,866
Wisconsin:
$1,431
(% of AGI for various income ranges: 15.8% for AGIs below $25k, 67.5% for AGIs $25k-50k, 131.2% for AGIs $50k-75k, 251.4% for AGIs $75k-100k, 271.3% for AGIs $100k-200k, 1626.7% for AGIs over 200k)
Ordinary dividends: $32,553 (reported on 44.7% of returns)
Here:
$32,553
State:
$6,481
(% of AGI for various income ranges: 66.3% for AGIs below $25k, 142.5% for AGIs $25k-50k, 535.0% for AGIs $50k-75k, 467.1% for AGIs $75k-100k, 812.0% for AGIs $100k-200k, 23981.7% for AGIs over 200k)
Net capital gain/loss in AGI: +$29,966 (reported on 41.2% of returns)
Here:
+$29,966
State:
+$18,329
(% of AGI for various income ranges: 37.4% for AGIs below $25k, 137.5% for AGIs $25k-50k, 408.8% for AGIs $50k-75k, 161.4% for AGIs $75k-100k, 961.3% for AGIs $100k-200k, 20035.0% for AGIs over 200k)
Profit/loss from business: +$19,113 (reported on 13.2% of returns)
Here:
+$19,113
State:
+$14,562
(% of AGI for various income ranges: 31.6% for AGIs below $25k, 77.5% for AGIs $25k-50k, 175.7% for AGIs $75k-100k, 810.7% for AGIs $100k-200k, 2343.3% for AGIs over 200k)
Taxable individual retirement arrangement distribution: $23,579 (reported on 16.7% of returns)
53044:
$23,579
Wisconsin:
$19,348
(% of AGI for various income ranges: 98.9% for AGIs below $25k, 331.2% for AGIs $25k-50k, 688.8% for AGIs $50k-75k, 972.9% for AGIs $75k-100k, 1060.7% for AGIs $100k-200k, 2006.7% for AGIs over 200k)
Total itemized deductions: $38,593 (reported on 12.3% of returns)
Here:
$38,593
State:
$33,000
(% of AGI for various income ranges: 1197.5% for AGIs $50k-75k, 767.3% for AGIs $100k-200k, 5490.0% for AGIs over 200k)
Charity contributions: $16,242 (reported on 10.5% of returns)
Here:
$16,242
State:
$12,044
(% of AGI for various income ranges: 171.2% for AGIs $25k-50k, 301.3% for AGIs $100k-200k, 2266.7% for AGIs over 200k)
Taxes paid: $9,314 (reported on 12.3% of returns)
53044:
$9,314
State:
$8,228
(% of AGI for various income ranges: 346.2% for AGIs $50k-75k, 254.7% for AGIs $100k-200k, 1075.0% for AGIs over 200k)
Earned income credit: $1,740 (reported on 4.4% of returns)
Here:
$1,740
State:
$2,155
(% of AGI for various income ranges: 45.8% for AGIs below $25k)
Percentage of individuals using paid preparers for their 2020 taxes: 96.5%
Here:
96%
State:
94%
(% for various income ranges: 96.8% for AGIs below $25k, 100.0% for AGIs $25k-50k, 92.3% for AGIs $50k-75k, 100.0% for AGIs $75k-100k, 93.1% for AGIs $100k-200k, 100.0% for AGIs over 200k)
Averages for the 2012 tax year for zip code 53044, filed in 2013:
Average Adjusted Gross Income (AGI) in 2012: $141,318 (Individual Income Tax Returns)
Here:
$141,318
State:
$57,939
Salary/wage: $94,875 (reported on 82.1% of returns)
Here:
$94,875
State:
$48,248
(% of AGI for various income ranges: 69.2% for AGIs below $25k, 69.3% for AGIs $25k-50k, 65.6% for AGIs $50k-75k, 73.6% for AGIs $75k-100k, 73.1% for AGIs $100k-200k, 43.7% for AGIs over 200k)
Taxable interest for individuals: $2,183 (reported on 56.2% of returns)
This zip code:
$2,183
Wisconsin:
$1,224
(% of AGI for various income ranges: 1.3% for AGIs below $25k, 1.3% for AGIs $25k-50k, 1.5% for AGIs $50k-75k, 0.7% for AGIs $75k-100k, 1.2% for AGIs $100k-200k, 0.7% for AGIs over 200k)
Ordinary dividends: $24,085 (reported on 42.9% of returns)
Here:
$24,085
State:
$5,137
(% of AGI for various income ranges: 4.3% for AGIs below $25k, 2.8% for AGIs $25k-50k, 1.8% for AGIs $50k-75k, 2.1% for AGIs $75k-100k, 4.0% for AGIs $100k-200k, 10.2% for AGIs over 200k)
Net capital gain/loss in AGI: +$25,275 (reported on 32.1% of returns)
Here:
+$25,275
State:
+$11,137
(% of AGI for various income ranges: 0.2% for AGIs $50k-75k, 0.4% for AGIs $75k-100k, 1.4% for AGIs $100k-200k, 9.3% for AGIs over 200k)
Profit/loss from business: +$26,719 (reported on 14.3% of returns)
Here:
+$26,719
State:
+$11,943
(% of AGI for various income ranges: 4.6% for AGIs below $25k, 3.4% for AGIs $50k-75k, 3.0% for AGIs $75k-100k, 3.3% for AGIs $100k-200k, 2.5% for AGIs over 200k)
Taxable individual retirement arrangement distribution: $23,652 (reported on 20.5% of returns)
53044:
$23,652
Wisconsin:
$14,087
(% of AGI for various income ranges: 11.9% for AGIs below $25k, 6.1% for AGIs $25k-50k, 5.5% for AGIs $50k-75k, 5.3% for AGIs $75k-100k, 5.0% for AGIs $100k-200k, 2.0% for AGIs over 200k)
Self-employment retirement plans: $28,550 (reported on 1.8% of returns)
53044:
$28,550
Wisconsin:
$17,048
(% of AGI for various income ranges: 1.7% for AGIs $100k-200k)
Total itemized deductions: $34,925 (16% of AGI, reported on 58.0% of returns)
Here:
$34,925
State:
$22,257
Here:
15.9% of AGI
State:
20.1% of AGI
(% of AGI for various income ranges: 25.5% for AGIs below $25k, 17.4% for AGIs $25k-50k, 13.1% for AGIs $50k-75k, 18.0% for AGIs $75k-100k, 17.4% for AGIs $100k-200k, 12.3% for AGIs over 200k)
Charity contributions: $5,393 (reported on 53.6% of returns)
Here:
$5,393
State:
$3,370
(% of AGI for various income ranges: 2.0% for AGIs below $25k, 1.4% for AGIs $25k-50k, 1.5% for AGIs $50k-75k, 2.2% for AGIs $75k-100k, 2.9% for AGIs $100k-200k, 1.8% for AGIs over 200k)
Taxes paid: $19,945 (reported on 57.1% of returns)
53044:
$19,945
State:
$10,731
(% of AGI for various income ranges: 6.0% for AGIs below $25k, 6.3% for AGIs $25k-50k, 5.9% for AGIs $50k-75k, 8.0% for AGIs $75k-100k, 9.2% for AGIs $100k-200k, 8.0% for AGIs over 200k)
Earned income credit: $1,480 (reported on 4.5% of returns)
Here:
$1,480
State:
$2,094
(% of AGI for various income ranges: 2.7% for AGIs below $25k)
Percentage of individuals using paid preparers for their 2012 taxes: 54.5%
Here:
54%
State:
54%
(% for various income ranges: 44.8% for AGIs below $25k, 56.2% for AGIs $25k-50k, 52.9% for AGIs $50k-75k, 57.1% for AGIs $75k-100k, 52.0% for AGIs $100k-200k, 81.8% for AGIs over 200k)
Averages for the 2004 tax year for zip code 53044, filed in 2005:
Average Adjusted Gross Income (AGI) in 2004: $102,119 (Individual Income Tax Returns)
Here:
$102,119
State:
$47,735
Salary/wage: $85,926 (reported on 82.8% of returns)
Here:
$85,926
State:
$41,540
(% of AGI for various income ranges: 88.2% for AGIs below $10k, 63.1% for AGIs $10k-25k, 70.7% for AGIs $25k-50k, 75.9% for AGIs $50k-75k, 79.4% for AGIs $75k-100k, 67.0% for AGIs over 100k)
Taxable interest for individuals: $3,841 (reported on 73.9% of returns)
This zip code:
$3,841
Wisconsin:
$1,420
(% of AGI for various income ranges: 7.9% for AGIs below $10k, 6.3% for AGIs $10k-25k, 3.5% for AGIs $25k-50k, 2.2% for AGIs $50k-75k, 1.0% for AGIs $75k-100k, 3.0% for AGIs over 100k)
Taxable dividends: $6,646 (reported on 49.5% of returns)
Here:
$6,646
State:
$2,869
(% of AGI for various income ranges: 10.4% for AGIs below $10k, 5.1% for AGIs $10k-25k, 3.1% for AGIs $25k-50k, 2.9% for AGIs $50k-75k, 1.6% for AGIs $75k-100k, 3.5% for AGIs over 100k)
Net capital gain/loss: +$10,691 (reported on 37.0% of returns)
Here:
+$10,691
State:
+$9,569
(% of AGI for various income ranges: 5.5% for AGIs below $10k, 1.9% for AGIs $10k-25k, 0.5% for AGIs $25k-50k, 0.6% for AGIs $50k-75k, 1.3% for AGIs $75k-100k, 5.1% for AGIs over 100k)
Profit/loss from business: +$13,648 (reported on 13.8% of returns)
Here:
+$13,648
State:
+$10,417
(% of AGI for various income ranges: -0.0% for AGIs $10k-25k, -1.7% for AGIs $25k-50k, 0.7% for AGIs $50k-75k, 3.4% for AGIs $75k-100k, 2.1% for AGIs over 100k)
IRA payment deduction: $2,714 (reported on 2.0% of returns)
53044:
$2,714
Wisconsin:
$2,900
Self-employed pension: $15,412 (reported on 1.6% of returns)
Here:
$15,412
Wisconsin:
$11,934
Total itemized deductions: $25,982 (18% of AGI, reported on 64.1% of returns)
Here:
$25,982
State:
$18,160
Here:
17.7% of AGI
State:
21.1% of AGI
(% of AGI for various income ranges: 23.6% for AGIs $10k-25k, 22.1% for AGIs $25k-50k, 17.4% for AGIs $50k-75k, 18.4% for AGIs $75k-100k, 15.2% for AGIs over 100k)
Charity contributions deductions: $3,563 (2% of AGI, reported on 60.4% of returns)
Here:
$3,563
State:
$2,711
Here:
2.5% of AGI
State:
3.0% of AGI
(% of AGI for various income ranges: 3.0% for AGIs $10k-25k, 2.0% for AGIs $25k-50k, 2.0% for AGIs $50k-75k, 2.6% for AGIs $75k-100k, 2.0% for AGIs over 100k)
Total tax: $20,821 (reported on 83.0% of returns)
53044:
$20,821
State:
$7,114
(% of AGI for various income ranges: 1.4% for AGIs below $10k, 3.7% for AGIs $10k-25k, 7.1% for AGIs $25k-50k, 8.4% for AGIs $50k-75k, 9.8% for AGIs $75k-100k, 20.7% for AGIs over 100k)
Earned income credit: $1,147 (reported on 3.2% of returns)
Here:
$1,147
State:
$1,544
Percentage of individuals using paid preparers for their 2004 taxes: 53.8%
Here:
54%
State:
57%
(% for various income ranges: 47.3% for AGIs below $10k, 55.4% for AGIs $10k-25k, 50.6% for AGIs $25k-50k, 50.8% for AGIs $50k-75k, 52.8% for AGIs $75k-100k, 61.7% for AGIs over 100k)
Household received Food Stamps/SNAP in the past 12 months: 0 Household did not receive Food Stamps/SNAP in the past 12 months: 859
Women who had a birth in the past 12 months: 29 (29 now married, 0 unmarried) Women who did not have a birth in the past 12 months: 512 (266 now married, 246 unmarried)
Housing units in zip code 53044 with a mortgage: 473 (60 second mortgage, 54 both second mortgage and home equity loan) Houses without a mortgage: 5
Median monthly owner costs for units with a mortgage: $1,692 Median monthly owner costs for units without a mortgage: $818
Residents with income below the poverty level in 2022:
This zip code:
0.6%
Whole state:
10.7%
Residents with income below 50% of the poverty level in 2022:
This zip code:
0.3%
Whole state:
5.7%
Median number of rooms in houses and condos:
Here:
7.3
State:
6.5
Median number of rooms in apartments:
Here:
6.0
State:
4.1
Notable locations in this zip code not listed on our city pages
Churches in zip code 53044 include: Bethany Lutheran Church (A), Saint Johns Church (B), Grace United Church of Christ (C). Display/hide their locations on the map
Size of family households: 311 2-persons, 108 3-persons, 152 4-persons, 62 5-persons, 13 6-persons, 4 7-or-more-persons
Size of nonfamily households: 186 1-person, 6 2-persons, 19 3-persons
552 married couples with children.
47 single-parent households (47 women).
92.7% of residents of 53044 zip code speak English at home.
2.8% of residents speak Spanish at home (25% very well, 70% well, 5% not well).
2.2% of residents speak other Indo-European language at home (98% very well, 2% not well).
1.7% of residents speak Asian or Pacific Island language at home (81% very well, 19% well).
0.4% of residents speak other language at home (100% very well).
Foreign born population: 160 (7.1%) (59.7% of them are naturalized citizens)
This zip code:
7.1%
Whole state:
5.0%
32%Honduras
13%Georgia
9%Singapore
6%Costa Rica
4%Greece
4%India
3%Indonesia
50%German
7%American
5%Irish
4%Italian
3%European
2%Norwegian
2%Swedish
Year of entry for the foreign-born population
712010 or later
72000 to 2009
411990 to 1999
61Before 1990
Housing units lacking complete kitchen facilities: 0.5%
89.8%Utility gas
8.5%Electricity
1.9%Bottled, tank, or LP gas
Population in 1990: 1,900. Population change in the 1990s: +68 (+3.6%).
Place of birth for U.S.-born residents:
This state: 1,436
Northeast: 80
Midwest: 399
South: 75
West: 106
68% of the 53044 zip code residents lived in the same house 5 years ago. Out of people who lived in different houses, 37% lived in this county. Out of people who lived in different counties, 50% lived in Wisconsin.
93% of the 53044 zip code residents lived in the same house 1 year ago. Out of people who lived in different houses, 49% moved from this county. Out of people who lived in different houses, 15% moved from different county within same state. Out of people who lived in different houses, 32% moved from different state. Out of people who lived in different houses, 5% moved from abroad.
Private vs. public school enrollment:
Students in private schools in grades 1 to 8 (elementary and middle school): 32
Here:
11.4%
Wisconsin:
16.7%
Students in private schools in grades 9 to 12 (high school): 5
Here:
2.7%
Wisconsin:
12.5%
Students in private undergraduate colleges: 5
Here:
6.9%
Wisconsin:
17.5%
Occupation by median earnings in the past 12 months ($)
159,955Management occupations
112,744Health diagnosing and treating practitioners and other technical occupations
107,772Architecture and engineering occupations
90,225Construction and extraction occupations
85,415Legal occupations
81,904Business and financial operations occupations
Companies with federal contracts located in this zip code:
JOHNSONVILLE SAUSAGE LLC (950 WOODLAKE RD in KOHLER, WI) : $20,842,784 in 36 contractsfrom 2000 to 2006
Contracts for Food Items For Resale, Non-Food Items For Resale by Defense Commissary Agency, Department of Defense Signed by year:2000: $306,577; 2001: $31,467; 2002: $381,719; 2003: $282,257; 2004: $4,066,107; 2005: $11,072,879; 2006: $4,701,778.
Biggest contracts:
$5,357,673 with Defense Commissary Agency for Food Items For Resale. Signed on 2005-04-01. Completion date: 2005-08-31.
$4,701,778 with Defense Commissary Agency for Food Items For Resale. Taking place in VA. Signed on 2006-01-01. Completion date: 2006-03-31.
$3,398,206 with Defense Commissary Agency for Food Items For Resale. Signed on 2004-10-01. Completion date: 2005-02-28.
$2,803,425 with Defense Commissary Agency for Food Items For Resale. Taking place in VA. Signed on 2005-10-01. Completion date: 2005-12-31.
GREAT LAKE HYD LLC (660 TREEHOUSE PKWY in KOHLER, WI; small business)
$4,926 with Army for Tool and Hardware Boxes. Taking place in MN. Signed on 2006-02-24. Completion date: 2006-03-10.
Top industries in this zip code by the number of employees in 2005:
Management of Companies and Enterprises: Corporate, Subsidiary, and Regional Managing Offices (over 1000 employees: 1 establishment, 500-999 employees: 1 establishment)
Accommodation and Food Services: Hotels (except Casino Hotels) and Motels (500-999: 1, 20-49: 1)
Arts, Entertainment, and Recreation: Golf Courses and Country Clubs (250-499: 1)
Finance and Insurance: Credit Unions (50-99: 1)
Home Mortgage Disclosure Act Aggregated Statistics For Year 2009 (Based on 2 partial tracts)
A) FHA, FSA/RHS & VA Home Purchase Loans
B) Conventional Home Purchase Loans
C) Refinancings
D) Home Improvement Loans
F) Non-occupant Loans on < 5 Family Dwellings (A B C & D)
G) Loans On Manufactured Home Dwelling (A B C & D)
Number
Average Value
Number
Average Value
Number
Average Value
Number
Average Value
Number
Average Value
Number
Average Value
LOANS ORIGINATED
3
$172,533
23
$173,725
192
$178,141
10
$67,933
7
$253,196
1
$95,050
APPLICATIONS APPROVED, NOT ACCEPTED
0
$0
0
$0
7
$188,463
2
$10,500
0
$0
0
$0
APPLICATIONS DENIED
0
$0
1
$90,990
20
$185,710
2
$67,785
0
$0
1
$68,890
APPLICATIONS WITHDRAWN
1
$95,780
1
$178,310
14
$185,463
2
$19,895
0
$0
0
$0
FILES CLOSED FOR INCOMPLETENESS
1
$153,620
0
$0
3
$352,680
0
$0
0
$0
0
$0
Aggregated Statistics For Year 2008 (Based on 2 partial tracts)
A) FHA, FSA/RHS & VA Home Purchase Loans
B) Conventional Home Purchase Loans
C) Refinancings
D) Home Improvement Loans
F) Non-occupant Loans on < 5 Family Dwellings (A B C & D)
G) Loans On Manufactured Home Dwelling (A B C & D)
Number
Average Value
Number
Average Value
Number
Average Value
Number
Average Value
Number
Average Value
Number
Average Value
LOANS ORIGINATED
4
$138,702
42
$187,121
79
$165,621
15
$59,803
6
$207,410
0
$0
APPLICATIONS APPROVED, NOT ACCEPTED
0
$0
1
$286,250
8
$141,834
3
$29,103
0
$0
0
$0
APPLICATIONS DENIED
0
$0
1
$188,990
14
$179,726
2
$66,495
0
$0
1
$60,050
APPLICATIONS WITHDRAWN
0
$0
2
$203,355
5
$146,402
1
$16,950
0
$0
0
$0
FILES CLOSED FOR INCOMPLETENESS
0
$0
0
$0
1
$165,780
0
$0
0
$0
0
$0
Aggregated Statistics For Year 2007 (Based on 2 partial tracts)
A) FHA, FSA/RHS & VA Home Purchase Loans
B) Conventional Home Purchase Loans
C) Refinancings
D) Home Improvement Loans
F) Non-occupant Loans on < 5 Family Dwellings (A B C & D)
G) Loans On Manufactured Home Dwelling (A B C & D)
Number
Average Value
Number
Average Value
Number
Average Value
Number
Average Value
Number
Average Value
Number
Average Value
LOANS ORIGINATED
1
$144,040
54
$180,475
57
$164,080
12
$74,969
6
$299,140
2
$82,335
APPLICATIONS APPROVED, NOT ACCEPTED
0
$0
4
$343,072
7
$148,044
0
$0
1
$162,100
0
$0
APPLICATIONS DENIED
0
$0
1
$285,140
16
$143,837
5
$26,598
1
$71,840
0
$0
APPLICATIONS WITHDRAWN
0
$0
2
$195,435
12
$234,272
0
$0
1
$85,100
0
$0
FILES CLOSED FOR INCOMPLETENESS
0
$0
1
$92,100
2
$193,410
0
$0
0
$0
0
$0
Aggregated Statistics For Year 2006 (Based on 2 partial tracts)
A) FHA, FSA/RHS & VA Home Purchase Loans
B) Conventional Home Purchase Loans
C) Refinancings
D) Home Improvement Loans
F) Non-occupant Loans on < 5 Family Dwellings (A B C & D)
G) Loans On Manufactured Home Dwelling (A B C & D)
Number
Average Value
Number
Average Value
Number
Average Value
Number
Average Value
Number
Average Value
Number
Average Value
LOANS ORIGINATED
1
$226,570
60
$157,239
63
$123,198
14
$37,656
8
$187,700
1
$106,100
APPLICATIONS APPROVED, NOT ACCEPTED
0
$0
4
$103,980
6
$106,345
3
$28,857
0
$0
1
$110,520
APPLICATIONS DENIED
0
$0
6
$146,562
15
$149,521
5
$33,892
1
$188,990
1
$72,570
APPLICATIONS WITHDRAWN
0
$0
5
$178,748
12
$159,057
0
$0
1
$126,730
0
$0
FILES CLOSED FOR INCOMPLETENESS
0
$0
1
$112,730
6
$163,323
0
$0
0
$0
0
$0
Aggregated Statistics For Year 2005 (Based on 2 partial tracts)
A) FHA, FSA/RHS & VA Home Purchase Loans
B) Conventional Home Purchase Loans
C) Refinancings
D) Home Improvement Loans
F) Non-occupant Loans on < 5 Family Dwellings (A B C & D)
G) Loans On Manufactured Home Dwelling (A B C & D)
Number
Average Value
Number
Average Value
Number
Average Value
Number
Average Value
Number
Average Value
Number
Average Value
LOANS ORIGINATED
1
$146,990
69
$171,915
85
$163,834
10
$33,930
7
$402,187
2
$61,525
APPLICATIONS APPROVED, NOT ACCEPTED
0
$0
4
$131,335
6
$131,273
1
$4,420
1
$68,890
0
$0
APPLICATIONS DENIED
0
$0
8
$113,375
20
$158,007
3
$107,697
0
$0
1
$62,260
APPLICATIONS WITHDRAWN
0
$0
5
$181,106
13
$146,312
1
$133,730
1
$223,990
1
$78,840
FILES CLOSED FOR INCOMPLETENESS
0
$0
1
$160,250
6
$159,272
0
$0
0
$0
0
$0
Aggregated Statistics For Year 2004 (Based on 2 partial tracts)
A) FHA, FSA/RHS & VA Home Purchase Loans
B) Conventional Home Purchase Loans
C) Refinancings
D) Home Improvement Loans
E) Loans on Dwellings For 5+ Families
F) Non-occupant Loans on < 5 Family Dwellings (A B C & D)
G) Loans On Manufactured Home Dwelling (A B C & D)
Number
Average Value
Number
Average Value
Number
Average Value
Number
Average Value
Number
Average Value
Number
Average Value
Number
Average Value
LOANS ORIGINATED
1
$225,830
59
$170,213
104
$152,659
13
$34,233
1
$1,073,520
8
$163,661
1
$114,570
APPLICATIONS APPROVED, NOT ACCEPTED
0
$0
4
$195,990
7
$151,729
0
$0
0
$0
0
$0
0
$0
APPLICATIONS DENIED
1
$89,520
8
$117,381
16
$86,413
4
$32,050
0
$0
1
$55,630
2
$91,365
APPLICATIONS WITHDRAWN
0
$0
6
$176,587
13
$144,753
1
$46,420
0
$0
1
$110,520
0
$0
FILES CLOSED FOR INCOMPLETENESS
0
$0
1
$85,840
5
$208,294
0
$0
0
$0
0
$0
0
$0
Aggregated Statistics For Year 2003 (Based on 2 partial tracts)
A) FHA, FSA/RHS & VA Home Purchase Loans
B) Conventional Home Purchase Loans
C) Refinancings
D) Home Improvement Loans
F) Non-occupant Loans on < 5 Family Dwellings (A B C & D)
Number
Average Value
Number
Average Value
Number
Average Value
Number
Average Value
Number
Average Value
LOANS ORIGINATED
3
$126,240
65
$154,037
278
$137,013
10
$39,050
7
$123,099
APPLICATIONS APPROVED, NOT ACCEPTED
0
$0
3
$201,393
10
$114,204
0
$0
0
$0
APPLICATIONS DENIED
0
$0
4
$113,282
24
$110,275
3
$9,580
1
$219,930
APPLICATIONS WITHDRAWN
0
$0
3
$99,590
17
$171,544
0
$0
1
$124,520
FILES CLOSED FOR INCOMPLETENESS
0
$0
1
$494,020
4
$110,612
0
$0
0
$0
Aggregated Statistics For Year 2002 (Based on 2 partial tracts)
A) FHA, FSA/RHS & VA Home Purchase Loans
B) Conventional Home Purchase Loans
C) Refinancings
D) Home Improvement Loans
F) Non-occupant Loans on < 5 Family Dwellings (A B C & D)
Number
Average Value
Number
Average Value
Number
Average Value
Number
Average Value
Number
Average Value
LOANS ORIGINATED
2
$111,625
70
$145,081
270
$135,545
18
$29,206
8
$93,804
APPLICATIONS APPROVED, NOT ACCEPTED
0
$0
5
$126,876
9
$134,752
1
$20,630
0
$0
APPLICATIONS DENIED
0
$0
4
$109,322
18
$121,899
4
$13,722
1
$90,990
APPLICATIONS WITHDRAWN
0
$0
5
$169,242
15
$157,258
0
$0
0
$0
FILES CLOSED FOR INCOMPLETENESS
0
$0
0
$0
2
$136,860
0
$0
0
$0
Aggregated Statistics For Year 2001 (Based on 2 partial tracts)
A) FHA, FSA/RHS & VA Home Purchase Loans
B) Conventional Home Purchase Loans
C) Refinancings
D) Home Improvement Loans
F) Non-occupant Loans on < 5 Family Dwellings (A B C & D)
Number
Average Value
Number
Average Value
Number
Average Value
Number
Average Value
Number
Average Value
LOANS ORIGINATED
2
$123,415
58
$153,756
153
$130,132
16
$26,525
4
$83,535
APPLICATIONS APPROVED, NOT ACCEPTED
0
$0
5
$124,078
8
$67,095
1
$20,260
0
$0
APPLICATIONS DENIED
0
$0
6
$92,162
16
$94,311
4
$22,288
1
$97,630
APPLICATIONS WITHDRAWN
0
$0
2
$158,965
8
$112,362
0
$0
0
$0
FILES CLOSED FOR INCOMPLETENESS
0
$0
0
$0
1
$249,410
0
$0
0
$0
Aggregated Statistics For Year 2000 (Based on 2 partial tracts)
A) FHA, FSA/RHS & VA Home Purchase Loans
B) Conventional Home Purchase Loans
C) Refinancings
D) Home Improvement Loans
E) Loans on Dwellings For 5+ Families
F) Non-occupant Loans on < 5 Family Dwellings (A B C & D)
Number
Average Value
Number
Average Value
Number
Average Value
Number
Average Value
Number
Average Value
Number
Average Value
LOANS ORIGINATED
1
$95,780
50
$124,527
34
$95,589
12
$23,823
1
$1,878,840
3
$74,170
APPLICATIONS APPROVED, NOT ACCEPTED
0
$0
2
$135,385
3
$137,537
3
$23,333
0
$0
0
$0
APPLICATIONS DENIED
0
$0
5
$77,290
8
$77,779
2
$69,995
0
$0
0
$0
APPLICATIONS WITHDRAWN
0
$0
2
$120,650
4
$53,602
0
$0
0
$0
1
$96,150
FILES CLOSED FOR INCOMPLETENESS
0
$0
0
$0
0
$0
0
$0
0
$0
0
$0
Aggregated Statistics For Year 1999 (Based on 1 partial tract)
A) FHA, FSA/RHS & VA Home Purchase Loans
B) Conventional Home Purchase Loans
C) Refinancings
D) Home Improvement Loans
F) Non-occupant Loans on < 5 Family Dwellings (A B C & D)


 Nearest zip codes: 53081, 53085, 53083, 53070, 53015, 53031.


 : $20,842,784 in 36 contracts from 2000 to 2006


