Estimated zip code population in 2022: 4,330 Zip code population in 2010: 4,013 Zip code population in 2000: 2,921
Houses and condos: 1,659 Renter-occupied apartments: 307
% of renters here:
19%
State:
32%
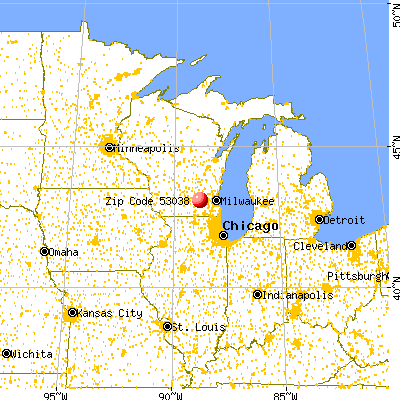
March 2022 cost of living index in zip code 53038: 80.6 (low, U.S. average is 100)
Land area: 30.2 sq. mi. Water area: 0.4 sq. mi.
Population density: 143 people per square mile
(very low).
OSM Map
General Map
Google Map
MSN Map
OSM Map
General Map
Google Map
MSN Map
OSM Map
General Map
Google Map
MSN Map
OSM Map
General Map
Google Map
MSN Map
Please wait while loading the map...
Real estate property taxes paid for housing units in 2022:
This zip code:
1.3% ($4,152)
Wisconsin:
1.4% ($3,497)
Median real estate property taxes paid for housing units with mortgages in 2022: $4,365 (1.3%) Median real estate property taxes paid for housing units with no mortgage in 2022: $3,503 (1.3%)
Estimated median house/condo value in 2022: $314,088
53038:
$314,088
Wisconsin:
$252,800
According to our research of Wisconsin and other state lists, there were 3 registered sex offenders living in 53038 zip code as of May 25, 2024. The ratio of all residents to sex offenders in zip code 53038 is 1,433 to 1. The ratio of registered sex offenders to all residents in this zip code is much lower than the state average.
Median resident age:
This zip code:
38.5 years
Wisconsin median age:
40.4 years
Average household size:
This zip code:
2.6 people
Wisconsin:
2.3 people
Averages for the 2020 tax year for zip code 53038, filed in 2021:
Average Adjusted Gross Income (AGI) in 2020: $73,815 (Individual Income Tax Returns)
Here:
$73,815
State:
$72,319
Salary/wage: $64,772 (reported on 86.7% of returns)
Here:
$64,772
State:
$59,242
(% of AGI for various income ranges: 1307.8% for AGIs below $25k, 3815.3% for AGIs $25k-50k, 6953.7% for AGIs $50k-75k, 9867.2% for AGIs $75k-100k, 19515.4% for AGIs $100k-200k, 42296.7% for AGIs over 200k)
Taxable interest for individuals: $453 (reported on 40.5% of returns)
This zip code:
$453
Wisconsin:
$1,431
(% of AGI for various income ranges: 20.3% for AGIs below $25k, 26.7% for AGIs $25k-50k, 21.9% for AGIs $50k-75k, 20.6% for AGIs $75k-100k, 35.0% for AGIs $100k-200k, 123.3% for AGIs over 200k)
Ordinary dividends: $2,418 (reported on 21.0% of returns)
Here:
$2,418
State:
$6,481
(% of AGI for various income ranges: 31.2% for AGIs below $25k, 38.6% for AGIs $25k-50k, 21.9% for AGIs $50k-75k, 48.3% for AGIs $75k-100k, 195.0% for AGIs $100k-200k, 573.3% for AGIs over 200k)
Net capital gain/loss in AGI: +$5,824 (reported on 19.5% of returns)
Here:
+$5,824
State:
+$18,329
(% of AGI for various income ranges: 34.7% for AGIs below $25k, 52.8% for AGIs $25k-50k, 32.6% for AGIs $50k-75k, 153.3% for AGIs $75k-100k, 375.0% for AGIs $100k-200k, 2493.3% for AGIs over 200k)
Profit/loss from business: +$15,284 (reported on 11.9% of returns)
Here:
+$15,284
State:
+$14,562
(% of AGI for various income ranges: 56.2% for AGIs below $25k, 99.4% for AGIs $25k-50k, 141.9% for AGIs $50k-75k, 354.4% for AGIs $75k-100k, 870.0% for AGIs $100k-200k)
Taxable individual retirement arrangement distribution: $14,696 (reported on 11.4% of returns)
53038:
$14,696
Wisconsin:
$19,348
(% of AGI for various income ranges: 122.2% for AGIs below $25k, 120.8% for AGIs $25k-50k, 246.7% for AGIs $50k-75k, 415.0% for AGIs $75k-100k, 495.4% for AGIs $100k-200k)
Total itemized deductions: $23,757 (reported on 6.7% of returns)
Here:
$23,757
State:
$33,000
(% of AGI for various income ranges: 193.8% for AGIs below $25k, 262.6% for AGIs $50k-75k, 320.6% for AGIs $75k-100k, 546.2% for AGIs $100k-200k)
Charity contributions: $5,244 (reported on 4.3% of returns)
Here:
$5,244
State:
$12,044
(% of AGI for various income ranges: 52.6% for AGIs $50k-75k, 126.9% for AGIs $100k-200k)
Taxes paid: $8,043 (reported on 6.7% of returns)
53038:
$8,043
State:
$8,228
(% of AGI for various income ranges: 32.8% for AGIs below $25k, 96.3% for AGIs $50k-75k, 141.7% for AGIs $75k-100k, 194.6% for AGIs $100k-200k)
Earned income credit: $1,853 (reported on 7.1% of returns)
Here:
$1,853
State:
$2,155
(% of AGI for various income ranges: 51.6% for AGIs below $25k, 31.4% for AGIs $25k-50k)
Percentage of individuals using paid preparers for their 2020 taxes: 94.3%
Here:
94%
State:
94%
(% for various income ranges: 90.0% for AGIs below $25k, 95.7% for AGIs $25k-50k, 97.2% for AGIs $50k-75k, 92.6% for AGIs $75k-100k, 97.7% for AGIs $100k-200k, 85.7% for AGIs over 200k)
Averages for the 2012 tax year for zip code 53038, filed in 2013:
Average Adjusted Gross Income (AGI) in 2012: $55,136 (Individual Income Tax Returns)
Here:
$55,136
State:
$57,939
Salary/wage: $51,147 (reported on 88.1% of returns)
Here:
$51,147
State:
$48,248
(% of AGI for various income ranges: 72.1% for AGIs below $25k, 80.1% for AGIs $25k-50k, 83.9% for AGIs $50k-75k, 87.7% for AGIs $75k-100k, 84.7% for AGIs $100k-200k, 65.8% for AGIs over 200k)
Taxable interest for individuals: $545 (reported on 37.6% of returns)
This zip code:
$545
Wisconsin:
$1,224
(% of AGI for various income ranges: 1.2% for AGIs below $25k, 0.6% for AGIs $25k-50k, 0.2% for AGIs $50k-75k, 0.2% for AGIs $75k-100k, 0.4% for AGIs $100k-200k, 0.2% for AGIs over 200k)
Ordinary dividends: $1,178 (reported on 21.1% of returns)
Here:
$1,178
State:
$5,137
(% of AGI for various income ranges: 1.6% for AGIs below $25k, 0.6% for AGIs $25k-50k, 0.4% for AGIs $50k-75k, 0.5% for AGIs $75k-100k, 0.3% for AGIs $100k-200k)
Net capital gain/loss in AGI: +$3,043 (reported on 15.5% of returns)
Here:
+$3,043
State:
+$11,137
(% of AGI for various income ranges: 0.6% for AGIs $25k-50k, 0.5% for AGIs $50k-75k, 0.7% for AGIs $75k-100k, 2.0% for AGIs $100k-200k)
Profit/loss from business: +$7,954 (reported on 12.4% of returns)
Here:
+$7,954
State:
+$11,943
(% of AGI for various income ranges: 6.6% for AGIs below $25k, 2.5% for AGIs $25k-50k, 1.2% for AGIs $50k-75k, 1.1% for AGIs $75k-100k, 1.7% for AGIs $100k-200k)
Taxable individual retirement arrangement distribution: $10,581 (reported on 10.8% of returns)
53038:
$10,581
Wisconsin:
$14,087
(% of AGI for various income ranges: 4.7% for AGIs below $25k, 3.3% for AGIs $25k-50k, 2.4% for AGIs $50k-75k, 1.7% for AGIs $75k-100k, 1.5% for AGIs $100k-200k)
Total itemized deductions: $19,582 (22% of AGI, reported on 40.2% of returns)
Here:
$19,582
State:
$22,257
Here:
21.9% of AGI
State:
20.1% of AGI
(% of AGI for various income ranges: 11.3% for AGIs below $25k, 9.4% for AGIs $25k-50k, 14.7% for AGIs $50k-75k, 16.5% for AGIs $75k-100k, 16.7% for AGIs $100k-200k, 11.8% for AGIs over 200k)
Charity contributions: $2,102 (reported on 30.4% of returns)
Here:
$2,102
State:
$3,370
(% of AGI for various income ranges: 0.5% for AGIs below $25k, 0.8% for AGIs $25k-50k, 1.3% for AGIs $50k-75k, 1.1% for AGIs $75k-100k, 1.5% for AGIs $100k-200k, 1.0% for AGIs over 200k)
Taxes paid: $8,849 (reported on 40.2% of returns)
53038:
$8,849
State:
$10,731
(% of AGI for various income ranges: 2.4% for AGIs below $25k, 3.3% for AGIs $25k-50k, 5.9% for AGIs $50k-75k, 7.3% for AGIs $75k-100k, 8.5% for AGIs $100k-200k, 8.1% for AGIs over 200k)
Earned income credit: $2,138 (reported on 10.8% of returns)
Here:
$2,138
State:
$2,094
(% of AGI for various income ranges: 4.0% for AGIs below $25k, 0.8% for AGIs $25k-50k)
Percentage of individuals using paid preparers for their 2012 taxes: 55.2%
Here:
55%
State:
54%
(% for various income ranges: 50.0% for AGIs below $25k, 56.5% for AGIs $25k-50k, 63.6% for AGIs $50k-75k, 53.8% for AGIs $75k-100k, 54.2% for AGIs $100k-200k, 66.7% for AGIs over 200k)
Averages for the 2004 tax year for zip code 53038, filed in 2005:
Average Adjusted Gross Income (AGI) in 2004: $43,490 (Individual Income Tax Returns)
Here:
$43,490
State:
$47,735
Salary/wage: $40,418 (reported on 89.7% of returns)
Here:
$40,418
State:
$41,540
(% of AGI for various income ranges: 95.3% for AGIs below $10k, 73.1% for AGIs $10k-25k, 86.9% for AGIs $25k-50k, 87.4% for AGIs $50k-75k, 83.8% for AGIs $75k-100k, 75.9% for AGIs over 100k)
Taxable interest for individuals: $654 (reported on 49.1% of returns)
This zip code:
$654
Wisconsin:
$1,420
(% of AGI for various income ranges: 2.4% for AGIs below $10k, 1.6% for AGIs $10k-25k, 1.0% for AGIs $25k-50k, 0.7% for AGIs $50k-75k, 0.3% for AGIs $75k-100k, 0.4% for AGIs over 100k)
Taxable dividends: $1,336 (reported on 25.8% of returns)
Here:
$1,336
State:
$2,869
(% of AGI for various income ranges: 1.3% for AGIs below $10k, 1.9% for AGIs $10k-25k, 1.0% for AGIs $25k-50k, 0.3% for AGIs $50k-75k, 0.2% for AGIs $75k-100k, 1.5% for AGIs over 100k)
Net capital gain/loss: +$4,423 (reported on 18.4% of returns)
Here:
+$4,423
State:
+$9,569
(% of AGI for various income ranges: 1.6% for AGIs below $10k, -0.3% for AGIs $10k-25k, 0.4% for AGIs $25k-50k, 1.2% for AGIs $50k-75k, 2.1% for AGIs $75k-100k, 5.3% for AGIs over 100k)
Profit/loss from business: +$8,343 (reported on 12.7% of returns)
Here:
+$8,343
State:
+$10,417
(% of AGI for various income ranges: 1.4% for AGIs below $10k, 4.4% for AGIs $10k-25k, 3.1% for AGIs $25k-50k, 2.4% for AGIs $50k-75k, 3.0% for AGIs $75k-100k, 0.5% for AGIs over 100k)
IRA payment deduction: $2,213 (reported on 2.8% of returns)
53038:
$2,213
Wisconsin:
$2,900
Total itemized deductions: $16,207 (23% of AGI, reported on 39.7% of returns)
Here:
$16,207
State:
$18,160
Here:
23.4% of AGI
State:
21.1% of AGI
(% of AGI for various income ranges: 16.7% for AGIs below $10k, 10.7% for AGIs $10k-25k, 11.3% for AGIs $25k-50k, 15.8% for AGIs $50k-75k, 17.3% for AGIs $75k-100k, 16.5% for AGIs over 100k)
Charity contributions deductions: $1,934 (3% of AGI, reported on 33.1% of returns)
Here:
$1,934
State:
$2,711
Here:
2.7% of AGI
State:
3.0% of AGI
(% of AGI for various income ranges: 0.6% for AGIs below $10k, 1.1% for AGIs $10k-25k, 1.1% for AGIs $25k-50k, 1.5% for AGIs $50k-75k, 1.5% for AGIs $75k-100k, 2.1% for AGIs over 100k)
Total tax: $5,041 (reported on 80.4% of returns)
53038:
$5,041
State:
$7,114
(% of AGI for various income ranges: 2.1% for AGIs below $10k, 4.5% for AGIs $10k-25k, 7.3% for AGIs $25k-50k, 8.3% for AGIs $50k-75k, 9.8% for AGIs $75k-100k, 15.3% for AGIs over 100k)
Earned income credit: $1,272 (reported on 7.6% of returns)
Here:
$1,272
State:
$1,544
Percentage of individuals using paid preparers for their 2004 taxes: 56.7%
Here:
57%
State:
57%
(% for various income ranges: 44.2% for AGIs below $10k, 60.8% for AGIs $10k-25k, 56.8% for AGIs $25k-50k, 58.8% for AGIs $50k-75k, 62.5% for AGIs $75k-100k, 62.6% for AGIs over 100k)
Likely homosexual households (counted as self-reported same-sex unmarried-partner households)
Lesbian couples: 0.5% of all households
Gay men: 0.0% of all households
Household received Food Stamps/SNAP in the past 12 months: 138 Household did not receive Food Stamps/SNAP in the past 12 months: 1,490
Women who had a birth in the past 12 months: 59 (52 now married, 6 unmarried) Women who did not have a birth in the past 12 months: 973 (444 now married, 529 unmarried)
Housing units in zip code 53038 with a mortgage: 881 (77 second mortgage, 58 both second mortgage and home equity loan) Houses without a mortgage: 6
Median monthly owner costs for units with a mortgage: $1,757 Median monthly owner costs for units without a mortgage: $675
Residents with income below the poverty level in 2022:
This zip code:
5.6%
Whole state:
10.7%
Residents with income below 50% of the poverty level in 2022:
This zip code:
2.0%
Whole state:
5.7%
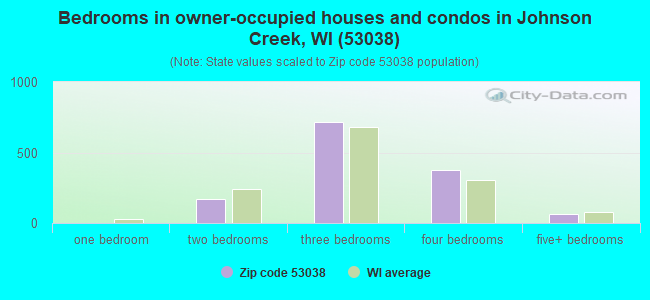
Median number of rooms in houses and condos:
Here:
6.5
State:
6.5
Median number of rooms in apartments:
Here:
4.9
State:
4.1
Notable locations in this zip code not listed on our city pages
In group quarters: 17 (-1 institutionalized population)
Size of family households: 494 2-persons, 288 3-persons, 239 4-persons, 83 5-persons, 20 6-persons, 30 7-or-more-persons
Size of nonfamily households: 359 1-person, 114 2-persons
691 married couples with children.
179 single-parent households (58 men, 121 women).
92.9% of residents of 53038 zip code speak English at home.
3.5% of residents speak Spanish at home (64% very well, 16% well, 20% not well).
0.7% of residents speak other Indo-European language at home (68% very well, 32% not well).
2.2% of residents speak Asian or Pacific Island language at home (31% very well, 35% well, 26% not well, 8% not at all).
Foreign born population: 161 (3.7%) (26.0% of them are naturalized citizens)
This zip code:
3.7%
Whole state:
5.0%
41%Honduras
39%Thailand
2%Czechoslovakia (includes Czech Republic and Slovakia)
2%Japan
1%Sweden
1%United Kingdom, excluding England and Scotland
1%Belize
47%German
6%Irish
5%English
4%Italian
3%Norwegian
3%American
3%Serbian
Year of entry for the foreign-born population
812010 or later
502000 to 2009
521990 to 1999
35Before 1990
Facilities with environmental interests located in this zip code:
ASHLAND COMPOSITE POLYMERS DIVISION (260 GRELL LANE in JOHNSON CREEK, WI)
AIR MINOR (AIRS/AFS) AIR SYNTHETIC MINOR (AIRS/AFS) CRITERIA AND HAZARDOUS AIR POLLUTANT INVENTORY (Inventory of air pollution sources) HAZARDOUS WASTE BIENNIAL REPORTER (Resource Conservation and Recovery Act (tracking hazardous waste)) - ICIS-, ENFORCEMENT/COMPLIANCE ACTIVITY Large Quantity Generators, more that 1000 kg of hazardous waste/month (Resource Conservation and Recovery Act (tracking hazardous waste)) - notification - ICIS-, ENFORCEMENT/COMPLIANCE ACTIVITY TRI REPORTER (Tracking of toxic chemicals releasing facilities) STATE MASTER (Wisconsin database) - TRIS-53186PLYDY1606P, TRI REPORTER, RCRAINFO-WIR000001719, LQG Business SIC classification: PLASTICS MATERIALS, SYNTHETIC RESINS, AND NONVULCANIZABLE ELASTOMERS; CUSTOM COMPOUNDING OF PURCHASED PLASTICS RESINS; PLASTICS PRODUCTS Business NAICS classification: PLASTICS MATERIAL AND RESIN MANUFACTURING.; PLASTICS MATERIAL AND RESIN MANUFACTURING.; CUSTOM COMPOUNDING OF PURCHASED RESINS. Organizations: ASHLAND SPECIALTY CHEMICAL CO, ASHLAND INC (CONTACT/OPERATOR)
Alternative names: ASHLAND SPECIALTY CHEMICAL CO, ASHLAND SPECIALTY CHEMICAL CO., POLYDYNE INC.
Housing units lacking complete plumbing facilities: 1.1% Housing units lacking complete kitchen facilities: 1.2%
61.0%Utility gas
17.2%Bottled, tank, or LP gas
16.4%Electricity
3.5%Fuel oil, kerosene, etc.
2.0%Wood
Population in 1990: 2,469. Population change in the 1990s: +452 (+18.3%).
Place of birth for U.S.-born residents:
This state: 3,438
Northeast: 19
Midwest: 428
South: 104
West: 110
56% of the 53038 zip code residents lived in the same house 5 years ago. Out of people who lived in different houses, 55% lived in this county. Out of people who lived in different counties, 50% lived in Wisconsin.
92% of the 53038 zip code residents lived in the same house 1 year ago. Out of people who lived in different houses, 46% moved from this county. Out of people who lived in different houses, 35% moved from different county within same state. Out of people who lived in different houses, 18% moved from different state.
Private vs. public school enrollment:
Students in private schools in grades 1 to 8 (elementary and middle school): 67
Here:
22.1%
Wisconsin:
16.7%
Students in private schools in grades 9 to 12 (high school): 48
Here:
17.6%
Wisconsin:
12.5%
Students in private undergraduate colleges: 68
Here:
33.7%
Wisconsin:
17.5%
Occupation by median earnings in the past 12 months ($)
87,321Computer and mathematical occupations
86,488Management occupations
83,987Law enforcement workers including supervisors
71,155Life, physical, and social science occupations
68,341Fire fighting and prevention, and other protective service workers including supervisors
67,961Arts, design, entertainment, sports, and media occupations
Companies with federal contracts located in this zip code:
PIONEER ROOFING INC (151 MAPLE ST in JOHNSON CREEK, WI; small business) : $172,518 in 2 contractsfrom 1999 to 2000
$159,246 with Army for Maintenance, Repair or Alteration of Real Property -- Office Buildings. Signed on 1999-11-15. Completion date: 2000-01-13.
$13,272, same as above.Signed on 2000-07-06. Completion date: 2000-09-13.
RIVERSIDE TELECOM INC (121 DEPOT ST in JOHNSON CREEK, WI; small business)
$28,000 with Occupational Safety and Health Administration for Telephone and Telegraph Equipment. Signed on 2000-09-15. Completion date: 2000-10-15.
Top industries in this zip code by the number of employees in 2005:
Accommodation and Food Services: Limited-Service Restaurants (20-49: 1, 10-19: 1)
People in group quarters in 2010:
11 people in group homes intended for adults
People in group quarters in 2000:
2 people in homes for the mentally retarded
Fatal accident statistics in 2014:
Fatal accident count: 2
Vehicles involved in fatal accidents: 3
Fatal accidents caused by drunken drivers: 0
Fatalities: 2
Persons involved in fatal accidents: 5
Pedestrians involved in fatal accidents: 0
Fatal accident statistics in 2013:
Fatal accident count: 1
Vehicles involved in fatal accidents: 1
Fatal accidents caused by drunken drivers: 1
Fatalities: 1
Persons involved in fatal accidents: 1
Pedestrians involved in fatal accidents: 0
2003 - 2018 National Fire Incident Reporting System (NFIRS) incidents
Based on the data from the years 2003 - 2018 the average number of fire incidents per year is 20. The highest number of fire incidents - 50 took place in 2012, and the least - 1 in 2007. The data has a dropping trend.
When looking into fire subcategories, the most reports belonged to: Structure Fires (44.4%), and Outside Fires (30.6%).
Fire incident types reported to NFIRS in Zip Code 53038


 Nearest zip codes: 53094, 53549, 53551, 53137, 53538, 53098.


 Based on the data from the years 2003 - 2018 the average number of fire incidents per year is 20. The highest number of fire incidents - 50 took place in 2012, and the least - 1 in 2007. The data has a dropping trend.
 When looking into fire subcategories, the most reports belonged to: Structure Fires (44.4%), and Outside Fires (30.6%).