Estimated zip code population in 2022: 3,732 Zip code population in 2010: 3,308 Zip code population in 2000: 3,056
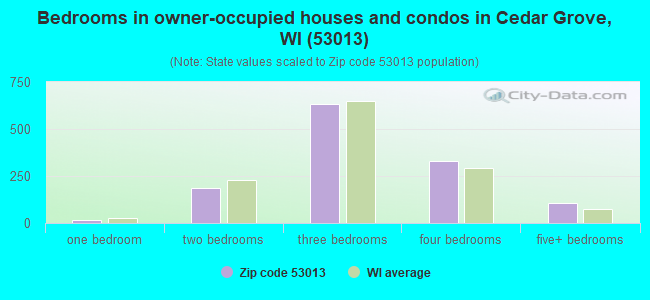
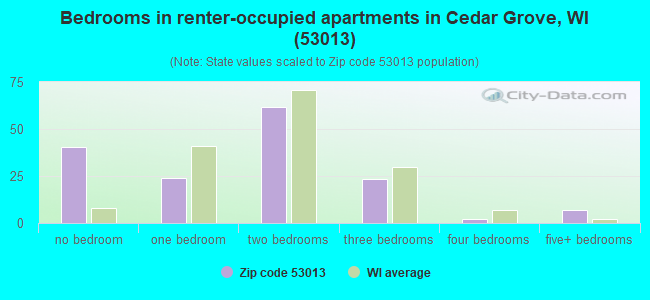
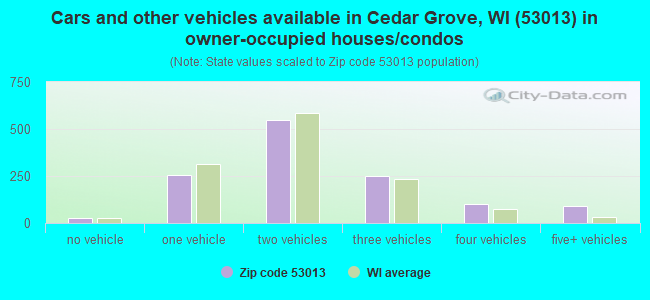
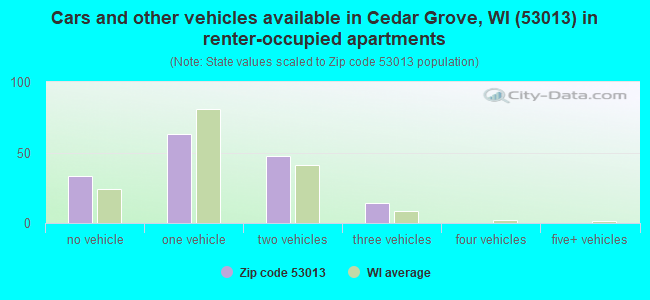
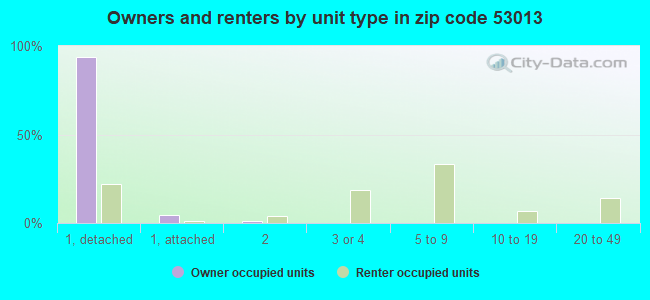
Houses and condos: 1,519 Renter-occupied apartments: 158
% of renters here:
11%
State:
32%
March 2022 cost of living index in zip code 53013: 87.0 (less than average, U.S. average is 100)
Land area: 28.8 sq. mi. Water area: 0.7 sq. mi.
Population density: 129 people per square mile
(very low).
OSM Map
General Map
Google Map
MSN Map
OSM Map
General Map
Google Map
MSN Map
OSM Map
General Map
Google Map
MSN Map
OSM Map
General Map
Google Map
MSN Map
Please wait while loading the map...
Real estate property taxes paid for housing units in 2022:
This zip code:
1.4% ($3,764)
Wisconsin:
1.4% ($3,497)
Median real estate property taxes paid for housing units with mortgages in 2022: $3,775 (1.3%) Median real estate property taxes paid for housing units with no mortgage in 2022: $3,765 (1.5%)
Business Search- 14 Million verified businesses
Males: 1,990
(53.3%)
Females: 1,742
(46.7%)
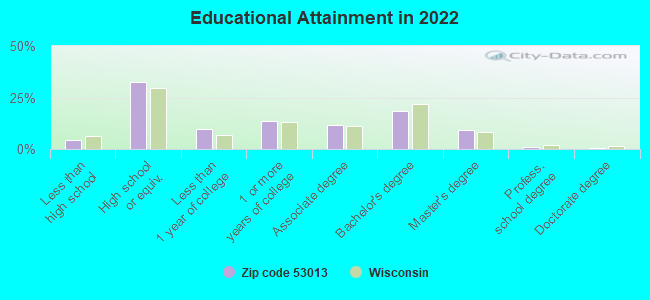
For population 25 years and over in 53013:
High school or higher: 95.7%
Bachelor's degree or higher: 28.6%
Graduate or professional degree: 10.4%
Unemployed: 2.3%
Mean travel time to work (commute): 26.2 minutes
For population 15 years and over in 53013:
Never married: 21.5%
Now married: 65.0%
Separated: 0.6%
Widowed: 6.1%
Divorced: 6.8%
Zip code 53013 compared to state average:
Black race population percentage significantly below state average.
Median age above state average.
Renting percentage significantly below state average.
Length of stay since moving in above state average.
Estimated median house/condo value in 2022: $268,204
53013:
$268,204
Wisconsin:
$252,800
According to our research of Wisconsin and other state lists, there were 4 registered sex offenders living in 53013 zip code as of May 26, 2024. The ratio of all residents to sex offenders in zip code 53013 is 827 to 1. The ratio of registered sex offenders to all residents in this zip code is lower than the state average.
Median resident age:
This zip code:
44.7 years
Wisconsin median age:
40.4 years
Average household size:
This zip code:
2.6 people
Wisconsin:
2.3 people
Averages for the 2020 tax year for zip code 53013, filed in 2021:
Average Adjusted Gross Income (AGI) in 2020: $71,182 (Individual Income Tax Returns)
Here:
$71,182
State:
$72,319
Salary/wage: $63,608 (reported on 82.1% of returns)
Here:
$63,608
State:
$59,242
(% of AGI for various income ranges: 1270.4% for AGIs below $25k, 3847.6% for AGIs $25k-50k, 6607.4% for AGIs $50k-75k, 10050.8% for AGIs $75k-100k, 20626.1% for AGIs $100k-200k, 60550.0% for AGIs over 200k)
Taxable interest for individuals: $1,363 (reported on 42.3% of returns)
This zip code:
$1,363
Wisconsin:
$1,431
(% of AGI for various income ranges: 43.8% for AGIs below $25k, 34.8% for AGIs $25k-50k, 56.3% for AGIs $50k-75k, 87.7% for AGIs $75k-100k, 175.0% for AGIs $100k-200k, 1155.0% for AGIs over 200k)
Ordinary dividends: $5,077 (reported on 28.6% of returns)
Here:
$5,077
State:
$6,481
(% of AGI for various income ranges: 66.2% for AGIs below $25k, 71.2% for AGIs $25k-50k, 163.7% for AGIs $50k-75k, 226.9% for AGIs $75k-100k, 453.3% for AGIs $100k-200k, 3325.0% for AGIs over 200k)
Net capital gain/loss in AGI: +$7,943 (reported on 25.0% of returns)
Here:
+$7,943
State:
+$18,329
(% of AGI for various income ranges: 23.5% for AGIs below $25k, 68.4% for AGIs $25k-50k, 110.5% for AGIs $50k-75k, 353.8% for AGIs $75k-100k, 638.3% for AGIs $100k-200k, 6425.0% for AGIs over 200k)
Profit/loss from business: +$12,847 (reported on 11.3% of returns)
Here:
+$12,847
State:
+$14,562
(% of AGI for various income ranges: 91.2% for AGIs below $25k, 66.0% for AGIs $25k-50k, 135.3% for AGIs $50k-75k, 280.8% for AGIs $75k-100k, 787.2% for AGIs $100k-200k)
Taxable individual retirement arrangement distribution: $16,559 (reported on 16.1% of returns)
53013:
$16,559
Wisconsin:
$19,348
(% of AGI for various income ranges: 191.9% for AGIs below $25k, 254.4% for AGIs $25k-50k, 412.1% for AGIs $50k-75k, 583.1% for AGIs $75k-100k, 997.2% for AGIs $100k-200k)
Total itemized deductions: $30,471 (reported on 8.3% of returns)
Here:
$30,471
State:
$33,000
(% of AGI for various income ranges: 518.4% for AGIs $50k-75k, 666.9% for AGIs $75k-100k, 767.2% for AGIs $100k-200k, 5165.0% for AGIs over 200k)
Charity contributions: $10,736 (reported on 6.5% of returns)
Here:
$10,736
State:
$12,044
(% of AGI for various income ranges: 37.6% for AGIs $25k-50k, 85.4% for AGIs $75k-100k, 277.2% for AGIs $100k-200k, 2385.0% for AGIs over 200k)
Taxes paid: $8,407 (reported on 8.3% of returns)
53013:
$8,407
State:
$8,228
(% of AGI for various income ranges: 120.0% for AGIs $50k-75k, 181.5% for AGIs $75k-100k, 262.2% for AGIs $100k-200k, 1205.0% for AGIs over 200k)
Earned income credit: $1,945 (reported on 6.5% of returns)
Here:
$1,945
State:
$2,155
(% of AGI for various income ranges: 55.0% for AGIs below $25k, 28.4% for AGIs $25k-50k)
Percentage of individuals using paid preparers for their 2020 taxes: 95.2%
Here:
95%
State:
94%
(% for various income ranges: 91.1% for AGIs below $25k, 97.1% for AGIs $25k-50k, 96.3% for AGIs $50k-75k, 95.2% for AGIs $75k-100k, 97.1% for AGIs $100k-200k, 100.0% for AGIs over 200k)
Averages for the 2012 tax year for zip code 53013, filed in 2013:
Average Adjusted Gross Income (AGI) in 2012: $59,149 (Individual Income Tax Returns)
Here:
$59,149
State:
$57,939
Salary/wage: $50,662 (reported on 85.1% of returns)
Here:
$50,662
State:
$48,248
(% of AGI for various income ranges: 72.1% for AGIs below $25k, 76.6% for AGIs $25k-50k, 76.6% for AGIs $50k-75k, 80.1% for AGIs $75k-100k, 76.4% for AGIs $100k-200k, 44.0% for AGIs over 200k)
Taxable interest for individuals: $1,668 (reported on 42.2% of returns)
This zip code:
$1,668
Wisconsin:
$1,224
(% of AGI for various income ranges: 2.8% for AGIs below $25k, 1.4% for AGIs $25k-50k, 0.7% for AGIs $50k-75k, 1.0% for AGIs $75k-100k, 1.0% for AGIs $100k-200k, 1.7% for AGIs over 200k)
Ordinary dividends: $3,980 (reported on 31.1% of returns)
Here:
$3,980
State:
$5,137
(% of AGI for various income ranges: 4.2% for AGIs below $25k, 1.1% for AGIs $25k-50k, 1.5% for AGIs $50k-75k, 1.4% for AGIs $75k-100k, 2.7% for AGIs $100k-200k, 2.6% for AGIs over 200k)
Net capital gain/loss in AGI: +$7,058 (reported on 22.4% of returns)
Here:
+$7,058
State:
+$11,137
(% of AGI for various income ranges: 0.6% for AGIs $25k-50k, 1.5% for AGIs $50k-75k, 0.9% for AGIs $75k-100k, 2.7% for AGIs $100k-200k, 10.7% for AGIs over 200k)
Profit/loss from business: +$9,343 (reported on 13.0% of returns)
Here:
+$9,343
State:
+$11,943
(% of AGI for various income ranges: 4.8% for AGIs below $25k, 2.9% for AGIs $25k-50k, 2.4% for AGIs $50k-75k, 1.8% for AGIs $75k-100k, 2.0% for AGIs $100k-200k)
Taxable individual retirement arrangement distribution: $14,086 (reported on 17.4% of returns)
53013:
$14,086
Wisconsin:
$14,087
(% of AGI for various income ranges: 9.0% for AGIs below $25k, 6.7% for AGIs $25k-50k, 2.3% for AGIs $50k-75k, 2.8% for AGIs $75k-100k, 5.9% for AGIs $100k-200k)
Total itemized deductions: $21,093 (23% of AGI, reported on 45.3% of returns)
Here:
$21,093
State:
$22,257
Here:
23.1% of AGI
State:
20.1% of AGI
(% of AGI for various income ranges: 17.1% for AGIs below $25k, 13.4% for AGIs $25k-50k, 15.8% for AGIs $50k-75k, 15.7% for AGIs $75k-100k, 18.6% for AGIs $100k-200k, 14.1% for AGIs over 200k)
Charity contributions: $4,241 (reported on 37.9% of returns)
Here:
$4,241
State:
$3,370
(% of AGI for various income ranges: 1.8% for AGIs below $25k, 1.7% for AGIs $25k-50k, 2.3% for AGIs $50k-75k, 2.8% for AGIs $75k-100k, 3.5% for AGIs $100k-200k, 2.9% for AGIs over 200k)
Taxes paid: $9,232 (reported on 45.3% of returns)
53013:
$9,232
State:
$10,731
(% of AGI for various income ranges: 4.0% for AGIs below $25k, 4.2% for AGIs $25k-50k, 6.1% for AGIs $50k-75k, 7.1% for AGIs $75k-100k, 9.2% for AGIs $100k-200k, 7.7% for AGIs over 200k)
Earned income credit: $2,054 (reported on 8.1% of returns)
Here:
$2,054
State:
$2,094
(% of AGI for various income ranges: 3.2% for AGIs below $25k, 0.7% for AGIs $25k-50k)
Percentage of individuals using paid preparers for their 2012 taxes: 59.0%
Here:
59%
State:
54%
(% for various income ranges: 54.0% for AGIs below $25k, 60.0% for AGIs $25k-50k, 60.7% for AGIs $50k-75k, 59.1% for AGIs $75k-100k, 63.6% for AGIs $100k-200k, 75.0% for AGIs over 200k)
Averages for the 2004 tax year for zip code 53013, filed in 2005:
Average Adjusted Gross Income (AGI) in 2004: $49,232 (Individual Income Tax Returns)
Here:
$49,232
State:
$47,735
Salary/wage: $42,832 (reported on 87.0% of returns)
Here:
$42,832
State:
$41,540
(% of AGI for various income ranges: 89.1% for AGIs below $10k, 68.8% for AGIs $10k-25k, 79.9% for AGIs $25k-50k, 82.9% for AGIs $50k-75k, 81.9% for AGIs $75k-100k, 61.6% for AGIs over 100k)
Taxable interest for individuals: $1,718 (reported on 59.2% of returns)
This zip code:
$1,718
Wisconsin:
$1,420
(% of AGI for various income ranges: 4.6% for AGIs below $10k, 4.5% for AGIs $10k-25k, 1.8% for AGIs $25k-50k, 1.4% for AGIs $50k-75k, 1.0% for AGIs $75k-100k, 3.0% for AGIs over 100k)
Taxable dividends: $3,034 (reported on 33.9% of returns)
Here:
$3,034
State:
$2,869
(% of AGI for various income ranges: 4.7% for AGIs below $10k, 3.0% for AGIs $10k-25k, 2.2% for AGIs $25k-50k, 1.1% for AGIs $50k-75k, 1.0% for AGIs $75k-100k, 3.5% for AGIs over 100k)
Net capital gain/loss: +$6,021 (reported on 23.8% of returns)
Here:
+$6,021
State:
+$9,569
(% of AGI for various income ranges: -0.8% for AGIs below $10k, 1.1% for AGIs $10k-25k, 1.6% for AGIs $25k-50k, 1.1% for AGIs $50k-75k, 2.0% for AGIs $75k-100k, 6.9% for AGIs over 100k)
Profit/loss from business: +$14,588 (reported on 12.9% of returns)
Here:
+$14,588
State:
+$10,417
(% of AGI for various income ranges: 3.7% for AGIs below $10k, 2.0% for AGIs $10k-25k, 3.1% for AGIs $25k-50k, 2.1% for AGIs $50k-75k, 3.3% for AGIs $75k-100k, 6.8% for AGIs over 100k)
IRA payment deduction: $3,039 (reported on 3.2% of returns)
53013:
$3,039
Wisconsin:
$2,900
Self-employed pension: $14,222 (reported on 1.1% of returns)
Here:
$14,222
Wisconsin:
$11,934
Total itemized deductions: $17,859 (24% of AGI, reported on 49.2% of returns)
Here:
$17,859
State:
$18,160
Here:
24.1% of AGI
State:
21.1% of AGI
(% of AGI for various income ranges: 22.3% for AGIs below $10k, 14.7% for AGIs $10k-25k, 16.2% for AGIs $25k-50k, 17.1% for AGIs $50k-75k, 18.9% for AGIs $75k-100k, 19.1% for AGIs over 100k)
Charity contributions deductions: $3,131 (4% of AGI, reported on 43.3% of returns)
Here:
$3,131
State:
$2,711
Here:
4.2% of AGI
State:
3.0% of AGI
(% of AGI for various income ranges: 2.4% for AGIs below $10k, 2.6% for AGIs $10k-25k, 2.1% for AGIs $25k-50k, 2.2% for AGIs $50k-75k, 3.0% for AGIs $75k-100k, 3.5% for AGIs over 100k)
Total tax: $5,785 (reported on 80.6% of returns)
53013:
$5,785
State:
$7,114
(% of AGI for various income ranges: 2.5% for AGIs below $10k, 4.6% for AGIs $10k-25k, 6.9% for AGIs $25k-50k, 7.7% for AGIs $50k-75k, 9.1% for AGIs $75k-100k, 14.7% for AGIs over 100k)
Earned income credit: $1,276 (reported on 5.5% of returns)
Here:
$1,276
State:
$1,544
Percentage of individuals using paid preparers for their 2004 taxes: 57.4%
Here:
57%
State:
57%
(% for various income ranges: 47.8% for AGIs below $10k, 55.1% for AGIs $10k-25k, 57.1% for AGIs $25k-50k, 63.0% for AGIs $50k-75k, 58.4% for AGIs $75k-100k, 68.5% for AGIs over 100k)
Likely homosexual households (counted as self-reported same-sex unmarried-partner households)
Lesbian couples: 0.2% of all households
Gay men: 0.0% of all households
Household received Food Stamps/SNAP in the past 12 months: 41 Household did not receive Food Stamps/SNAP in the past 12 months: 1,368
Women who had a birth in the past 12 months: 18 (18 now married, 0 unmarried) Women who did not have a birth in the past 12 months: 713 (441 now married, 272 unmarried)
Housing units in zip code 53013 with a mortgage: 711 (101 second mortgage, 8 home equity loan, 79 both second mortgage and home equity loan) Houses without a mortgage: 11
Median monthly owner costs for units with a mortgage: $1,719 Median monthly owner costs for units without a mortgage: $678
Residents with income below the poverty level in 2022:
This zip code:
7.4%
Whole state:
10.7%
Residents with income below 50% of the poverty level in 2022:
This zip code:
4.3%
Whole state:
5.7%
Median number of rooms in houses and condos:
Here:
6.9
State:
6.5
Median number of rooms in apartments:
Here:
3.7
State:
4.1
Notable locations in this zip code not listed on our city pages
Churches in zip code 53013 include: First Reformed Church (A), First Presbyterian Church (B), Faith Reformed Church (C), Calvary Orthodox Presbyterian Church (D). Display/hide their locations on the map
In group quarters: 2 (-1 institutionalized population)
Size of family households: 471 2-persons, 172 3-persons, 174 4-persons, 89 5-persons, 35 6-persons, 16 7-or-more-persons
Size of nonfamily households: 404 1-person, 48 2-persons, 5 3-persons
690 married couples with children.
42 single-parent households (30 men, 12 women).
96.1% of residents of 53013 zip code speak English at home.
1.3% of residents speak Spanish at home (2% very well, 91% well, 6% not well).
0.9% of residents speak other Indo-European language at home (52% very well, 33% well, 15% not well).
1.8% of residents speak Asian or Pacific Island language at home (53% very well, 28% well, 19% not well).
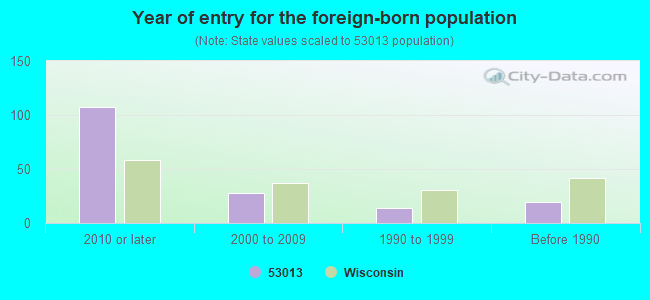
Foreign born population: 156 (4.2%) (24.9% of them are naturalized citizens)
This zip code:
4.2%
Whole state:
5.0%
31%Honduras
19%Singapore
6%Malaysia
5%Lithuania
3%Bosnia and Herzegovina
3%Indonesia
2%Belgium
30%German
30%Dutch
6%American
3%English
2%French Canadian
2%Irish
2%Finnish
Year of entry for the foreign-born population
1072010 or later
282000 to 2009
141990 to 1999
19Before 1990
Facilities with environmental interests located in this zip code:
CEDAR GROVE BELGIUM AREA SCHOOL (50 W UNION AVE in CEDAR GROVE, WI)
COMPLIANCE ACTIVITY (Tracking inspections of insecticide, fungicide, and rodenticide, and toxic substances) (National Center for Education Statistics) - STATE ID-0020 (Resource Conservation and Recovery Act (tracking hazardous waste)) Organizations: CEDAR GROVE-BELGIUM AREA SCH D (SCHOOL DISTRICT)
Alternative names: CEDAR GROVE BELGIUM SD
CEDAR GROVE WASTEWATER TRTMNT FACIL (NWQ SEQ SEC 24 T13N R22E in CEDAR GROVE, WI)
National Pollutant Discharge Elimination System NON-MAJOR (Tracking pollutant discharge elimination systems) - permit National Pollutant Discharge Elimination System NON-MAJOR (Tracking pollutant discharge elimination systems) - permit STATE MASTER (Wisconsin database) - PCS-WI0020711, WASTEWATER FACILITY Business SIC classification: SEWERAGE SYSTEMS Organizations: CEDAR GROVE WASTEWATER TREATMENT FACILITY Alternative names: CEDAR GROVE VILLAGE
BUHLER JOHN (2121 HWY KW in CEDAR GROVE, WI)
(Resource Conservation and Recovery Act (tracking hazardous waste)) STATE MASTER (Wisconsin database) - RCRAINFO-WID988581658, CESQG
CEDAR GROVE TRUCK STOP (N904 SAUK TRAIL RD in CEDAR GROVE, WI)
Conditionally Exempt Small Quantity Generators, less than 100 kg/month of hazardous waste (Resource Conservation and Recovery Act (tracking hazardous waste)) STATE MASTER (Wisconsin database) - RCRAINFO-WID988616090, CESQG, HAZARDOUS WASTE PROGRAM Alternative names: TUENISSEN EUGUENE PROPERTY
CEDAR GROVE HI (321 N 2ND ST in CEDAR GROVE, WI)
(National Center for Education Statistics) - STATE ID-0040 Organizations: CEDAR GROVE-BELGIUM AREA SCH D (SCHOOL DISTRICT)
CEDAR GROVE MID (50 W UNION AVE in CEDAR GROVE, WI)
(National Center for Education Statistics) - STATE ID-0200 Organizations: CEDAR GROVE-BELGIUM AREA SCH D (SCHOOL DISTRICT)
AMERITECH L9406 (NO CNTY HWY D .3MI W S HWY 141 in CEDAR GROVE, WI)
(Resource Conservation and Recovery Act (tracking hazardous waste))
Housing units lacking complete plumbing facilities: 0.3% Housing units lacking complete kitchen facilities: 1.9%
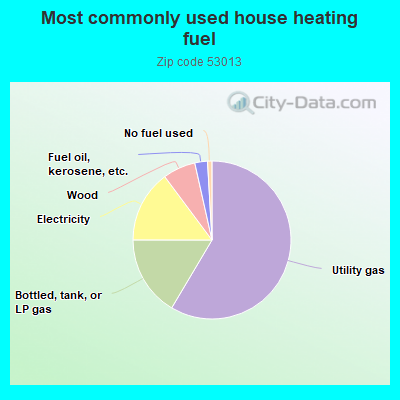
58.6%Utility gas
16.5%Bottled, tank, or LP gas
14.8%Electricity
6.7%Wood
2.6%Fuel oil, kerosene, etc.
0.9%No fuel used
Population in 1990: 2,656. Population change in the 1990s: +400 (+15.1%).
Place of birth for U.S.-born residents:
This state: 3,131
Northeast: 11
Midwest: 288
South: 48
West: 80
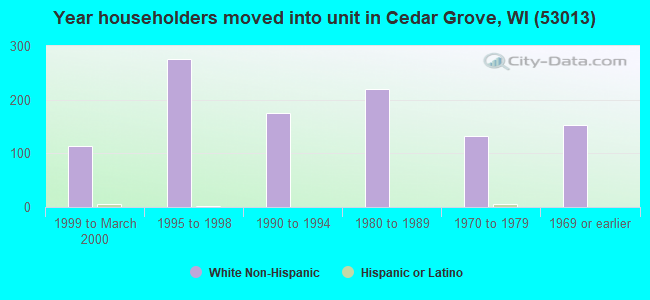
67% of the 53013 zip code residents lived in the same house 5 years ago. Out of people who lived in different houses, 56% lived in this county. Out of people who lived in different counties, 50% lived in Wisconsin.
91% of the 53013 zip code residents lived in the same house 1 year ago. Out of people who lived in different houses, 28% moved from this county. Out of people who lived in different houses, 59% moved from different county within same state. Out of people who lived in different houses, 14% moved from different state. Out of people who lived in different houses, 1% moved from abroad.
Private vs. public school enrollment:
Students in private schools in grades 1 to 8 (elementary and middle school): 55
Here:
12.8%
Wisconsin:
16.7%
Students in private schools in grades 9 to 12 (high school):
Here:
0.0%
Wisconsin:
12.5%
Students in private undergraduate colleges: 46
Here:
42.7%
Wisconsin:
17.5%
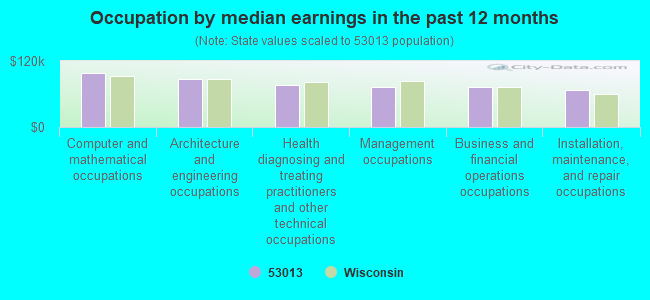
Occupation by median earnings in the past 12 months ($)
98,988Computer and mathematical occupations
88,076Architecture and engineering occupations
75,493Health diagnosing and treating practitioners and other technical occupations
73,158Management occupations
72,978Business and financial operations occupations
68,155Installation, maintenance, and repair occupations
Top industries in this zip code by the number of employees in 2005:
Accommodation and Food Services: Full-Service Restaurants (20-49 employees: 1 establishment)
Other Services (except Public Administration): Religious Organizations (5-9: 3, 1-4: 2)
Construction: New Single-Family Housing Construction (except Operative Builders) (5-9: 2, 1-4: 1)
People in group quarters in 2010:
3 people in group homes intended for adults
People in group quarters in 2000:
3 people in other noninstitutional group quarters
Fatal accident statistics in 2014:
Fatal accident count: 1
Vehicles involved in fatal accidents: 1
Fatal accidents caused by drunken drivers: 1
Fatalities: 1
Persons involved in fatal accidents: 1
Pedestrians involved in fatal accidents: 0
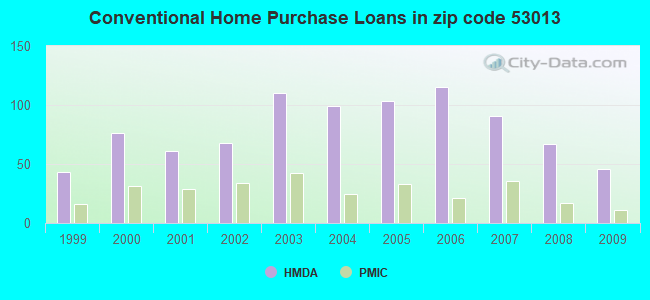
Home Mortgage Disclosure Act Aggregated Statistics For Year 2009 (Based on 2 partial tracts)
A) FHA, FSA/RHS & VA Home Purchase Loans
B) Conventional Home Purchase Loans
C) Refinancings
D) Home Improvement Loans
F) Non-occupant Loans on < 5 Family Dwellings (A B C & D)
Number
Average Value
Number
Average Value
Number
Average Value
Number
Average Value
Number
Average Value
LOANS ORIGINATED
14
$134,969
46
$125,947
374
$145,420
15
$63,736
28
$268,695
APPLICATIONS APPROVED, NOT ACCEPTED
2
$163,775
3
$214,613
35
$162,021
2
$68,070
3
$408,757
APPLICATIONS DENIED
5
$111,572
3
$179,813
58
$151,316
6
$9,383
2
$127,950
APPLICATIONS WITHDRAWN
1
$99,290
3
$235,770
40
$176,648
3
$125,220
5
$357,236
FILES CLOSED FOR INCOMPLETENESS
1
$56,300
0
$0
5
$149,036
0
$0
0
$0
Aggregated Statistics For Year 2008 (Based on 2 partial tracts)
A) FHA, FSA/RHS & VA Home Purchase Loans
B) Conventional Home Purchase Loans
C) Refinancings
D) Home Improvement Loans
F) Non-occupant Loans on < 5 Family Dwellings (A B C & D)
Number
Average Value
Number
Average Value
Number
Average Value
Number
Average Value
Number
Average Value
LOANS ORIGINATED
9
$147,967
67
$151,584
199
$152,306
25
$42,172
17
$207,369
APPLICATIONS APPROVED, NOT ACCEPTED
0
$0
4
$141,258
18
$167,871
5
$62,850
3
$308,443
APPLICATIONS DENIED
0
$0
1
$133,070
61
$170,253
9
$31,390
2
$279,955
APPLICATIONS WITHDRAWN
2
$196,530
2
$85,980
23
$180,065
4
$55,018
0
$0
FILES CLOSED FOR INCOMPLETENESS
0
$0
0
$0
5
$91,306
4
$84,960
1
$76,770
Aggregated Statistics For Year 2007 (Based on 2 partial tracts)
A) FHA, FSA/RHS & VA Home Purchase Loans
B) Conventional Home Purchase Loans
C) Refinancings
D) Home Improvement Loans
E) Loans on Dwellings For 5+ Families
F) Non-occupant Loans on < 5 Family Dwellings (A B C & D)
G) Loans On Manufactured Home Dwelling (A B C & D)
Number
Average Value
Number
Average Value
Number
Average Value
Number
Average Value
Number
Average Value
Number
Average Value
Number
Average Value
LOANS ORIGINATED
5
$160,092
91
$159,097
153
$139,986
47
$45,409
1
$839,350
26
$200,311
1
$6,140
APPLICATIONS APPROVED, NOT ACCEPTED
0
$0
8
$174,140
16
$117,842
6
$19,790
0
$0
1
$211,890
0
$0
APPLICATIONS DENIED
1
$201,650
18
$130,224
56
$138,204
7
$13,453
0
$0
3
$363,037
0
$0
APPLICATIONS WITHDRAWN
0
$0
8
$171,452
34
$139,992
3
$47,087
0
$0
3
$170,940
0
$0
FILES CLOSED FOR INCOMPLETENESS
0
$0
0
$0
8
$176,188
0
$0
0
$0
1
$413,530
0
$0
Aggregated Statistics For Year 2006 (Based on 2 partial tracts)
A) FHA, FSA/RHS & VA Home Purchase Loans
B) Conventional Home Purchase Loans
C) Refinancings
D) Home Improvement Loans
F) Non-occupant Loans on < 5 Family Dwellings (A B C & D)
Number
Average Value
Number
Average Value
Number
Average Value
Number
Average Value
Number
Average Value
LOANS ORIGINATED
2
$161,215
115
$139,049
163
$128,032
45
$51,794
30
$262,724
APPLICATIONS APPROVED, NOT ACCEPTED
0
$0
5
$168,690
15
$170,054
3
$23,200
1
$409,440
APPLICATIONS DENIED
0
$0
9
$127,153
54
$133,940
8
$91,740
0
$0
APPLICATIONS WITHDRAWN
1
$168,890
4
$137,418
27
$118,017
5
$75,746
0
$0
FILES CLOSED FOR INCOMPLETENESS
0
$0
1
$101,340
16
$159,809
1
$28,660
0
$0
Aggregated Statistics For Year 2005 (Based on 2 partial tracts)
A) FHA, FSA/RHS & VA Home Purchase Loans
B) Conventional Home Purchase Loans
C) Refinancings
D) Home Improvement Loans
E) Loans on Dwellings For 5+ Families
F) Non-occupant Loans on < 5 Family Dwellings (A B C & D)
G) Loans On Manufactured Home Dwelling (A B C & D)
Number
Average Value
Number
Average Value
Number
Average Value
Number
Average Value
Number
Average Value
Number
Average Value
Number
Average Value
LOANS ORIGINATED
8
$146,246
103
$149,048
169
$134,467
31
$32,392
1
$300,940
23
$265,913
0
$0
APPLICATIONS APPROVED, NOT ACCEPTED
1
$243,620
7
$109,817
12
$125,306
4
$28,150
0
$0
1
$83,940
0
$0
APPLICATIONS DENIED
0
$0
19
$122,940
46
$118,092
10
$61,825
0
$0
5
$132,044
1
$6,140
APPLICATIONS WITHDRAWN
0
$0
6
$142,963
35
$147,603
5
$79,226
0
$0
1
$133,070
0
$0
FILES CLOSED FOR INCOMPLETENESS
0
$0
7
$97,389
30
$145,283
0
$0
0
$0
0
$0
0
$0
Aggregated Statistics For Year 2004 (Based on 2 partial tracts)
A) FHA, FSA/RHS & VA Home Purchase Loans
B) Conventional Home Purchase Loans
C) Refinancings
D) Home Improvement Loans
F) Non-occupant Loans on < 5 Family Dwellings (A B C & D)
G) Loans On Manufactured Home Dwelling (A B C & D)
Number
Average Value
Number
Average Value
Number
Average Value
Number
Average Value
Number
Average Value
Number
Average Value
LOANS ORIGINATED
6
$150,810
99
$138,403
179
$118,154
40
$42,070
25
$175,158
1
$17,400
APPLICATIONS APPROVED, NOT ACCEPTED
2
$132,555
7
$125,026
10
$124,265
1
$6,140
2
$92,635
0
$0
APPLICATIONS DENIED
2
$87,005
10
$100,108
61
$107,327
15
$27,910
4
$211,630
1
$6,140
APPLICATIONS WITHDRAWN
0
$0
5
$154,768
17
$116,691
2
$140,745
1
$63,460
0
$0
FILES CLOSED FOR INCOMPLETENESS
0
$0
4
$181,432
24
$132,898
0
$0
1
$456,530
0
$0
Aggregated Statistics For Year 2003 (Based on 2 partial tracts)
A) FHA, FSA/RHS & VA Home Purchase Loans
B) Conventional Home Purchase Loans
C) Refinancings
D) Home Improvement Loans
E) Loans on Dwellings For 5+ Families
F) Non-occupant Loans on < 5 Family Dwellings (A B C & D)
Number
Average Value
Number
Average Value
Number
Average Value
Number
Average Value
Number
Average Value
Number
Average Value
LOANS ORIGINATED
7
$131,460
110
$123,297
462
$112,095
24
$26,486
0
$0
36
$196,673
APPLICATIONS APPROVED, NOT ACCEPTED
0
$0
9
$94,512
11
$101,708
2
$40,945
0
$0
0
$0
APPLICATIONS DENIED
0
$0
11
$119,482
66
$118,970
8
$12,411
1
$112,600
8
$146,759
APPLICATIONS WITHDRAWN
1
$110,550
10
$165,926
42
$112,377
0
$0
0
$0
1
$462,670
FILES CLOSED FOR INCOMPLETENESS
0
$0
2
$180,665
6
$133,068
0
$0
0
$0
0
$0
Aggregated Statistics For Year 2002 (Based on 2 partial tracts)
A) FHA, FSA/RHS & VA Home Purchase Loans
B) Conventional Home Purchase Loans
C) Refinancings
D) Home Improvement Loans
F) Non-occupant Loans on < 5 Family Dwellings (A B C & D)
Number
Average Value
Number
Average Value
Number
Average Value
Number
Average Value
Number
Average Value
LOANS ORIGINATED
7
$136,286
68
$117,548
359
$100,843
25
$25,590
18
$191,698
APPLICATIONS APPROVED, NOT ACCEPTED
0
$0
2
$94,685
15
$120,443
2
$10,750
1
$189,370
APPLICATIONS DENIED
0
$0
7
$71,944
41
$118,713
1
$10,240
3
$225,873
APPLICATIONS WITHDRAWN
0
$0
4
$81,888
26
$127,871
3
$37,873
1
$237,480
FILES CLOSED FOR INCOMPLETENESS
0
$0
1
$189,370
0
$0
0
$0
0
$0
Aggregated Statistics For Year 2001 (Based on 2 partial tracts)
A) FHA, FSA/RHS & VA Home Purchase Loans
B) Conventional Home Purchase Loans
C) Refinancings
D) Home Improvement Loans
E) Loans on Dwellings For 5+ Families
F) Non-occupant Loans on < 5 Family Dwellings (A B C & D)
Number
Average Value
Number
Average Value
Number
Average Value
Number
Average Value
Number
Average Value
Number
Average Value
LOANS ORIGINATED
8
$121,041
61
$120,483
259
$97,633
42
$25,273
2
$1,015,925
19
$142,765
APPLICATIONS APPROVED, NOT ACCEPTED
0
$0
2
$120,785
15
$117,919
3
$9,553
0
$0
2
$193,460
APPLICATIONS DENIED
0
$0
7
$112,596
40
$77,410
5
$15,558
0
$0
1
$110,550
APPLICATIONS WITHDRAWN
0
$0
7
$118,446
23
$97,376
1
$35,830
1
$1,453,510
0
$0
FILES CLOSED FOR INCOMPLETENESS
0
$0
0
$0
6
$102,530
0
$0
0
$0
0
$0
Aggregated Statistics For Year 2000 (Based on 2 partial tracts)
B) Conventional Home Purchase Loans
C) Refinancings
D) Home Improvement Loans
E) Loans on Dwellings For 5+ Families
F) Non-occupant Loans on < 5 Family Dwellings (A B C & D)
Number
Average Value
Number
Average Value
Number
Average Value
Number
Average Value
Number
Average Value
LOANS ORIGINATED
76
$115,532
76
$75,518
35
$13,892
1
$158,660
18
$157,464
APPLICATIONS APPROVED, NOT ACCEPTED
5
$85,164
12
$51,009
0
$0
0
$0
0
$0
APPLICATIONS DENIED
7
$87,737
27
$71,690
5
$14,944
0
$0
2
$362,355
APPLICATIONS WITHDRAWN
1
$123,860
8
$79,841
1
$20,470
0
$0
0
$0
FILES CLOSED FOR INCOMPLETENESS
1
$90,080
1
$56,300
0
$0
0
$0
0
$0
Aggregated Statistics For Year 1999 (Based on 1 partial tract)
A) FHA, FSA/RHS & VA Home Purchase Loans
B) Conventional Home Purchase Loans
C) Refinancings
D) Home Improvement Loans
F) Non-occupant Loans on < 5 Family Dwellings (A B C & D)
Detailed PMIC statistics for the following Tracts:0113.00
2002 - 2018 National Fire Incident Reporting System (NFIRS) incidents
Based on the data from the years 2002 - 2018 the average number of fire incidents per year is 9. The highest number of reported fire incidents - 42 took place in 2017, and the least - 0 in 2004. The data has a rising trend.
When looking into fire subcategories, the most incidents belonged to: Structure Fires (67.3%), and Mobile Property/Vehicle Fires (16.7%).
Fire incident types reported to NFIRS in Zip Code 53013

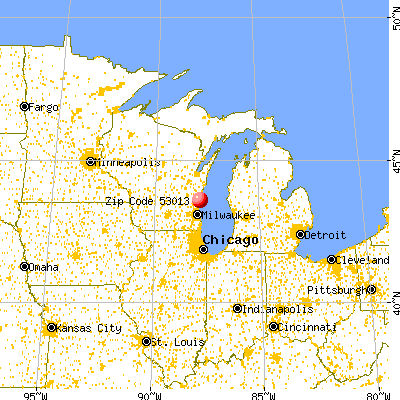


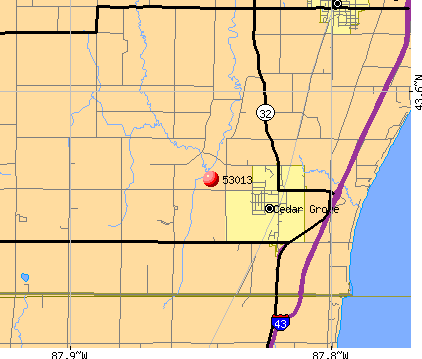 Nearest zip codes: 53070, 53004, 53031, 53093, 53075, 53074.


 Based on the data from the years 2002 - 2018 the average number of fire incidents per year is 9. The highest number of reported fire incidents - 42 took place in 2017, and the least - 0 in 2004. The data has a rising trend.
 When looking into fire subcategories, the most incidents belonged to: Structure Fires (67.3%), and Mobile Property/Vehicle Fires (16.7%).