Estimated zip code population in 2022: 2,393 Zip code population in 2010: 2,299 Zip code population in 2000: 2,249
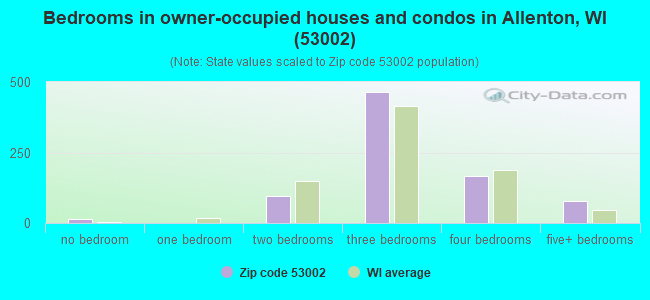
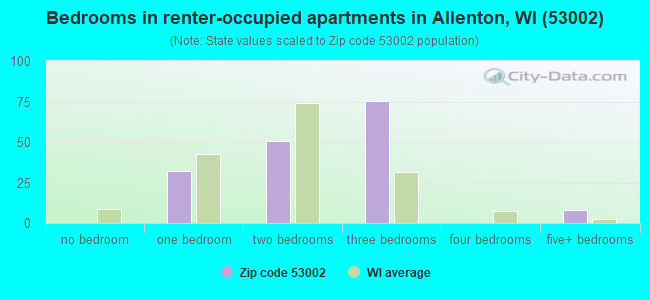
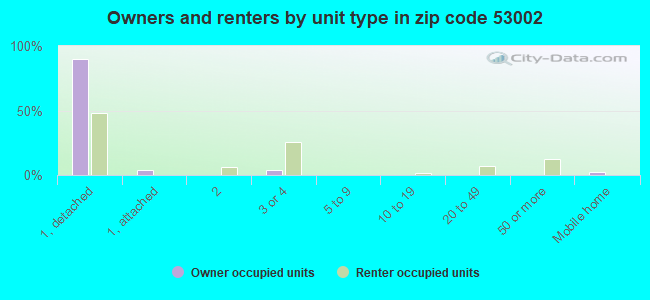
Houses and condos: 965 Renter-occupied apartments: 168
% of renters here:
17%
State:
32%
March 2022 cost of living index in zip code 53002: 89.2 (less than average, U.S. average is 100)
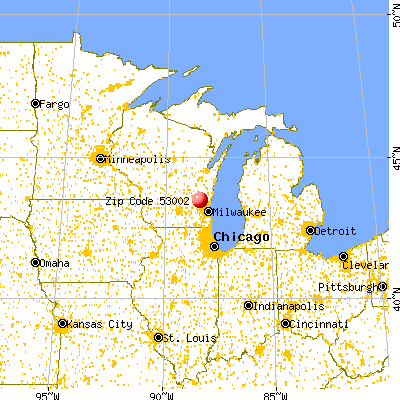
Land area: 31.8 sq. mi. Water area: 0.1 sq. mi.
Population density: 75 people per square mile
(very low).
OSM Map
General Map
Google Map
MSN Map
OSM Map
General Map
Google Map
MSN Map
OSM Map
General Map
Google Map
MSN Map
OSM Map
General Map
Google Map
MSN Map
Please wait while loading the map...
Real estate property taxes paid for housing units in 2022:
This zip code:
1.0% ($2,992)
Wisconsin:
1.4% ($3,497)
Median real estate property taxes paid for housing units with mortgages in 2022: $2,744 (0.9%) Median real estate property taxes paid for housing units with no mortgage in 2022: $3,334 (1.0%)
Business Search- 14 Million verified businesses
Males: 1,311
(54.8%)
Females: 1,082
(45.2%)
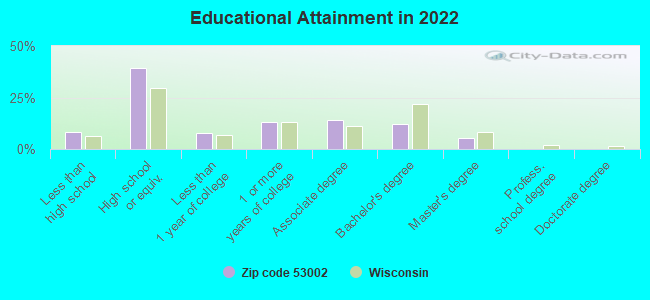
For population 25 years and over in 53002:
High school or higher: 90.2%
Bachelor's degree or higher: 17.3%
Graduate or professional degree: 5.2%
Unemployed: 3.9%
Mean travel time to work (commute): 24.2 minutes
For population 15 years and over in 53002:
Never married: 25.4%
Now married: 63.4%
Separated: 0.0%
Widowed: 5.9%
Divorced: 5.3%
Zip code 53002 compared to state average:
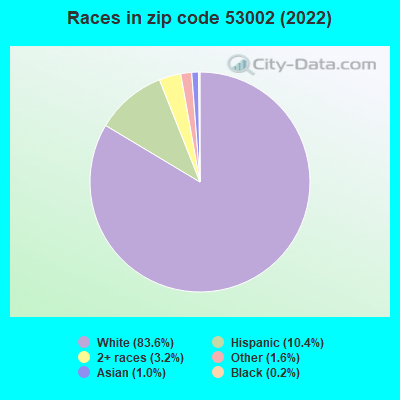
Black race population percentage significantly below state average.
Renting percentage below state average.
Number of college students below state average.
Percentage of population with a bachelor's degree or higher below state average.
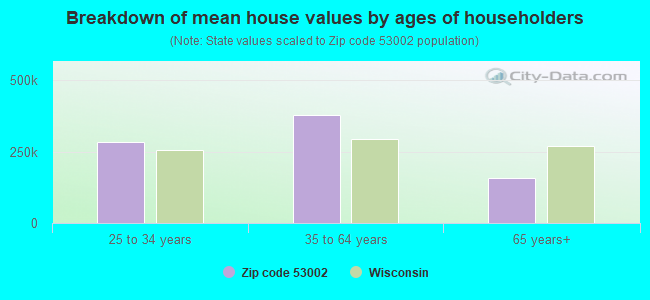
Estimated median house/condo value in 2022: $309,500
53002:
$309,500
Wisconsin:
$252,800
According to our research of Wisconsin and other state lists, there were 6 registered sex offenders living in 53002 zip code as of May 23, 2024. The ratio of all residents to sex offenders in zip code 53002 is 445 to 1. The ratio of registered sex offenders to all residents in this zip code is near the state average.
Median resident age:
This zip code:
43.0 years
Wisconsin median age:
40.4 years
Average household size:
This zip code:
2.4 people
Wisconsin:
2.3 people
Averages for the 2020 tax year for zip code 53002, filed in 2021:
Average Adjusted Gross Income (AGI) in 2020: $75,152 (Individual Income Tax Returns)
Here:
$75,152
State:
$72,319
Salary/wage: $61,653 (reported on 84.6% of returns)
Here:
$61,653
State:
$59,242
(% of AGI for various income ranges: 1222.2% for AGIs below $25k, 4076.1% for AGIs $25k-50k, 7080.0% for AGIs $50k-75k, 10230.0% for AGIs $75k-100k, 19609.3% for AGIs $100k-200k)
Taxable interest for individuals: $898 (reported on 41.5% of returns)
This zip code:
$898
Wisconsin:
$1,431
(% of AGI for various income ranges: 13.3% for AGIs below $25k, 59.4% for AGIs $25k-50k, 30.7% for AGIs $50k-75k, 126.0% for AGIs $75k-100k, 95.0% for AGIs $100k-200k)
Ordinary dividends: $3,655 (reported on 25.2% of returns)
Here:
$3,655
State:
$6,481
(% of AGI for various income ranges: 46.1% for AGIs below $25k, 75.0% for AGIs $25k-50k, 74.3% for AGIs $50k-75k, 140.0% for AGIs $75k-100k, 258.6% for AGIs $100k-200k)
Net capital gain/loss in AGI: +$7,997 (reported on 24.4% of returns)
Here:
+$7,997
State:
+$18,329
(% of AGI for various income ranges: 51.1% for AGIs below $25k, 97.2% for AGIs $25k-50k, 72.9% for AGIs $50k-75k, 272.0% for AGIs $75k-100k, 1255.7% for AGIs $100k-200k)
Profit/loss from business: +$15,347 (reported on 12.2% of returns)
Here:
+$15,347
State:
+$14,562
(% of AGI for various income ranges: 28.3% for AGIs below $25k, 123.3% for AGIs $25k-50k, 330.0% for AGIs $50k-75k, 369.0% for AGIs $75k-100k, 855.7% for AGIs $100k-200k)
Taxable individual retirement arrangement distribution: $17,227 (reported on 12.2% of returns)
53002:
$17,227
Wisconsin:
$19,348
(% of AGI for various income ranges: 161.1% for AGIs below $25k, 188.9% for AGIs $25k-50k, 221.4% for AGIs $50k-75k, 394.0% for AGIs $75k-100k, 892.9% for AGIs $100k-200k)
Total itemized deductions: $28,171 (reported on 5.7% of returns)
Here:
$28,171
State:
$33,000
(% of AGI for various income ranges: 285.0% for AGIs $25k-50k, 604.0% for AGIs $75k-100k, 610.7% for AGIs $100k-200k)
Charity contributions: $4,400 (reported on 3.3% of returns)
Here:
$4,400
State:
$12,044
(% of AGI for various income ranges: 11.7% for AGIs $25k-50k, 110.7% for AGIs $100k-200k)
Taxes paid: $7,575 (reported on 6.5% of returns)
53002:
$7,575
State:
$8,228
(% of AGI for various income ranges: 69.4% for AGIs $25k-50k, 161.0% for AGIs $75k-100k, 228.6% for AGIs $100k-200k)
Earned income credit: $1,762 (reported on 6.5% of returns)
Here:
$1,762
State:
$2,155
(% of AGI for various income ranges: 41.7% for AGIs below $25k, 36.7% for AGIs $25k-50k)
Percentage of individuals using paid preparers for their 2020 taxes: 95.1%
Here:
95%
State:
94%
(% for various income ranges: 93.3% for AGIs below $25k, 96.2% for AGIs $25k-50k, 95.2% for AGIs $50k-75k, 93.8% for AGIs $75k-100k, 96.2% for AGIs $100k-200k, 100.0% for AGIs over 200k)
Averages for the 2012 tax year for zip code 53002, filed in 2013:
Average Adjusted Gross Income (AGI) in 2012: $58,815 (Individual Income Tax Returns)
Here:
$58,815
State:
$57,939
Salary/wage: $52,010 (reported on 84.6% of returns)
Here:
$52,010
State:
$48,248
(% of AGI for various income ranges: 64.4% for AGIs below $25k, 77.3% for AGIs $25k-50k, 80.1% for AGIs $50k-75k, 83.7% for AGIs $75k-100k, 80.4% for AGIs $100k-200k, 47.4% for AGIs over 200k)
Taxable interest for individuals: $1,280 (reported on 47.0% of returns)
This zip code:
$1,280
Wisconsin:
$1,224
(% of AGI for various income ranges: 2.7% for AGIs below $25k, 1.1% for AGIs $25k-50k, 1.0% for AGIs $50k-75k, 0.5% for AGIs $75k-100k, 1.7% for AGIs $100k-200k)
Ordinary dividends: $2,270 (reported on 25.6% of returns)
Here:
$2,270
State:
$5,137
(% of AGI for various income ranges: 2.2% for AGIs below $25k, 1.6% for AGIs $25k-50k, 0.9% for AGIs $50k-75k, 0.7% for AGIs $75k-100k, 1.2% for AGIs $100k-200k)
Net capital gain/loss in AGI: +$2,304 (reported on 19.7% of returns)
Here:
+$2,304
State:
+$11,137
(% of AGI for various income ranges: 1.0% for AGIs below $25k, 1.2% for AGIs $25k-50k, 1.2% for AGIs $50k-75k, 0.9% for AGIs $75k-100k, 0.4% for AGIs $100k-200k)
Profit/loss from business: +$12,524 (reported on 14.5% of returns)
Here:
+$12,524
State:
+$11,943
(% of AGI for various income ranges: 6.6% for AGIs below $25k, 3.8% for AGIs $25k-50k, 4.6% for AGIs $50k-75k, 3.1% for AGIs $75k-100k, 2.4% for AGIs $100k-200k)
Taxable individual retirement arrangement distribution: $10,379 (reported on 12.0% of returns)
53002:
$10,379
Wisconsin:
$14,087
(% of AGI for various income ranges: 5.8% for AGIs below $25k, 2.4% for AGIs $25k-50k, 1.5% for AGIs $50k-75k, 2.0% for AGIs $75k-100k, 2.9% for AGIs $100k-200k)
Total itemized deductions: $18,558 (21% of AGI, reported on 42.7% of returns)
Here:
$18,558
State:
$22,257
Here:
20.6% of AGI
State:
20.1% of AGI
(% of AGI for various income ranges: 12.0% for AGIs below $25k, 13.5% for AGIs $25k-50k, 11.9% for AGIs $50k-75k, 14.3% for AGIs $75k-100k, 15.3% for AGIs $100k-200k, 11.8% for AGIs over 200k)
Charity contributions: $1,838 (reported on 31.6% of returns)
Here:
$1,838
State:
$3,370
(% of AGI for various income ranges: 0.7% for AGIs below $25k, 0.9% for AGIs $25k-50k, 1.0% for AGIs $50k-75k, 1.1% for AGIs $75k-100k, 1.2% for AGIs $100k-200k, 0.7% for AGIs over 200k)
Taxes paid: $8,888 (reported on 41.9% of returns)
53002:
$8,888
State:
$10,731
(% of AGI for various income ranges: 2.6% for AGIs below $25k, 4.2% for AGIs $25k-50k, 5.1% for AGIs $50k-75k, 6.4% for AGIs $75k-100k, 7.9% for AGIs $100k-200k, 9.0% for AGIs over 200k)
Earned income credit: $1,745 (reported on 9.4% of returns)
Here:
$1,745
State:
$2,094
(% of AGI for various income ranges: 3.1% for AGIs below $25k, 0.6% for AGIs $25k-50k)
Percentage of individuals using paid preparers for their 2012 taxes: 62.4%
Here:
62%
State:
54%
(% for various income ranges: 55.6% for AGIs below $25k, 64.3% for AGIs $25k-50k, 61.9% for AGIs $50k-75k, 70.6% for AGIs $75k-100k, 76.9% for AGIs $100k-200k)
Averages for the 2004 tax year for zip code 53002, filed in 2005:
Average Adjusted Gross Income (AGI) in 2004: $53,449 (Individual Income Tax Returns)
Here:
$53,449
State:
$47,735
Salary/wage: $43,374 (reported on 88.1% of returns)
Here:
$43,374
State:
$41,540
(% of AGI for various income ranges: 94.8% for AGIs below $10k, 75.6% for AGIs $10k-25k, 81.9% for AGIs $25k-50k, 84.9% for AGIs $50k-75k, 84.5% for AGIs $75k-100k, 46.1% for AGIs over 100k)
Taxable interest for individuals: $1,512 (reported on 60.1% of returns)
This zip code:
$1,512
Wisconsin:
$1,420
(% of AGI for various income ranges: 9.9% for AGIs below $10k, 5.4% for AGIs $10k-25k, 1.6% for AGIs $25k-50k, 1.1% for AGIs $50k-75k, 0.7% for AGIs $75k-100k, 1.8% for AGIs over 100k)
Taxable dividends: $2,735 (reported on 30.3% of returns)
Here:
$2,735
State:
$2,869
(% of AGI for various income ranges: 2.5% for AGIs below $10k, 1.3% for AGIs $10k-25k, 1.4% for AGIs $25k-50k, 0.6% for AGIs $50k-75k, 0.9% for AGIs $75k-100k, 2.8% for AGIs over 100k)
Net capital gain/loss: +$9,899 (reported on 25.2% of returns)
Here:
+$9,899
State:
+$9,569
(% of AGI for various income ranges: 1.4% for AGIs below $10k, 1.1% for AGIs $10k-25k, 0.6% for AGIs $25k-50k, 2.2% for AGIs $50k-75k, 1.6% for AGIs $75k-100k, 11.5% for AGIs over 100k)
Profit/loss from business: +$11,993 (reported on 12.6% of returns)
Here:
+$11,993
State:
+$10,417
(% of AGI for various income ranges: -0.1% for AGIs below $10k, 1.3% for AGIs $10k-25k, 2.6% for AGIs $25k-50k, 3.6% for AGIs $50k-75k, 2.8% for AGIs $75k-100k, 2.8% for AGIs over 100k)
IRA payment deduction: $2,889 (reported on 4.0% of returns)
53002:
$2,889
Wisconsin:
$2,900
Self-employed pension: $7,500 (reported on 0.9% of returns)
Here:
$7,500
Wisconsin:
$11,934
Total itemized deductions: $16,600 (19% of AGI, reported on 44.4% of returns)
Here:
$16,600
State:
$18,160
Here:
19.4% of AGI
State:
21.1% of AGI
(% of AGI for various income ranges: 13.7% for AGIs $10k-25k, 13.6% for AGIs $25k-50k, 17.0% for AGIs $50k-75k, 16.1% for AGIs $75k-100k, 10.7% for AGIs over 100k)
Charity contributions deductions: $1,494 (2% of AGI, reported on 37.1% of returns)
Here:
$1,494
State:
$2,711
Here:
1.6% of AGI
State:
3.0% of AGI
(% of AGI for various income ranges: 0.5% for AGIs $10k-25k, 0.9% for AGIs $25k-50k, 1.2% for AGIs $50k-75k, 1.3% for AGIs $75k-100k, 1.0% for AGIs over 100k)
Total tax: $5,991 (reported on 85.1% of returns)
53002:
$5,991
State:
$7,114
(% of AGI for various income ranges: 2.8% for AGIs below $10k, 5.1% for AGIs $10k-25k, 7.5% for AGIs $25k-50k, 8.2% for AGIs $50k-75k, 10.2% for AGIs $75k-100k, 12.4% for AGIs over 100k)
Earned income credit: $1,092 (reported on 5.7% of returns)
Here:
$1,092
State:
$1,544
Percentage of individuals using paid preparers for their 2004 taxes: 59.5%
Here:
60%
State:
57%
(% for various income ranges: 44.0% for AGIs below $10k, 54.9% for AGIs $10k-25k, 63.6% for AGIs $25k-50k, 63.3% for AGIs $50k-75k, 65.2% for AGIs $75k-100k, 67.9% for AGIs over 100k)
Household received Food Stamps/SNAP in the past 12 months: 72 Household did not receive Food Stamps/SNAP in the past 12 months: 901
Women who had a birth in the past 12 months: 39 (39 now married, 0 unmarried) Women who did not have a birth in the past 12 months: 438 (265 now married, 173 unmarried)
Housing units in zip code 53002 with a mortgage: 540 (122 second mortgage, 123 both second mortgage and home equity loan) Houses without a mortgage: 10
Median monthly owner costs for units with a mortgage: $1,568 Median monthly owner costs for units without a mortgage: $623
Residents with income below the poverty level in 2022:
This zip code:
3.6%
Whole state:
10.7%
Residents with income below 50% of the poverty level in 2022:
This zip code:
1.9%
Whole state:
5.7%
Median number of rooms in houses and condos:
Here:
6.7
State:
6.5
Median number of rooms in apartments:
Here:
4.5
State:
4.1
Notable locations in this zip code not listed on our city pages
Notable locations in zip code 53002: Rosenkranz Farms (A), Sunset Farms (B), Brittany Farms (C), Dominion Valley Farm (D), Spring Valley Dairy Farm (E), T and T Farms (F), Twisted Pine Farm (G), Whispering View Farm (H), Allenton Volunteer Fire Department (I). Display/hide their locations on the map
Size of family households: 334 2-persons, 165 3-persons, 198 4-persons, 31 5-persons, 7 6-persons
Size of nonfamily households: 163 1-person, 75 2-persons
461 married couples with children.
61 single-parent households (37 men, 24 women).
88.1% of residents of 53002 zip code speak English at home.
9.4% of residents speak Spanish at home (49% very well, 51% well).
0.3% of residents speak other Indo-European language at home (38% very well, 62% not at all).
1.1% of residents speak Asian or Pacific Island language at home (64% very well, 36% well).
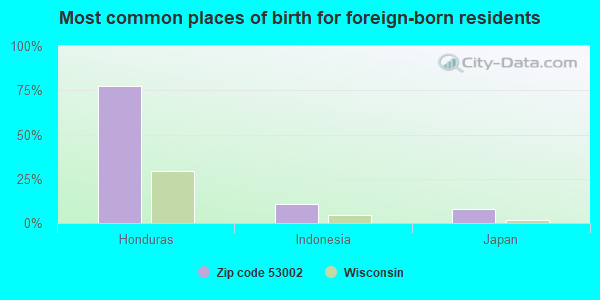
Foreign born population: 124 (5.2%) (20.0% of them are naturalized citizens)
This zip code:
5.2%
Whole state:
5.0%
77%Honduras
10%Indonesia
8%Japan
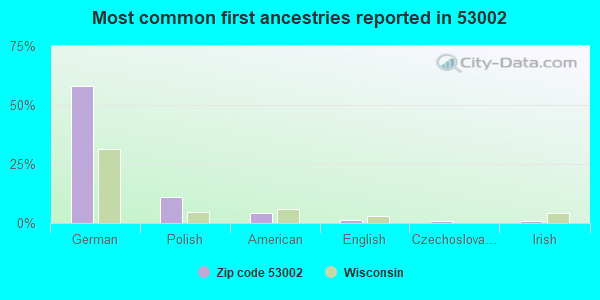
58%German
11%Polish
4%American
1%English
1%Czechoslovakian
1%Irish
0%Slovak
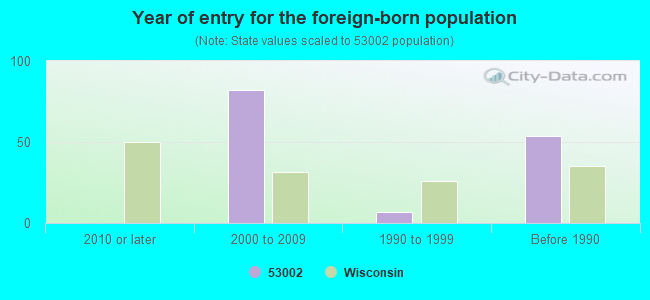
Year of entry for the foreign-born population
02010 or later
822000 to 2009
71990 to 1999
54Before 1990
Facilities with environmental interests located in this zip code:
ALLCAST INCORPORATED (217 WEIS ST in ALLENTON, WI)
AIR MINOR (AIRS/AFS) - ICIS-, ENFORCEMENT/COMPLIANCE ACTIVITY COMPLIANCE ACTIVITY (Tracking inspections of insecticide, fungicide, and rodenticide, and toxic substances) CRITERIA AND HAZARDOUS AIR POLLUTANT INVENTORY (Inventory of air pollution sources) STATE MASTER (Wisconsin database) - NEI-WI267008500, AIR PROGRAM Business SIC classification: GRAY AND DUCTILE IRON FOUNDRIES; ALUMINUM DIE-CASTINGS Business NAICS classification: ALUMINUM DIE-CASTING FOUNDRIES. Organizations: ALLCAST, INCORPORATED
ALLENTON SANITARY DISTRICT (750 HWY 33 in ALLENTON, WI)
National Pollutant Discharge Elimination System NON-MAJOR (Tracking pollutant discharge elimination systems) - permit National Pollutant Discharge Elimination System NON-MAJOR (Tracking pollutant discharge elimination systems) - permit STATE MASTER (Wisconsin database) - PCS-WI0028053, WASTEWATER FACILITY, SDWIS-WI2670104, DRINKING WATER SYSTEM Business SIC classification: SEWERAGE SYSTEMS Alternative names: ALLENTON SAN DIST 1, ALLENTON SAN DIST 1 WWTF
COACHWORK AUTO BODY (5709 HWY 33 in ALLENTON, WI)
Small Quantity Generators, between 100 kg and 1000 kg of hazardous waste/month (Resource Conservation and Recovery Act (tracking hazardous waste)) - notification STATE MASTER (Wisconsin database) - RCRAINFO-WID147740351, CESQG Business SIC classification: TOP, BODY, AND UPHOLSTERY REPAIR SHOPS AND PAINT SHOPS Organizations: MCINTEE PATRICK (CONTACT/OWNER)
ALLENTON AUTO BODY (716 HWY in ALLENTON, WI)
Conditionally Exempt Small Quantity Generators, less than 100 kg/month of hazardous waste (Resource Conservation and Recovery Act (tracking hazardous waste)) - notification STATE MASTER (Wisconsin database) - RCRAINFO-WID988614749, CESQG Organizations: STRUPP DOUGLAS (CONTACT/OWNER)
ALLENTON SERVICE (5908 HILLCREST in ALLENTON, WI)
Conditionally Exempt Small Quantity Generators, less than 100 kg/month of hazardous waste (Resource Conservation and Recovery Act (tracking hazardous waste)) - notification STATE MASTER (Wisconsin database) - RCRAINFO-WIR000034546, CESQG Organizations: GARY R HEFTER (CONTACT/OWNER)
ALLENTON ELEMENTARY SCHOOL (228 WEIS STREET in ALLENTON, WI)
(Geographic Names Information System) (National Center for Education Statistics) - STATE ID-0010 Organizations: SLINGER SCH DIST (SCHOOL DISTRICT)
Housing units lacking complete plumbing facilities: 0.9% Housing units lacking complete kitchen facilities: 0.9%
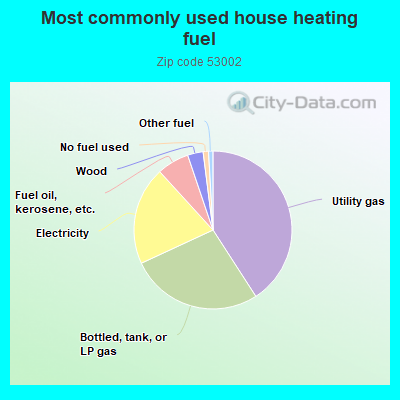
41.0%Utility gas
27.3%Bottled, tank, or LP gas
20.2%Electricity
6.6%Fuel oil, kerosene, etc.
3.2%Wood
1.1%No fuel used
0.9%Other fuel
Population in 1990: 1,449. Population change in the 1990s: +800 (+55.2%).
Place of birth for U.S.-born residents:
This state: 2,075
Northeast: 7
Midwest: 93
South: 4
West: 47
60% of the 53002 zip code residents lived in the same house 5 years ago. Out of people who lived in different houses, 60% lived in this county. Out of people who lived in different counties, 50% lived in Wisconsin.
94% of the 53002 zip code residents lived in the same house 1 year ago. Out of people who lived in different houses, 88% moved from this county. Out of people who lived in different houses, 7% moved from different state.
Private vs. public school enrollment:
Students in private schools in grades 1 to 8 (elementary and middle school): 20
Here:
8.3%
Wisconsin:
16.7%
Students in private schools in grades 9 to 12 (high school):
Here:
0.0%
Wisconsin:
12.5%
Students in private undergraduate colleges: 6
Here:
12.4%
Wisconsin:
17.5%
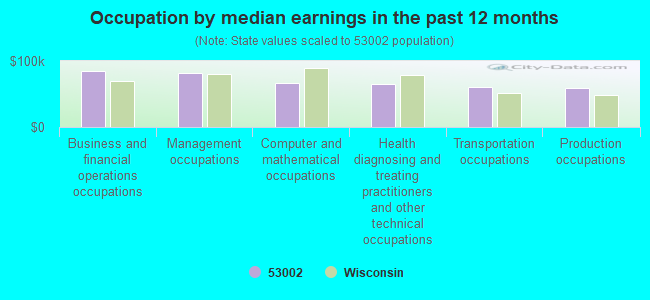
Occupation by median earnings in the past 12 months ($)
85,228Business and financial operations occupations
81,911Management occupations
66,738Computer and mathematical occupations
65,329Health diagnosing and treating practitioners and other technical occupations
60,252Transportation occupations
59,386Production occupations
Top industries in this zip code by the number of employees in 2005:
Construction: Commercial and Institutional Building Construction (100-249 employees: 1 establishment)
Wholesale Trade: Farm and Garden Machinery and Equipment Merchant Wholesalers (20-49: 1, 10-19: 1)
Accommodation and Food Services: Full-Service Restaurants (20-49: 1, 10-19: 1)
Other Services (except Public Administration): General Automotive Repair (10-19: 1, 5-9: 1, 1-4: 1)
People in group quarters in 2000:
6 people in nursing homes
3 people in religious group quarters
Fatal accident statistics in 2014:
Fatal accident count: 2
Vehicles involved in fatal accidents: 6
Fatal accidents caused by drunken drivers: 0
Fatalities: 2
Persons involved in fatal accidents: 8
Pedestrians involved in fatal accidents: 0
Fatal accident statistics in 2013:
Fatal accident count: 1
Vehicles involved in fatal accidents: 1
Fatal accidents caused by drunken drivers: 1
Fatalities: 1
Persons involved in fatal accidents: 1
Pedestrians involved in fatal accidents: 0
Home Mortgage Disclosure Act Aggregated Statistics For Year 2009 (Based on 4 partial tracts)
A) FHA, FSA/RHS & VA Home Purchase Loans
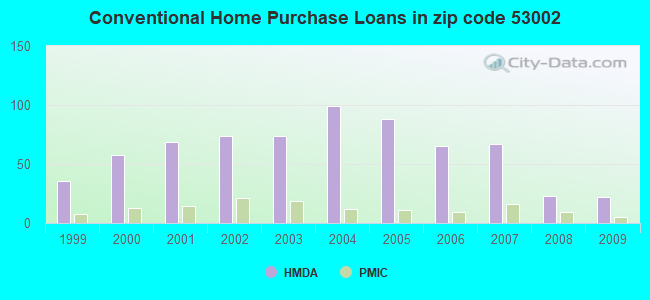
B) Conventional Home Purchase Loans
C) Refinancings
D) Home Improvement Loans
F) Non-occupant Loans on < 5 Family Dwellings (A B C & D)
G) Loans On Manufactured Home Dwelling (A B C & D)
Number
Average Value
Number
Average Value
Number
Average Value
Number
Average Value
Number
Average Value
Number
Average Value
LOANS ORIGINATED
12
$183,379
22
$185,048
277
$188,969
15
$104,511
4
$144,155
0
$0
APPLICATIONS APPROVED, NOT ACCEPTED
1
$124,700
3
$215,647
16
$222,328
2
$9,375
0
$0
0
$0
APPLICATIONS DENIED
1
$170,640
2
$192,675
50
$210,566
1
$140,640
0
$0
1
$24,380
APPLICATIONS WITHDRAWN
0
$0
2
$105,480
23
$207,332
2
$14,535
0
$0
0
$0
FILES CLOSED FOR INCOMPLETENESS
0
$0
0
$0
4
$157,985
0
$0
0
$0
0
$0
Aggregated Statistics For Year 2008 (Based on 4 partial tracts)
A) FHA, FSA/RHS & VA Home Purchase Loans
B) Conventional Home Purchase Loans
C) Refinancings
D) Home Improvement Loans
E) Loans on Dwellings For 5+ Families
F) Non-occupant Loans on < 5 Family Dwellings (A B C & D)
Number
Average Value
Number
Average Value
Number
Average Value
Number
Average Value
Number
Average Value
Number
Average Value
LOANS ORIGINATED
4
$170,642
23
$218,909
142
$214,519
21
$77,731
2
$248,465
3
$145,953
APPLICATIONS APPROVED, NOT ACCEPTED
0
$0
2
$166,425
20
$186,020
5
$91,322
0
$0
1
$105,010
APPLICATIONS DENIED
1
$105,950
3
$134,077
37
$204,726
11
$43,130
0
$0
2
$198,300
APPLICATIONS WITHDRAWN
1
$295,340
4
$187,050
30
$187,895
1
$9,380
0
$0
0
$0
FILES CLOSED FOR INCOMPLETENESS
0
$0
0
$0
3
$254,090
0
$0
0
$0
0
$0
Aggregated Statistics For Year 2007 (Based on 4 partial tracts)
A) FHA, FSA/RHS & VA Home Purchase Loans
B) Conventional Home Purchase Loans
C) Refinancings
D) Home Improvement Loans
E) Loans on Dwellings For 5+ Families
F) Non-occupant Loans on < 5 Family Dwellings (A B C & D)
G) Loans On Manufactured Home Dwelling (A B C & D)
Number
Average Value
Number
Average Value
Number
Average Value
Number
Average Value
Number
Average Value
Number
Average Value
Number
Average Value
LOANS ORIGINATED
3
$161,267
67
$187,058
130
$169,157
25
$71,745
1
$195,020
4
$161,268
0
$0
APPLICATIONS APPROVED, NOT ACCEPTED
0
$0
7
$182,966
28
$156,244
8
$72,312
0
$0
0
$0
0
$0
APPLICATIONS DENIED
3
$149,080
15
$174,143
47
$176,009
8
$73,485
0
$0
2
$88,135
1
$78,760
APPLICATIONS WITHDRAWN
0
$0
4
$123,998
33
$163,625
2
$42,190
0
$0
1
$60,010
0
$0
FILES CLOSED FOR INCOMPLETENESS
0
$0
2
$268,155
8
$187,638
0
$0
0
$0
0
$0
0
$0
Aggregated Statistics For Year 2006 (Based on 4 partial tracts)
A) FHA, FSA/RHS & VA Home Purchase Loans
B) Conventional Home Purchase Loans
C) Refinancings
D) Home Improvement Loans
E) Loans on Dwellings For 5+ Families
F) Non-occupant Loans on < 5 Family Dwellings (A B C & D)
G) Loans On Manufactured Home Dwelling (A B C & D)
Number
Average Value
Number
Average Value
Number
Average Value
Number
Average Value
Number
Average Value
Number
Average Value
Number
Average Value
LOANS ORIGINATED
4
$147,438
65
$165,003
134
$156,628
17
$43,240
1
$1,453,280
2
$251,745
0
$0
APPLICATIONS APPROVED, NOT ACCEPTED
0
$0
8
$171,112
18
$160,278
3
$30,003
0
$0
0
$0
0
$0
APPLICATIONS DENIED
1
$175,330
6
$144,703
38
$170,767
5
$54,194
0
$0
1
$32,820
0
$0
APPLICATIONS WITHDRAWN
0
$0
1
$342,220
31
$190,061
2
$82,040
0
$0
3
$215,337
1
$180,020
FILES CLOSED FOR INCOMPLETENESS
0
$0
1
$145,330
9
$196,271
1
$120,010
0
$0
0
$0
0
$0
Aggregated Statistics For Year 2005 (Based on 4 partial tracts)
A) FHA, FSA/RHS & VA Home Purchase Loans
B) Conventional Home Purchase Loans
C) Refinancings
D) Home Improvement Loans
E) Loans on Dwellings For 5+ Families
F) Non-occupant Loans on < 5 Family Dwellings (A B C & D)
G) Loans On Manufactured Home Dwelling (A B C & D)
Number
Average Value
Number
Average Value
Number
Average Value
Number
Average Value
Number
Average Value
Number
Average Value
Number
Average Value
LOANS ORIGINATED
1
$140,640
88
$213,783
176
$174,681
28
$72,564
3
$369,727
6
$779,145
1
$130,330
APPLICATIONS APPROVED, NOT ACCEPTED
0
$0
6
$138,452
14
$157,383
1
$93,760
0
$0
0
$0
0
$0
APPLICATIONS DENIED
0
$0
9
$155,746
45
$192,625
4
$64,460
0
$0
1
$345,040
0
$0
APPLICATIONS WITHDRAWN
0
$0
5
$185,270
27
$146,926
3
$192,207
0
$0
1
$101,260
0
$0
FILES CLOSED FOR INCOMPLETENESS
0
$0
2
$81,570
25
$178,219
1
$22,500
0
$0
1
$154,700
0
$0
Aggregated Statistics For Year 2004 (Based on 4 partial tracts)
A) FHA, FSA/RHS & VA Home Purchase Loans
B) Conventional Home Purchase Loans
C) Refinancings
D) Home Improvement Loans
F) Non-occupant Loans on < 5 Family Dwellings (A B C & D)
G) Loans On Manufactured Home Dwelling (A B C & D)
Number
Average Value
Number
Average Value
Number
Average Value
Number
Average Value
Number
Average Value
Number
Average Value
LOANS ORIGINATED
1
$147,200
99
$173,806
156
$165,534
23
$46,513
11
$115,410
1
$158,450
APPLICATIONS APPROVED, NOT ACCEPTED
1
$78,760
8
$108,175
13
$148,285
2
$20,160
2
$82,510
0
$0
APPLICATIONS DENIED
1
$110,640
8
$133,491
29
$141,804
5
$26,628
1
$187,520
0
$0
APPLICATIONS WITHDRAWN
0
$0
7
$124,299
27
$154,044
0
$0
0
$0
0
$0
FILES CLOSED FOR INCOMPLETENESS
0
$0
1
$271,900
15
$145,203
2
$42,190
0
$0
0
$0
Aggregated Statistics For Year 2003 (Based on 4 partial tracts)
A) FHA, FSA/RHS & VA Home Purchase Loans
B) Conventional Home Purchase Loans
C) Refinancings
D) Home Improvement Loans
E) Loans on Dwellings For 5+ Families
F) Non-occupant Loans on < 5 Family Dwellings (A B C & D)
Number
Average Value
Number
Average Value
Number
Average Value
Number
Average Value
Number
Average Value
Number
Average Value
LOANS ORIGINATED
1
$162,200
74
$169,655
425
$144,011
12
$26,956
3
$348,473
1
$65,630
APPLICATIONS APPROVED, NOT ACCEPTED
1
$148,140
2
$162,205
18
$156,371
2
$58,600
0
$0
0
$0
APPLICATIONS DENIED
0
$0
5
$236,088
57
$136,018
7
$21,431
0
$0
1
$65,630
APPLICATIONS WITHDRAWN
0
$0
3
$135,327
27
$144,529
2
$22,035
0
$0
0
$0
FILES CLOSED FOR INCOMPLETENESS
0
$0
1
$140,640
7
$95,367
0
$0
0
$0
0
$0
Aggregated Statistics For Year 2002 (Based on 4 partial tracts)
A) FHA, FSA/RHS & VA Home Purchase Loans
B) Conventional Home Purchase Loans
C) Refinancings
D) Home Improvement Loans
F) Non-occupant Loans on < 5 Family Dwellings (A B C & D)
Number
Average Value
Number
Average Value
Number
Average Value
Number
Average Value
Number
Average Value
LOANS ORIGINATED
1
$170,640
74
$157,631
353
$134,895
8
$29,182
6
$110,637
APPLICATIONS APPROVED, NOT ACCEPTED
1
$129,390
2
$120,950
27
$133,730
3
$29,690
0
$0
APPLICATIONS DENIED
0
$0
3
$55,007
38
$133,287
4
$32,815
0
$0
APPLICATIONS WITHDRAWN
0
$0
5
$122,826
15
$111,699
1
$37,500
0
$0
FILES CLOSED FOR INCOMPLETENESS
1
$120,010
1
$108,760
8
$166,306
0
$0
0
$0
Aggregated Statistics For Year 2001 (Based on 4 partial tracts)
A) FHA, FSA/RHS & VA Home Purchase Loans
B) Conventional Home Purchase Loans
C) Refinancings
D) Home Improvement Loans
E) Loans on Dwellings For 5+ Families
F) Non-occupant Loans on < 5 Family Dwellings (A B C & D)
Number
Average Value
Number
Average Value
Number
Average Value
Number
Average Value
Number
Average Value
Number
Average Value
LOANS ORIGINATED
5
$135,952
69
$144,825
232
$122,130
15
$18,377
2
$932,445
1
$28,130
APPLICATIONS APPROVED, NOT ACCEPTED
0
$0
3
$102,510
14
$108,963
4
$18,050
0
$0
0
$0
APPLICATIONS DENIED
0
$0
5
$66,758
25
$88,884
4
$18,282
0
$0
3
$90,633
APPLICATIONS WITHDRAWN
0
$0
4
$173,455
18
$127,982
1
$940
0
$0
1
$78,760
FILES CLOSED FOR INCOMPLETENESS
0
$0
0
$0
2
$198,770
0
$0
0
$0
0
$0
Aggregated Statistics For Year 2000 (Based on 4 partial tracts)
A) FHA, FSA/RHS & VA Home Purchase Loans
B) Conventional Home Purchase Loans
C) Refinancings
D) Home Improvement Loans
E) Loans on Dwellings For 5+ Families
F) Non-occupant Loans on < 5 Family Dwellings (A B C & D)
Number
Average Value
Number
Average Value
Number
Average Value
Number
Average Value
Number
Average Value
Number
Average Value
LOANS ORIGINATED
3
$136,263
58
$136,922
63
$92,897
8
$9,494
1
$606,630
3
$206,897
APPLICATIONS APPROVED, NOT ACCEPTED
0
$0
2
$100,325
6
$103,917
4
$11,018
0
$0
1
$70,320
APPLICATIONS DENIED
0
$0
5
$112,888
31
$98,720
8
$16,525
0
$0
1
$70,320
APPLICATIONS WITHDRAWN
0
$0
5
$129,952
11
$87,794
2
$16,875
0
$0
0
$0
FILES CLOSED FOR INCOMPLETENESS
0
$0
1
$110,640
6
$119,543
1
$28,130
0
$0
0
$0
Aggregated Statistics For Year 1999 (Based on 2 partial tracts)
A) FHA, FSA/RHS & VA Home Purchase Loans
B) Conventional Home Purchase Loans
C) Refinancings
D) Home Improvement Loans
F) Non-occupant Loans on < 5 Family Dwellings (A B C & D)
Detailed PMIC statistics for the following Tracts:4301.00
2004 - 2018 National Fire Incident Reporting System (NFIRS) incidents
According to the data from the years 2004 - 2018 the average number of fires per year is 10. The highest number of reported fires - 23 took place in 2017, and the least - 0 in 2007. The data has a growing trend.
When looking into fire subcategories, the most incidents belonged to: Structure Fires (47.0%), and Outside Fires (26.2%).
Fire incident types reported to NFIRS in Zip Code 53002


 Nearest zip codes: 53091, 53027, 53048, 53090, 53086, 53010.


 According to the data from the years 2004 - 2018 the average number of fires per year is 10. The highest number of reported fires - 23 took place in 2017, and the least - 0 in 2007. The data has a growing trend.
 When looking into fire subcategories, the most incidents belonged to: Structure Fires (47.0%), and Outside Fires (26.2%).