Estimated zip code population in 2022: 762 Zip code population in 2010: 887 Zip code population in 2000: 951
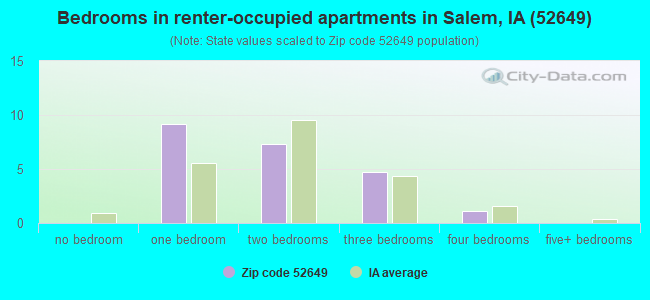
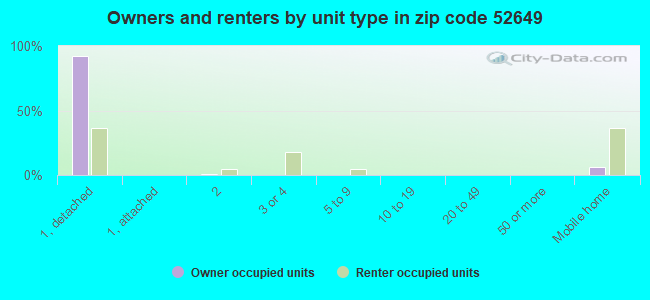
Houses and condos: 303 Renter-occupied apartments: 22
% of renters here:
7%
State:
28%
March 2022 cost of living index in zip code 52649: 83.2 (low, U.S. average is 100)
Land area: 46.1 sq. mi. Water area: 0.0 sq. mi.
Population density: 17 people per square mile
(very low).
OSM Map
General Map
Google Map
MSN Map
OSM Map
General Map
Google Map
MSN Map
OSM Map
General Map
Google Map
MSN Map
OSM Map
General Map
Google Map
MSN Map
Please wait while loading the map...
Real estate property taxes paid for housing units in 2022:
This zip code:
1.4% ($2,883)
Iowa:
1.4% ($2,724)
Median real estate property taxes paid for housing units with mortgages in 2022: $2,864 (1.4%) Median real estate property taxes paid for housing units with no mortgage in 2022: $2,929 (1.1%)
Business Search- 14 Million verified businesses
Males: 397
(52.1%)
Females: 365
(47.9%)
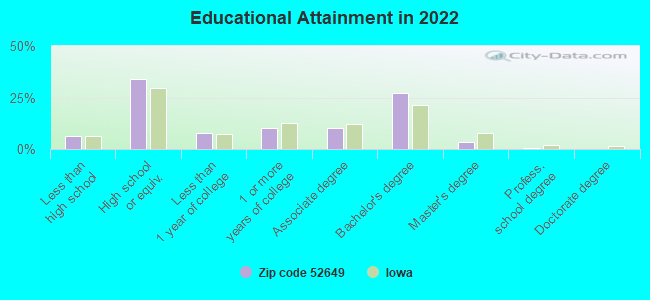
For population 25 years and over in 52649:
High school or higher: 93.6%
Bachelor's degree or higher: 31.1%
Graduate or professional degree: 3.9%
Unemployed: 0.8%
Mean travel time to work (commute): 20.8 minutes
For population 15 years and over in 52649:
Never married: 16.2%
Now married: 64.0%
Separated: 1.1%
Widowed: 5.6%
Divorced: 13.1%
Zip code 52649 compared to state average:
Unemployed percentage significantly below state average.
Black race population percentage significantly below state average.
Hispanic race population percentage significantly below state average.
Foreign-born population percentage significantly below state average.
Renting percentage significantly below state average.
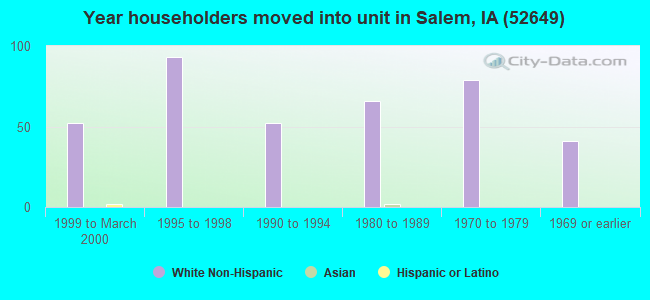
Length of stay since moving in significantly above state average.
Number of rooms per house above state average.
Number of college students significantly below state average.
Averages for the 2020 tax year for zip code 52649, filed in 2021:
Average Adjusted Gross Income (AGI) in 2020: $59,633 (Individual Income Tax Returns)
Here:
$59,633
State:
$71,087
Salary/wage: $48,847 (reported on 74.4% of returns)
Here:
$48,847
State:
$57,361
(% of AGI for various income ranges: 1322.5% for AGIs below $25k, 3638.9% for AGIs $25k-50k, 5515.0% for AGIs $50k-75k, 7817.5% for AGIs $75k-100k, 16206.7% for AGIs $100k-200k)
Taxable interest for individuals: $971 (reported on 39.5% of returns)
This zip code:
$971
Iowa:
$1,633
(% of AGI for various income ranges: 36.2% for AGIs below $25k, 33.3% for AGIs $25k-50k, 83.3% for AGIs $50k-75k, 7.5% for AGIs $75k-100k, 176.7% for AGIs $100k-200k)
Ordinary dividends: $1,225 (reported on 18.6% of returns)
Here:
$1,225
State:
$5,432
(% of AGI for various income ranges: 23.8% for AGIs below $25k, 75.0% for AGIs $50k-75k, 113.3% for AGIs $100k-200k)
Net capital gain/loss in AGI: +$17,757 (reported on 16.3% of returns)
Here:
+$17,757
State:
+$15,243
(% of AGI for various income ranges: 93.3% for AGIs $25k-50k, 3863.3% for AGIs $100k-200k)
Profit/loss from business: +$6,171 (reported on 16.3% of returns)
Here:
+$6,171
State:
+$11,763
(% of AGI for various income ranges: 288.9% for AGIs $25k-50k, 430.0% for AGIs $75k-100k)
Taxable individual retirement arrangement distribution: $13,283 (reported on 14.0% of returns)
52649:
$13,283
Iowa:
$17,324
(% of AGI for various income ranges: 342.5% for AGIs below $25k, 871.7% for AGIs $50k-75k)
Earned income credit: $2,300 (reported on 11.6% of returns)
Here:
$2,300
State:
$2,195
(% of AGI for various income ranges: 76.2% for AGIs below $25k, 60.0% for AGIs $25k-50k)
Percentage of individuals using paid preparers for their 2020 taxes: 95.3%
Here:
95%
State:
95%
(% for various income ranges: 91.7% for AGIs below $25k, 92.3% for AGIs $25k-50k, 100.0% for AGIs $50k-75k, 100.0% for AGIs $75k-100k, 100.0% for AGIs $100k-200k)
Averages for the 2012 tax year for zip code 52649, filed in 2013:
Average Adjusted Gross Income (AGI) in 2012: $46,200 (Individual Income Tax Returns)
Here:
$46,200
State:
$58,860
Salary/wage: $34,582 (reported on 84.4% of returns)
Here:
$34,582
State:
$46,659
(% of AGI for various income ranges: 77.2% for AGIs below $25k, 81.4% for AGIs $25k-50k, 71.3% for AGIs $50k-75k, 68.5% for AGIs $75k-100k, 37.3% for AGIs $100k-200k)
Taxable interest for individuals: $714 (reported on 46.7% of returns)
This zip code:
$714
Iowa:
$1,537
(% of AGI for various income ranges: 1.1% for AGIs below $25k, 0.9% for AGIs $25k-50k, 0.4% for AGIs $50k-75k, 1.2% for AGIs $75k-100k, 0.4% for AGIs $100k-200k)
Ordinary dividends: $2,100 (reported on 20.0% of returns)
Here:
$2,100
State:
$4,542
(% of AGI for various income ranges: 2.2% for AGIs below $25k, 1.4% for AGIs $25k-50k, 2.2% for AGIs $75k-100k)
Net capital gain/loss in AGI: +$9,800 (reported on 15.6% of returns)
Here:
+$9,800
State:
+$11,802
Profit/loss from business: +$5,612 (reported on 17.8% of returns)
Here:
+$5,612
State:
+$10,509
Taxable individual retirement arrangement distribution: $6,325 (reported on 8.9% of returns)
52649:
$6,325
Iowa:
$11,773
Total itemized deductions: $19,514 (17% of AGI, reported on 15.6% of returns)
Here:
$19,514
State:
$21,278
Here:
17.3% of AGI
State:
18.9% of AGI
Charity contributions: $2,383 (reported on 13.3% of returns)
Here:
$2,383
State:
$4,044
Taxes paid: $6,600 (reported on 15.6% of returns)
52649:
$6,600
State:
$8,846
Earned income credit: $1,962 (reported on 17.8% of returns)
Here:
$1,962
State:
$2,098
(% of AGI for various income ranges: 6.2% for AGIs below $25k)
Percentage of individuals using paid preparers for their 2012 taxes: 75.6%
Here:
76%
State:
65%
(% for various income ranges: 63.2% for AGIs below $25k, 75.0% for AGIs $25k-50k, 85.7% for AGIs $50k-75k, 100.0% for AGIs $75k-100k, 100.0% for AGIs $100k-200k)
Averages for the 2004 tax year for zip code 52649, filed in 2005:
Average Adjusted Gross Income (AGI) in 2004: $31,862 (Individual Income Tax Returns)
Here:
$31,862
State:
$43,875
Salary/wage: $31,284 (reported on 84.5% of returns)
Here:
$31,284
State:
$38,265
(% of AGI for various income ranges: 206.0% for AGIs below $10k, 78.1% for AGIs $10k-25k, 81.3% for AGIs $25k-50k, 85.9% for AGIs $50k-75k, 84.4% for AGIs $75k-100k, 66.5% for AGIs over 100k)
Taxable interest for individuals: $1,417 (reported on 51.3% of returns)
This zip code:
$1,417
Iowa:
$1,768
(% of AGI for various income ranges: 15.5% for AGIs below $10k, 5.5% for AGIs $10k-25k, 2.4% for AGIs $25k-50k, 1.3% for AGIs $50k-75k, 0.4% for AGIs $75k-100k)
Taxable dividends: $1,238 (reported on 26.6% of returns)
Here:
$1,238
State:
$2,510
(% of AGI for various income ranges: 4.7% for AGIs below $10k, 1.4% for AGIs $10k-25k, 1.4% for AGIs $25k-50k, 0.9% for AGIs $50k-75k, 0.2% for AGIs $75k-100k)
Net capital gain/loss: +$1,534 (reported on 22.5% of returns)
Here:
+$1,534
State:
+$6,139
(% of AGI for various income ranges: -3.9% for AGIs below $10k, 2.0% for AGIs $10k-25k, 1.0% for AGIs $25k-50k, 0.2% for AGIs $50k-75k, 4.5% for AGIs $75k-100k)
Profit/loss from business: +$4,288 (reported on 17.5% of returns)
Here:
+$4,288
State:
+$8,574
(% of AGI for various income ranges: 2.6% for AGIs below $10k, 1.1% for AGIs $10k-25k, 4.1% for AGIs $25k-50k, 2.8% for AGIs $50k-75k)
IRA payment deduction: $2,273 (reported on 2.4% of returns)
52649:
$2,273
Iowa:
$2,970
Total itemized deductions: $14,833 (22% of AGI, reported on 11.8% of returns)
Here:
$14,833
State:
$16,976
Here:
22.4% of AGI
State:
20.8% of AGI
Charity contributions deductions: $1,333 (2% of AGI, reported on 8.5% of returns)
Here:
$1,333
State:
$3,089
Here:
2.0% of AGI
State:
3.6% of AGI
(% of AGI for various income ranges: 0.9% for AGIs $10k-25k, 0.5% for AGIs $50k-75k, 0.6% for AGIs $75k-100k)
Total tax: $3,588 (reported on 71.6% of returns)
52649:
$3,588
State:
$6,177
(% of AGI for various income ranges: 6.9% for AGIs below $10k, 4.2% for AGIs $10k-25k, 6.3% for AGIs $25k-50k, 8.8% for AGIs $50k-75k, 9.2% for AGIs $75k-100k, 15.9% for AGIs over 100k)
Earned income credit: $1,431 (reported on 15.7% of returns)
Here:
$1,431
State:
$1,540
Percentage of individuals using paid preparers for their 2004 taxes: 77.5%
Here:
78%
State:
70%
(% for various income ranges: 74.5% for AGIs below $10k, 70.6% for AGIs $10k-25k, 76.7% for AGIs $25k-50k, 90.1% for AGIs $50k-75k, 89.5% for AGIs $75k-100k, 90.9% for AGIs over 100k)
Household received Food Stamps/SNAP in the past 12 months: 28 Household did not receive Food Stamps/SNAP in the past 12 months: 271
Women who had a birth in the past 12 months: 3 (3 now married, 0 unmarried) Women who did not have a birth in the past 12 months: 116 (89 now married, 27 unmarried)
Housing units in zip code 52649 with a mortgage: 196 (11 second mortgage, 11 both second mortgage and home equity loan) Median monthly owner costs for units with a mortgage: $1,856 Median monthly owner costs for units without a mortgage: $581
Residents with income below the poverty level in 2022:
This zip code:
6.6%
Whole state:
11.0%
Residents with income below 50% of the poverty level in 2022:
This zip code:
4.6%
Whole state:
5.5%
Median number of rooms in houses and condos:
Here:
7.8
State:
6.8
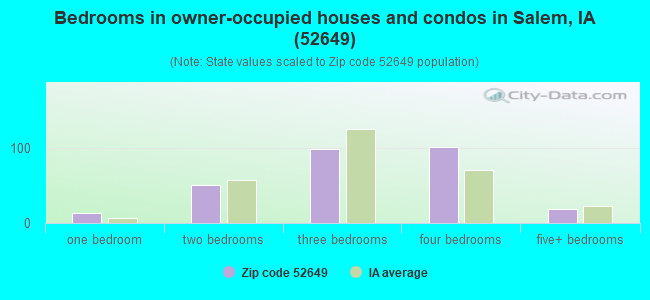
Median number of rooms in apartments:
Here:
4.8
State:
4.2
Notable locations in this zip code not listed on our city pages
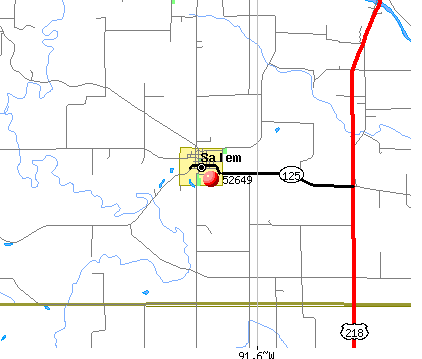
Notable locations in zip code 52649: Salem Fire and Rescue (A), Lewelling Quaker Shrine (B), Salem City hall (C), Crew Public Library (D). Display/hide their locations on the map
Size of family households: 104 2-persons, 30 3-persons, 5 4-persons, 58 5-persons, 14 6-persons, 1 7-or-more-persons
Size of nonfamily households: 57 1-person, 30 2-persons
184 married couples with children.
24 single-parent households (7 men, 17 women).
96.4% of residents of 52649 zip code speak English at home.
2.4% of residents speak Spanish at home (100% very well).
0.7% of residents speak other Indo-European language at home (100% very well).
0.8% of residents speak Asian or Pacific Island language at home (100% very well).
Foreign born population: 7 (1.0%) (86.1% of them are naturalized citizens)
This zip code:
1.0%
Whole state:
6.0%
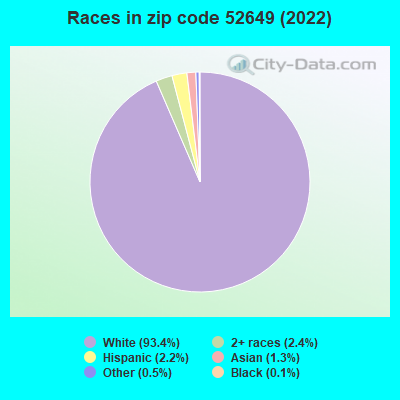
43%Japan
29%Indonesia
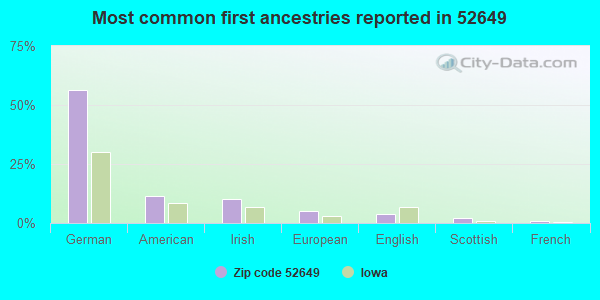
56%German
11%American
10%Irish
5%European
4%English
2%Scottish
1%French
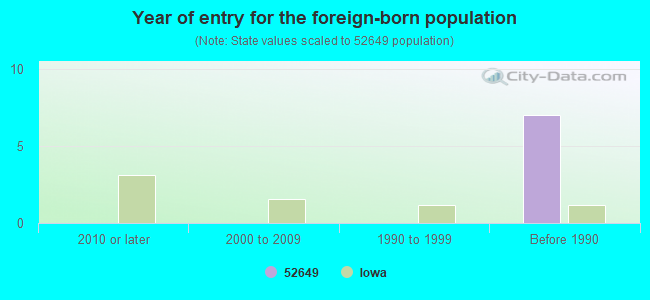
Year of entry for the foreign-born population
02010 or later
02000 to 2009
01990 to 1999
7Before 1990
Facilities with environmental interests located in this zip code:
SALEM ELEMENTARY SCHOOL (412 E. JACKSON ST. in SALEM, IA)
(Geographic Names Information System) (National Center for Education Statistics) - STATE ID-444536 436 Organizations: MOUNT PLEASANT COMM SCHOOL DISTRICT (SCHOOL DISTRICT)
SALEM CITY OF STP (CITY CLERK in SALEM, IA)
National Pollutant Discharge Elimination System NON-MAJOR (Tracking pollutant discharge elimination systems) - permit Business SIC classification: SEWERAGE SYSTEMS Organizations: CITY OF SALEM (CONTACT/OWNER)
Housing units lacking complete plumbing facilities: 15.8%
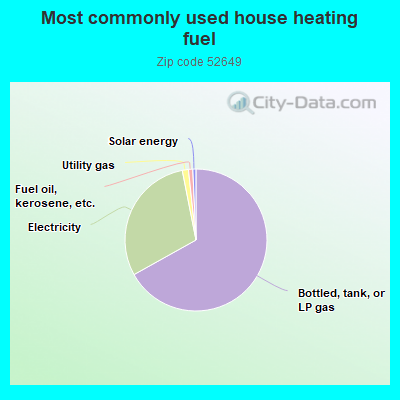
66.9%Bottled, tank, or LP gas
30.0%Electricity
1.4%Utility gas
1.0%Fuel oil, kerosene, etc.
0.7%Solar energy
Population in 1990: 786. Population change in the 1990s: +165 (+21.0%).
Place of birth for U.S.-born residents:
This state: 652
Northeast: 6
Midwest: 53
South: 20
West: 21
65% of the 52649 zip code residents lived in the same house 5 years ago. Out of people who lived in different houses, 54% lived in this county. Out of people who lived in different counties, 50% lived in Iowa.
94% of the 52649 zip code residents lived in the same house 1 year ago. Out of people who lived in different houses, 36% moved from this county. Out of people who lived in different houses, 6% moved from different county within same state. Out of people who lived in different houses, 61% moved from different state.
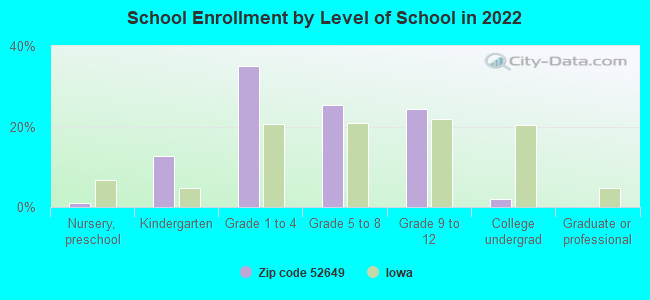
Private vs. public school enrollment:
Students in private schools in grades 1 to 8 (elementary and middle school):
Here:
0.0%
Iowa:
10.6%
Students in private schools in grades 9 to 12 (high school):
Here:
0.0%
Iowa:
7.9%
Students in private undergraduate colleges:
Here:
32.9%
Iowa:
23.9%
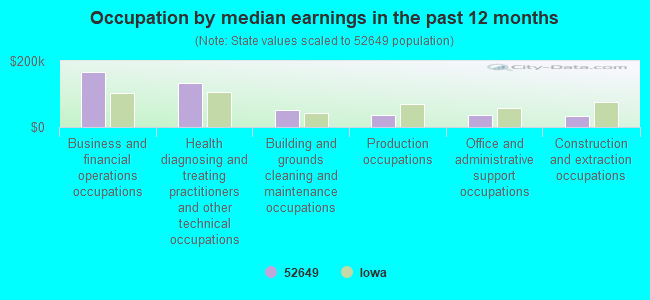
Occupation by median earnings in the past 12 months ($)
166,098Business and financial operations occupations
131,829Health diagnosing and treating practitioners and other technical occupations
50,746Building and grounds cleaning and maintenance occupations
36,976Production occupations
35,133Office and administrative support occupations
31,824Construction and extraction occupations
Top industries in this zip code by the number of employees in 2005:
Health Care and Social Assistance: Services for the Elderly and Persons with Disabilities (1-4 employees: 1 establishment)
Administrative and Support and Waste Management and Remediation Services: All Other Support Services (1-4: 1)
Administrative and Support and Waste Management and Remediation Services: Landscaping Services (1-4: 1)
Other Services (except Public Administration): General Automotive Repair (1-4: 1)
Accommodation and Food Services: Drinking Places (Alcoholic Beverages) (1-4: 1)
Professional, Scientific, and Technical Services: Administrative Management and General Management Consulting Services (1-4: 1)
Construction: Poured Concrete Foundation and Structure Contractors (1-4: 1)
Fatal accident statistics in 2014:
Fatal accident count: 2
Vehicles involved in fatal accidents: 3
Fatal accidents caused by drunken drivers: 2
Fatalities: 2
Persons involved in fatal accidents: 8
Pedestrians involved in fatal accidents: 0
Fatal accident statistics in 2012:
Fatal accident count: 1
Vehicles involved in fatal accidents: 2
Fatal accidents caused by drunken drivers: 0
Fatalities: 2
Persons involved in fatal accidents: 4
Pedestrians involved in fatal accidents: 0
Most common first names in zip code 52649 among deceased individuals
Name
Count
Lived (average)
Mary
12
85.4 years
John
12
77.4 years
George
6
78.2 years
Robert
6
74.3 years
William
6
79.4 years
James
5
71.2 years
Lucille
5
87.8 years
Ruth
5
85.8 years
Harold
4
81.2 years
Frank
4
79.0 years
Most common last names in zip code 52649 among deceased individuals
Last name
Count
Lived (average)
Kruse
10
78.5 years
Moeller
10
78.3 years
Thompson
6
80.9 years
Brown
5
83.6 years
Mcdowell
5
77.4 years
Harshbarger
5
81.6 years
Trueblood
5
83.0 years
Elmore
4
74.7 years
Garmoe
4
76.2 years
Bell
4
73.7 years
Discuss Salem, Iowa (IA) on our hugely popular Iowa forum.


 Nearest zip codes: 52630, 52657, 52641, 52625, 52656, 52651.