Estimated zip code population in 2022: 1,382 Zip code population in 2010: 1,798 Zip code population in 2000: 1,897
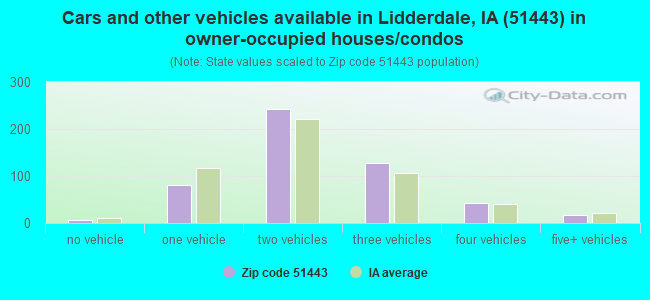
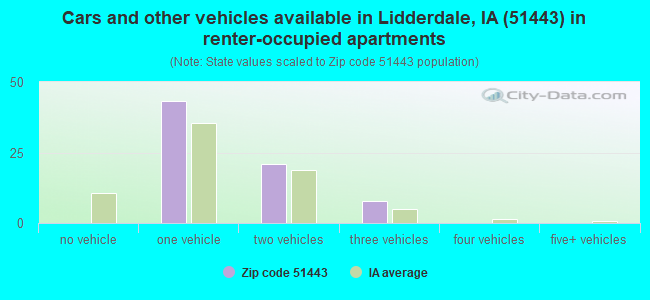
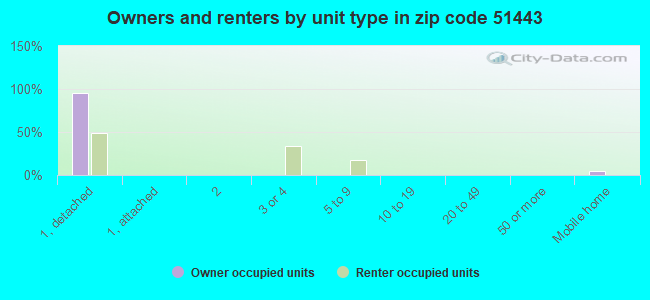
Houses and condos: 681 Renter-occupied apartments: 71
% of renters here:
12%
State:
28%
March 2022 cost of living index in zip code 51443: 81.6 (low, U.S. average is 100)
Land area: 106.4 sq. mi. Water area: 0.3 sq. mi.
Population density: 13 people per square mile
(very low).
OSM Map
General Map
Google Map
MSN Map
OSM Map
General Map
Google Map
MSN Map
OSM Map
General Map
Google Map
MSN Map
OSM Map
General Map
Google Map
MSN Map
Please wait while loading the map...
Real estate property taxes paid for housing units in 2022:
This zip code:
0.8% ($1,461)
Iowa:
1.4% ($2,724)
Median real estate property taxes paid for housing units with mortgages in 2022: $1,537 (0.9%) Median real estate property taxes paid for housing units with no mortgage in 2022: $1,400 (0.8%)
Business Search- 14 Million verified businesses
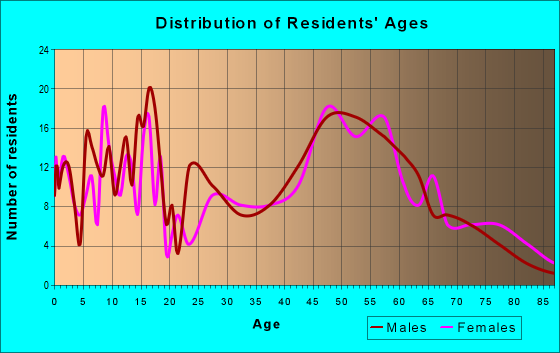
Males: 729
(52.8%)
Females: 653
(47.2%)
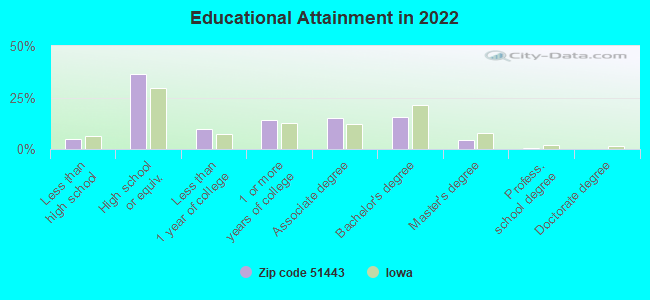
For population 25 years and over in 51443:
High school or higher: 93.2%
Bachelor's degree or higher: 19.8%
Graduate or professional degree: 4.7%
Unemployed: 0.4%
Mean travel time to work (commute): 17.4 minutes
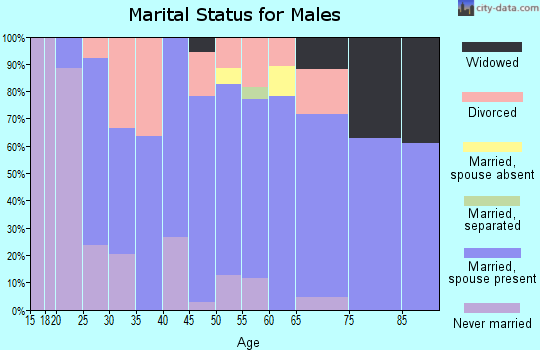
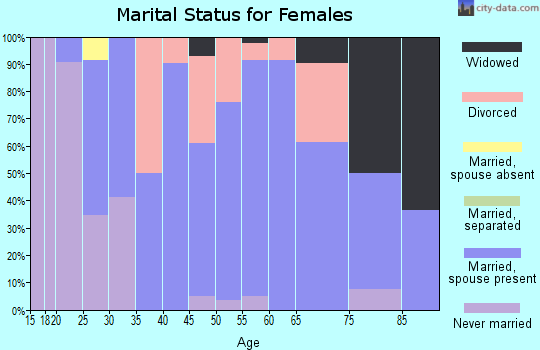
For population 15 years and over in 51443:
Never married: 22.2%
Now married: 59.6%
Separated: 0.0%
Widowed: 6.6%
Divorced: 11.6%
Zip code 51443 compared to state average:
Unemployed percentage significantly below state average.
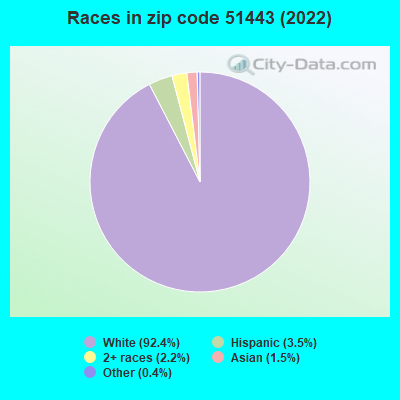
Black race population percentage significantly below state average.
Hispanic race population percentage below state average.
Median age significantly above state average.
Foreign-born population percentage significantly below state average.
Renting percentage significantly below state average.
Length of stay since moving in significantly above state average.
Number of college students below state average.
Percentage of population with a bachelor's degree or higher below state average.
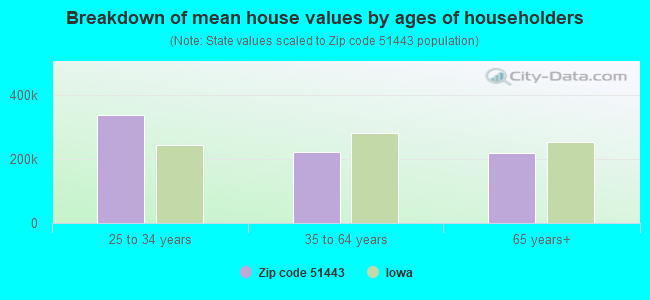
Estimated median house/condo value in 2022: $179,598
51443:
$179,598
Iowa:
$194,600
According to our research of Iowa and other state lists, there was 1 registered sex offender living in 51443 zip code as of May 16, 2024. The ratio of all residents to sex offenders in zip code 51443 is 1,932 to 1. The ratio of registered sex offenders to all residents in this zip code is much lower than the state average.
Median resident age:
This zip code:
48.2 years
Iowa median age:
38.9 years
Average household size:
This zip code:
2.3 people
Iowa:
2.3 people
Averages for the 2020 tax year for zip code 51443, filed in 2021:
Average Adjusted Gross Income (AGI) in 2020: $67,734 (Individual Income Tax Returns)
Here:
$67,734
State:
$71,087
Salary/wage: $52,422 (reported on 80.0% of returns)
Here:
$52,422
State:
$57,361
(% of AGI for various income ranges: 1138.6% for AGIs below $25k, 3602.3% for AGIs $25k-50k, 6575.6% for AGIs $50k-75k, 9812.9% for AGIs $75k-100k, 14372.5% for AGIs $100k-200k)
Taxable interest for individuals: $1,479 (reported on 41.2% of returns)
This zip code:
$1,479
Iowa:
$1,633
(% of AGI for various income ranges: 24.3% for AGIs below $25k, 25.4% for AGIs $25k-50k, 32.2% for AGIs $50k-75k, 82.9% for AGIs $75k-100k, 253.8% for AGIs $100k-200k)
Ordinary dividends: $3,358 (reported on 23.8% of returns)
Here:
$3,358
State:
$5,432
(% of AGI for various income ranges: 24.3% for AGIs below $25k, 58.5% for AGIs $25k-50k, 110.0% for AGIs $50k-75k, 135.7% for AGIs $75k-100k, 417.5% for AGIs $100k-200k)
Net capital gain/loss in AGI: +$17,694 (reported on 22.5% of returns)
Here:
+$17,694
State:
+$15,243
(% of AGI for various income ranges: 20.7% for AGIs below $25k, 77.7% for AGIs $25k-50k, 163.3% for AGIs $50k-75k, 222.9% for AGIs $75k-100k, 725.0% for AGIs $100k-200k)
Profit/loss from business: +$10,829 (reported on 17.5% of returns)
Here:
+$10,829
State:
+$11,763
(% of AGI for various income ranges: 141.4% for AGIs below $25k, 83.8% for AGIs $25k-50k, 134.4% for AGIs $50k-75k, 117.1% for AGIs $75k-100k, 1257.5% for AGIs $100k-200k)
Taxable individual retirement arrangement distribution: $16,570 (reported on 12.5% of returns)
51443:
$16,570
Iowa:
$17,324
(% of AGI for various income ranges: 87.9% for AGIs below $25k, 272.3% for AGIs $25k-50k, 576.7% for AGIs $50k-75k, 826.2% for AGIs $100k-200k)
Total itemized deductions: $29,667 (reported on 3.8% of returns)
Here:
$29,667
State:
$33,775
(% of AGI for various income ranges: 988.9% for AGIs $50k-75k)
Charity contributions: $7,000 (reported on 2.5% of returns)
Here:
$7,000
State:
$13,075
(% of AGI for various income ranges: 107.7% for AGIs $25k-50k)
Taxes paid: $5,567 (reported on 3.8% of returns)
51443:
$5,567
State:
$7,704
(% of AGI for various income ranges: 185.6% for AGIs $50k-75k)
Earned income credit: $1,857 (reported on 8.8% of returns)
Here:
$1,857
State:
$2,195
(% of AGI for various income ranges: 57.9% for AGIs below $25k, 37.7% for AGIs $25k-50k)
Percentage of individuals using paid preparers for their 2020 taxes: 95.0%
Here:
95%
State:
95%
(% for various income ranges: 90.9% for AGIs below $25k, 94.1% for AGIs $25k-50k, 100.0% for AGIs $50k-75k, 100.0% for AGIs $75k-100k, 92.9% for AGIs $100k-200k, 100.0% for AGIs over 200k)
Averages for the 2012 tax year for zip code 51443, filed in 2013:
Average Adjusted Gross Income (AGI) in 2012: $56,107 (Individual Income Tax Returns)
Here:
$56,107
State:
$58,860
Salary/wage: $39,750 (reported on 84.7% of returns)
Here:
$39,750
State:
$46,659
(% of AGI for various income ranges: 73.6% for AGIs below $25k, 74.3% for AGIs $25k-50k, 76.5% for AGIs $50k-75k, 72.7% for AGIs $75k-100k, 76.0% for AGIs $100k-200k)
Taxable interest for individuals: $935 (reported on 47.1% of returns)
This zip code:
$935
Iowa:
$1,537
(% of AGI for various income ranges: 1.6% for AGIs below $25k, 0.6% for AGIs $25k-50k, 0.5% for AGIs $50k-75k, 0.7% for AGIs $75k-100k, 1.7% for AGIs $100k-200k)
Ordinary dividends: $1,841 (reported on 25.9% of returns)
Here:
$1,841
State:
$4,542
(% of AGI for various income ranges: 0.8% for AGIs below $25k, 1.1% for AGIs $25k-50k, 0.7% for AGIs $50k-75k, 0.3% for AGIs $75k-100k, 2.1% for AGIs $100k-200k)
Net capital gain/loss in AGI: +$4,880 (reported on 17.6% of returns)
Here:
+$4,880
State:
+$11,802
(% of AGI for various income ranges: 1.5% for AGIs $25k-50k, 0.8% for AGIs $50k-75k, 5.8% for AGIs $100k-200k)
Profit/loss from business: +$6,512 (reported on 18.8% of returns)
Here:
+$6,512
State:
+$10,509
(% of AGI for various income ranges: 4.8% for AGIs below $25k, 3.8% for AGIs $25k-50k, 0.9% for AGIs $50k-75k, 1.8% for AGIs $75k-100k, 3.6% for AGIs $100k-200k)
Taxable individual retirement arrangement distribution: $7,188 (reported on 9.4% of returns)
51443:
$7,188
Iowa:
$11,773
Total itemized deductions: $19,637 (17% of AGI, reported on 22.4% of returns)
Here:
$19,637
State:
$21,278
Here:
16.8% of AGI
State:
18.9% of AGI
(% of AGI for various income ranges: 12.1% for AGIs $25k-50k, 6.9% for AGIs $50k-75k, 7.3% for AGIs $75k-100k, 9.1% for AGIs $100k-200k, 7.4% for AGIs over 200k)
Charity contributions: $2,976 (reported on 20.0% of returns)
Here:
$2,976
State:
$4,044
(% of AGI for various income ranges: 1.0% for AGIs $25k-50k, 0.6% for AGIs $50k-75k, 0.7% for AGIs $75k-100k, 3.4% for AGIs $100k-200k)
Taxes paid: $7,322 (reported on 21.2% of returns)
51443:
$7,322
State:
$8,846
(% of AGI for various income ranges: 1.7% for AGIs $25k-50k, 1.7% for AGIs $50k-75k, 2.4% for AGIs $75k-100k, 4.3% for AGIs $100k-200k, 4.5% for AGIs over 200k)
Earned income credit: $2,122 (reported on 10.6% of returns)
Here:
$2,122
State:
$2,098
(% of AGI for various income ranges: 3.7% for AGIs below $25k, 0.8% for AGIs $25k-50k)
Percentage of individuals using paid preparers for their 2012 taxes: 78.8%
Here:
79%
State:
65%
(% for various income ranges: 73.3% for AGIs below $25k, 76.2% for AGIs $25k-50k, 85.7% for AGIs $50k-75k, 81.8% for AGIs $75k-100k, 85.7% for AGIs $100k-200k, 100.0% for AGIs over 200k)
Averages for the 2004 tax year for zip code 51443, filed in 2005:
Average Adjusted Gross Income (AGI) in 2004: $35,249 (Individual Income Tax Returns)
Here:
$35,249
State:
$43,875
Salary/wage: $30,555 (reported on 86.4% of returns)
Here:
$30,555
State:
$38,265
(% of AGI for various income ranges: 79.1% for AGIs below $10k, 81.9% for AGIs $10k-25k, 77.0% for AGIs $25k-50k, 82.1% for AGIs $50k-75k, 78.9% for AGIs $75k-100k, 44.5% for AGIs over 100k)
Taxable interest for individuals: $1,329 (reported on 57.6% of returns)
This zip code:
$1,329
Iowa:
$1,768
(% of AGI for various income ranges: 8.4% for AGIs below $10k, 4.1% for AGIs $10k-25k, 2.7% for AGIs $25k-50k, 1.2% for AGIs $50k-75k, 0.6% for AGIs $75k-100k, 1.6% for AGIs over 100k)
Taxable dividends: $976 (reported on 28.9% of returns)
Here:
$976
State:
$2,510
(% of AGI for various income ranges: 2.5% for AGIs below $10k, 0.8% for AGIs $10k-25k, 0.7% for AGIs $25k-50k, 0.6% for AGIs $50k-75k, 0.2% for AGIs $75k-100k, 1.5% for AGIs over 100k)
Net capital gain/loss: +$2,663 (reported on 24.3% of returns)
Here:
+$2,663
State:
+$6,139
(% of AGI for various income ranges: -3.1% for AGIs below $10k, 1.4% for AGIs $10k-25k, 0.4% for AGIs $25k-50k, 0.7% for AGIs $50k-75k, 0.5% for AGIs $75k-100k, 9.8% for AGIs over 100k)
Profit/loss from business: +$5,077 (reported on 19.7% of returns)
Here:
+$5,077
State:
+$8,574
(% of AGI for various income ranges: 12.0% for AGIs below $10k, 2.2% for AGIs $10k-25k, 3.2% for AGIs $25k-50k, 3.4% for AGIs $50k-75k, 2.4% for AGIs $75k-100k)
Profit/loss from farming: +$3,953 (reported on 15.1% of returns)
Here:
+$3,953
State:
-$74
(% of AGI for various income ranges: -10.0% for AGIs below $10k, 0.6% for AGIs $10k-25k, 2.0% for AGIs $25k-50k, 0.9% for AGIs $50k-75k, 9.3% for AGIs $75k-100k)
IRA payment deduction: $3,125 (reported on 4.7% of returns)
51443:
$3,125
Iowa:
$2,970
Total itemized deductions: $15,164 (25% of AGI, reported on 25.0% of returns)
Here:
$15,164
State:
$16,976
Here:
25.1% of AGI
State:
20.8% of AGI
(% of AGI for various income ranges: 17.0% for AGIs $10k-25k, 10.0% for AGIs $25k-50k, 9.2% for AGIs $50k-75k, 12.9% for AGIs $75k-100k, 10.7% for AGIs over 100k)
Charity contributions deductions: $2,721 (4% of AGI, reported on 21.4% of returns)
Here:
$2,721
State:
$3,089
Here:
4.2% of AGI
State:
3.6% of AGI
(% of AGI for various income ranges: 1.1% for AGIs $10k-25k, 1.0% for AGIs $25k-50k, 1.5% for AGIs $50k-75k, 2.1% for AGIs $75k-100k, 3.8% for AGIs over 100k)
Total tax: $3,972 (reported on 76.1% of returns)
51443:
$3,972
State:
$6,177
(% of AGI for various income ranges: 3.6% for AGIs below $10k, 4.4% for AGIs $10k-25k, 6.7% for AGIs $25k-50k, 7.9% for AGIs $50k-75k, 10.6% for AGIs $75k-100k, 17.2% for AGIs over 100k)
Earned income credit: $1,607 (reported on 13.1% of returns)
Here:
$1,607
State:
$1,540
Percentage of individuals using paid preparers for their 2004 taxes: 81.4%
Here:
81%
State:
70%
(% for various income ranges: 76.2% for AGIs below $10k, 79.7% for AGIs $10k-25k, 80.0% for AGIs $25k-50k, 87.7% for AGIs $50k-75k, 89.5% for AGIs $75k-100k, 96.2% for AGIs over 100k)
Household received Food Stamps/SNAP in the past 12 months: 21 Household did not receive Food Stamps/SNAP in the past 12 months: 571
Women who had a birth in the past 12 months: 9 (9 now married, 0 unmarried) Women who did not have a birth in the past 12 months: 204 (106 now married, 97 unmarried)
Housing units in zip code 51443 with a mortgage: 252 (23 second mortgage, 18 both second mortgage and home equity loan) Houses without a mortgage: 11
Median monthly owner costs for units with a mortgage: $1,139 Median monthly owner costs for units without a mortgage: $500
Residents with income below the poverty level in 2022:
This zip code:
10.3%
Whole state:
11.0%
Residents with income below 50% of the poverty level in 2022:
This zip code:
4.7%
Whole state:
5.5%
Median number of rooms in houses and condos:
Here:
7.1
State:
6.8
Median number of rooms in apartments:
Here:
4.0
State:
4.2
Notable locations in this zip code not listed on our city pages
Notable locations in zip code 51443: North Racoon - Andrews Access (A), Glidden (B), Glidden Fire Department (C), Glidden Public Library (D). Display/hide their locations on the map
Churches in zip code 51443 include: Grace Baptist Church (A), Peace Lutheran Church (B), Glidden Presbyterian Church (C), Saint Elizabith Seton Church (D), United Methodist Church (E), Pleasant Ridge Community Church (F), Saint Johns Church (G). Display/hide their locations on the map
Cemeteries: Salisbury Cemetery (1), Dickson Cemetery (2), East Liberty Cemetery (3), West Lawn Cemetery (4), Holy Family Cemetery (5), Lanesboro Cemetery (6). Display/hide their locations on the map
Streams, rivers, and creeks: Buck Run (A), Storm Creek (B), Dickson Branch (C), Purgatory Creek (D), Doe Brook (E), Marrowbone Creek (F). Display/hide their locations on the map
Parks in zip code 51443 include: Hobbs County Park (1), Butrick Bluff Wildlife Area (2), Buck Run Creek Area (3), Hazelton Wildlife Area (4), Artesian Lake County Park (5), Merritt County Park (6), Carroll County Park (7), Bennett County Park (8), Richey County Park (9). Display/hide their locations on the map
In group quarters: 10 (-1 institutionalized population)
Size of family households: 267 2-persons, 24 3-persons, 57 4-persons, 49 5-persons, 3 6-persons
Size of nonfamily households: 168 1-person, 21 2-persons
223 married couples with children.
64 single-parent households (25 men, 39 women).
97.9% of residents of 51443 zip code speak English at home.
0.4% of residents speak Spanish at home (100% very well).
1.2% of residents speak Asian or Pacific Island language at home (100% well).
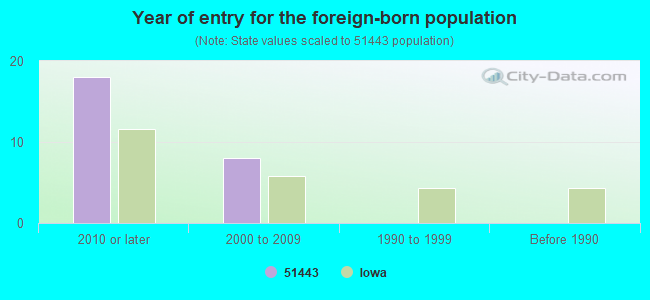
Foreign born population: 26 (1.9%) (36.8% of them are naturalized citizens)
This zip code:
1.9%
Whole state:
6.0%
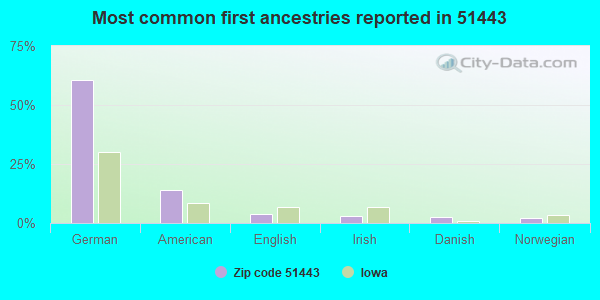
61%German
14%American
4%English
3%Irish
3%Danish
2%Norwegian
1%British
Year of entry for the foreign-born population
182010 or later
82000 to 2009
01990 to 1999
0Before 1990
Facilities with environmental interests located in this zip code:
SCHON LUMBER (127 WEST 1ST STREET in GLIDDEN, IA)
AIR MINOR (AIRS/AFS) (Resource Conservation and Recovery Act (tracking hazardous waste)) Business SIC classification: GENERAL CONTRACTORS-SINGLE-FAMILY HOUSES
Housing units lacking complete plumbing facilities: 4.7% Housing units lacking complete kitchen facilities: 7.8%
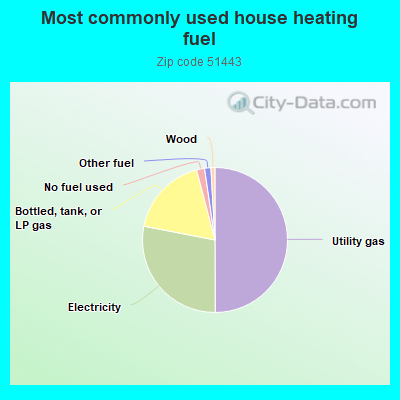
50.1%Utility gas
28.2%Electricity
17.9%Bottled, tank, or LP gas
1.8%No fuel used
1.4%Other fuel
0.9%Wood
Population in 1990: 1,518. Population change in the 1990s: +379 (+25.0%).
Place of birth for U.S.-born residents:
This state: 1,201
Northeast: 22
Midwest: 89
South: 20
West: 23
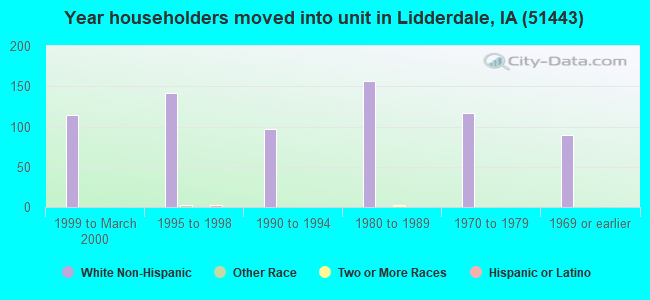
67% of the 51443 zip code residents lived in the same house 5 years ago. Out of people who lived in different houses, 62% lived in this county. Out of people who lived in different counties, 50% lived in Iowa.
95% of the 51443 zip code residents lived in the same house 1 year ago. Out of people who lived in different houses, 69% moved from this county. Out of people who lived in different houses, 33% moved from different county within same state.
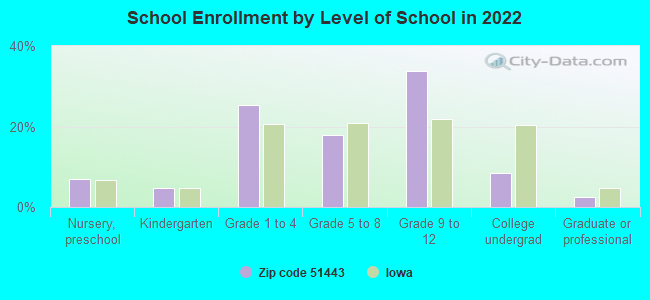
Private vs. public school enrollment:
Students in private schools in grades 1 to 8 (elementary and middle school):
Here:
0.0%
Iowa:
10.6%
Students in private schools in grades 9 to 12 (high school):
Here:
0.0%
Iowa:
7.9%
Students in private undergraduate colleges: 2
Here:
9.8%
Iowa:
23.9%
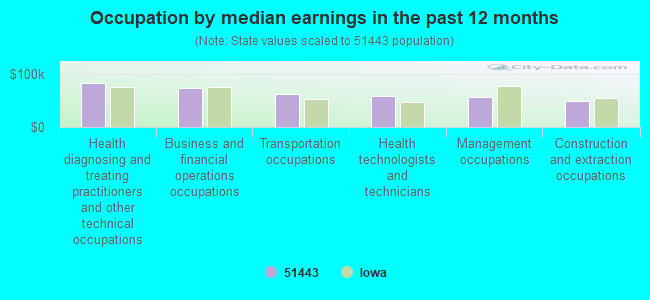
Occupation by median earnings in the past 12 months ($)
82,620Health diagnosing and treating practitioners and other technical occupations
72,874Business and financial operations occupations
61,705Transportation occupations
57,314Health technologists and technicians
57,060Management occupations
49,595Construction and extraction occupations
Top industries in this zip code by the number of employees in 2005:
Health Care and Social Assistance: Residential Mental Retardation Facilities (20-49 employees: 1 establishment, 10-19 employees: 1 establishment)
Accommodation and Food Services: Full-Service Restaurants (20-49: 1)
Accommodation and Food Services: Limited-Service Restaurants (10-19: 1)
Wholesale Trade: Grain and Field Bean Merchant Wholesalers (10-19: 1)
Utilities: Electric Power Distribution (10-19: 1)
Finance and Insurance: Insurance Agencies and Brokerages (1-4: 4)
Other Services (except Public Administration): Religious Organizations (1-4: 4)
Professional, Scientific, and Technical Services: Research and Development in the Physical, Engineering, and Life Sciences (5-9: 1)
Wholesale Trade: Farm and Garden Machinery and Equipment Merchant Wholesalers (5-9: 1)
People in group quarters in 2010:
9 people in group homes intended for adults
People in group quarters in 2000:
127 people in schools, hospitals, or wards for the intellectually disabled
Fatal accident statistics in 2014:
Fatal accident count: 2
Vehicles involved in fatal accidents: 3
Fatal accidents caused by drunken drivers: 1
Fatalities: 2
Persons involved in fatal accidents: 4
Pedestrians involved in fatal accidents: 0
2002 - 2018 National Fire Incident Reporting System (NFIRS) incidents
Based on the data from the years 2002 - 2018 the average number of fire incidents per year is 12. The highest number of fire incidents - 20 took place in 2003, and the least - 4 in 2018. The data has a decreasing trend.
When looking into fire subcategories, the most incidents belonged to: Outside Fires (42.9%), and Structure Fires (33.2%).
Fire incident types reported to NFIRS in Zip Code 51443


+$3,953
-$74
(% of AGI for various income ranges: -10.0% for AGIs below $10k, 0.6% for AGIs $10k-25k, 2.0% for AGIs $25k-50k, 0.9% for AGIs $50k-75k, 9.3% for AGIs $75k-100k)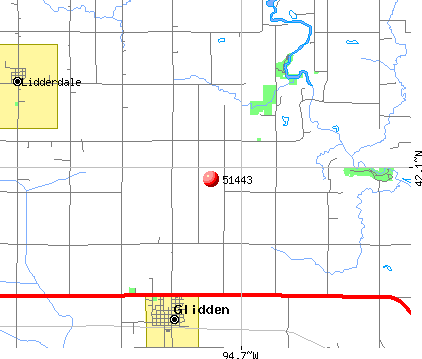 Nearest zip codes: 51459, 51451, 51462, 51401, 51449, 51440.
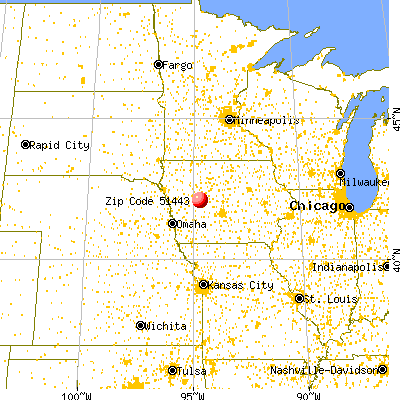


 Based on the data from the years 2002 - 2018 the average number of fire incidents per year is 12. The highest number of fire incidents - 20 took place in 2003, and the least - 4 in 2018. The data has a decreasing trend.
 When looking into fire subcategories, the most incidents belonged to: Outside Fires (42.9%), and Structure Fires (33.2%).