Estimated zip code population in 2022: 5,900 Zip code population in 2010: 5,848 Zip code population in 2000: 6,226
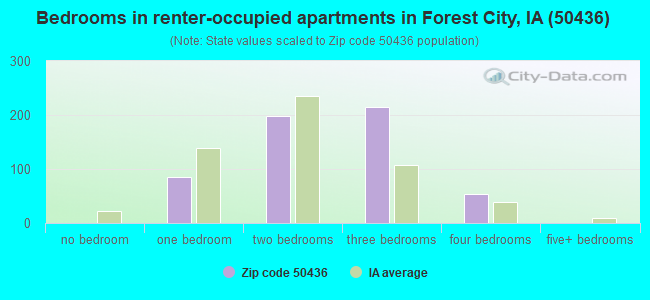
Houses and condos: 2,625 Renter-occupied apartments: 556
% of renters here:
24%
State:
28%
March 2022 cost of living index in zip code 50436: 75.1 (low, U.S. average is 100)
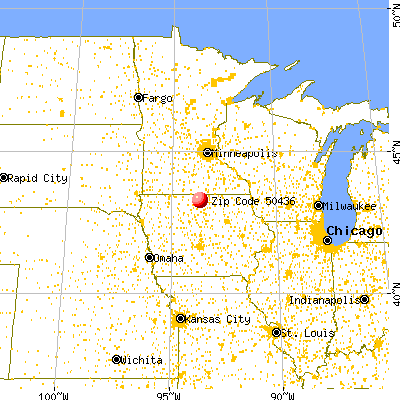
Land area: 136.1 sq. mi. Water area: 0.6 sq. mi.
Population density: 43 people per square mile
(very low).
OSM Map
General Map
Google Map
MSN Map
OSM Map
General Map
Google Map
MSN Map
OSM Map
General Map
Google Map
MSN Map
OSM Map
General Map
Google Map
MSN Map
Please wait while loading the map...
Real estate property taxes paid for housing units in 2022:
This zip code:
1.5% ($2,268)
Iowa:
1.4% ($2,724)
Median real estate property taxes paid for housing units with mortgages in 2022: $2,369 (1.5%) Median real estate property taxes paid for housing units with no mortgage in 2022: $2,143 (1.5%)
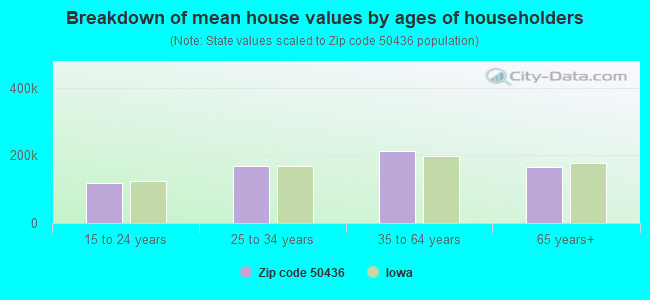
Estimated median house/condo value in 2022: $154,201
50436:
$154,201
Iowa:
$194,600
According to our research of Iowa and other state lists, there were 7 registered sex offenders living in 50436 zip code as of May 20, 2024. The ratio of all residents to sex offenders in zip code 50436 is 867 to 1. The ratio of registered sex offenders to all residents in this zip code is lower than the state average.
Median resident age:
This zip code:
35.8 years
Iowa median age:
38.9 years
Average household size:
This zip code:
2.3 people
Iowa:
2.3 people
Averages for the 2020 tax year for zip code 50436, filed in 2021:
Average Adjusted Gross Income (AGI) in 2020: $65,619 (Individual Income Tax Returns)
Here:
$65,619
State:
$71,087
Salary/wage: $50,645 (reported on 82.6% of returns)
Here:
$50,645
State:
$57,361
(% of AGI for various income ranges: 1111.6% for AGIs below $25k, 3344.7% for AGIs $25k-50k, 6318.6% for AGIs $50k-75k, 8681.1% for AGIs $75k-100k, 16997.9% for AGIs $100k-200k, 53246.7% for AGIs over 200k)
Taxable interest for individuals: $1,302 (reported on 42.1% of returns)
This zip code:
$1,302
Iowa:
$1,633
(% of AGI for various income ranges: 44.0% for AGIs below $25k, 29.2% for AGIs $25k-50k, 54.5% for AGIs $50k-75k, 114.7% for AGIs $75k-100k, 172.1% for AGIs $100k-200k, 1080.0% for AGIs over 200k)
Ordinary dividends: $3,821 (reported on 23.9% of returns)
Here:
$3,821
State:
$5,432
(% of AGI for various income ranges: 24.6% for AGIs below $25k, 30.8% for AGIs $25k-50k, 59.7% for AGIs $50k-75k, 124.7% for AGIs $75k-100k, 302.1% for AGIs $100k-200k, 3600.0% for AGIs over 200k)
Net capital gain/loss in AGI: +$13,539 (reported on 19.7% of returns)
Here:
+$13,539
State:
+$15,243
(% of AGI for various income ranges: 9.8% for AGIs below $25k, 29.8% for AGIs $25k-50k, 118.3% for AGIs $50k-75k, 244.2% for AGIs $75k-100k, 637.4% for AGIs $100k-200k, 15540.0% for AGIs over 200k)
Profit/loss from business: +$7,912 (reported on 15.4% of returns)
Here:
+$7,912
State:
+$11,763
(% of AGI for various income ranges: 79.0% for AGIs below $25k, 115.4% for AGIs $25k-50k, 159.7% for AGIs $50k-75k, 188.4% for AGIs $75k-100k, 412.6% for AGIs $100k-200k, 1613.3% for AGIs over 200k)
Taxable individual retirement arrangement distribution: $14,992 (reported on 14.3% of returns)
50436:
$14,992
Iowa:
$17,324
(% of AGI for various income ranges: 127.8% for AGIs below $25k, 188.8% for AGIs $25k-50k, 349.7% for AGIs $50k-75k, 615.8% for AGIs $75k-100k, 847.4% for AGIs $100k-200k)
Total itemized deductions: $29,250 (reported on 5.4% of returns)
Here:
$29,250
State:
$33,775
(% of AGI for various income ranges: 128.0% for AGIs below $25k, 141.9% for AGIs $25k-50k, 402.8% for AGIs $50k-75k, 763.2% for AGIs $100k-200k)
Charity contributions: $10,090 (reported on 3.9% of returns)
Here:
$10,090
State:
$13,075
(% of AGI for various income ranges: 21.2% for AGIs below $25k, 89.7% for AGIs $50k-75k, 338.4% for AGIs $100k-200k)
Taxes paid: $5,736 (reported on 5.4% of returns)
50436:
$5,736
State:
$7,704
(% of AGI for various income ranges: 11.0% for AGIs below $25k, 18.1% for AGIs $25k-50k, 87.6% for AGIs $50k-75k, 203.7% for AGIs $100k-200k)
Earned income credit: $2,034 (reported on 12.4% of returns)
Here:
$2,034
State:
$2,195
(% of AGI for various income ranges: 64.4% for AGIs below $25k, 55.8% for AGIs $25k-50k)
Percentage of individuals using paid preparers for their 2020 taxes: 95.8%
Here:
96%
State:
95%
(% for various income ranges: 93.1% for AGIs below $25k, 95.9% for AGIs $25k-50k, 95.2% for AGIs $50k-75k, 96.4% for AGIs $75k-100k, 100.0% for AGIs $100k-200k, 100.0% for AGIs over 200k)
Averages for the 2012 tax year for zip code 50436, filed in 2013:
Average Adjusted Gross Income (AGI) in 2012: $53,677 (Individual Income Tax Returns)
Here:
$53,677
State:
$58,860
Salary/wage: $42,775 (reported on 85.3% of returns)
Here:
$42,775
State:
$46,659
(% of AGI for various income ranges: 74.7% for AGIs below $25k, 79.3% for AGIs $25k-50k, 76.4% for AGIs $50k-75k, 73.7% for AGIs $75k-100k, 63.8% for AGIs $100k-200k, 39.7% for AGIs over 200k)
Taxable interest for individuals: $1,138 (reported on 49.2% of returns)
This zip code:
$1,138
Iowa:
$1,537
(% of AGI for various income ranges: 1.4% for AGIs below $25k, 1.2% for AGIs $25k-50k, 0.7% for AGIs $50k-75k, 0.8% for AGIs $75k-100k, 1.2% for AGIs $100k-200k, 1.2% for AGIs over 200k)
Ordinary dividends: $4,342 (reported on 22.2% of returns)
Here:
$4,342
State:
$4,542
(% of AGI for various income ranges: 1.4% for AGIs below $25k, 0.7% for AGIs $25k-50k, 1.0% for AGIs $50k-75k, 0.7% for AGIs $75k-100k, 1.4% for AGIs $100k-200k, 6.1% for AGIs over 200k)
Net capital gain/loss in AGI: +$7,283 (reported on 17.7% of returns)
Here:
+$7,283
State:
+$11,802
(% of AGI for various income ranges: 0.5% for AGIs $25k-50k, 0.7% for AGIs $50k-75k, 1.1% for AGIs $75k-100k, 2.9% for AGIs $100k-200k, 8.7% for AGIs over 200k)
Profit/loss from business: +$7,151 (reported on 15.4% of returns)
Here:
+$7,151
State:
+$10,509
(% of AGI for various income ranges: 4.8% for AGIs below $25k, 3.0% for AGIs $25k-50k, 1.6% for AGIs $50k-75k, 2.2% for AGIs $75k-100k, 1.9% for AGIs $100k-200k)
Taxable individual retirement arrangement distribution: $11,203 (reported on 12.8% of returns)
50436:
$11,203
Iowa:
$11,773
(% of AGI for various income ranges: 4.9% for AGIs below $25k, 3.1% for AGIs $25k-50k, 2.6% for AGIs $50k-75k, 2.2% for AGIs $75k-100k, 3.9% for AGIs $100k-200k)
Total itemized deductions: $19,276 (19% of AGI, reported on 25.2% of returns)
Here:
$19,276
State:
$21,278
Here:
19.1% of AGI
State:
18.9% of AGI
(% of AGI for various income ranges: 9.7% for AGIs below $25k, 7.7% for AGIs $25k-50k, 8.2% for AGIs $50k-75k, 9.8% for AGIs $75k-100k, 10.6% for AGIs $100k-200k, 8.4% for AGIs over 200k)
Charity contributions: $3,902 (reported on 21.1% of returns)
Here:
$3,902
State:
$4,044
(% of AGI for various income ranges: 1.2% for AGIs below $25k, 0.9% for AGIs $25k-50k, 1.3% for AGIs $50k-75k, 1.9% for AGIs $75k-100k, 1.9% for AGIs $100k-200k, 1.8% for AGIs over 200k)
Taxes paid: $7,347 (reported on 24.8% of returns)
50436:
$7,347
State:
$8,846
(% of AGI for various income ranges: 1.6% for AGIs below $25k, 1.6% for AGIs $25k-50k, 2.3% for AGIs $50k-75k, 3.1% for AGIs $75k-100k, 5.3% for AGIs $100k-200k, 5.7% for AGIs over 200k)
Earned income credit: $2,132 (reported on 15.0% of returns)
Here:
$2,132
State:
$2,098
(% of AGI for various income ranges: 5.1% for AGIs below $25k, 1.0% for AGIs $25k-50k)
Percentage of individuals using paid preparers for their 2012 taxes: 74.4%
Here:
74%
State:
65%
(% for various income ranges: 65.2% for AGIs below $25k, 74.3% for AGIs $25k-50k, 81.4% for AGIs $50k-75k, 82.8% for AGIs $75k-100k, 83.3% for AGIs $100k-200k, 100.0% for AGIs over 200k)
Averages for the 2004 tax year for zip code 50436, filed in 2005:
Average Adjusted Gross Income (AGI) in 2004: $42,145 (Individual Income Tax Returns)
Here:
$42,145
State:
$43,875
Salary/wage: $38,384 (reported on 85.2% of returns)
Here:
$38,384
State:
$38,265
(% of AGI for various income ranges: 126.4% for AGIs below $10k, 70.1% for AGIs $10k-25k, 83.3% for AGIs $25k-50k, 83.6% for AGIs $50k-75k, 80.1% for AGIs $75k-100k, 64.4% for AGIs over 100k)
Taxable interest for individuals: $1,310 (reported on 56.4% of returns)
This zip code:
$1,310
Iowa:
$1,768
(% of AGI for various income ranges: 9.9% for AGIs below $10k, 3.5% for AGIs $10k-25k, 1.6% for AGIs $25k-50k, 1.3% for AGIs $50k-75k, 1.5% for AGIs $75k-100k, 1.4% for AGIs over 100k)
Taxable dividends: $1,569 (reported on 28.6% of returns)
Here:
$1,569
State:
$2,510
(% of AGI for various income ranges: 3.6% for AGIs below $10k, 1.1% for AGIs $10k-25k, 0.7% for AGIs $25k-50k, 0.9% for AGIs $50k-75k, 1.2% for AGIs $75k-100k, 1.4% for AGIs over 100k)
Net capital gain/loss: +$11,806 (reported on 19.9% of returns)
Here:
+$11,806
State:
+$6,139
(% of AGI for various income ranges: 1.6% for AGIs below $10k, 1.0% for AGIs $10k-25k, 0.2% for AGIs $25k-50k, 1.3% for AGIs $50k-75k, 3.0% for AGIs $75k-100k, 18.4% for AGIs over 100k)
Profit/loss from business: +$6,840 (reported on 16.3% of returns)
Here:
+$6,840
State:
+$8,574
(% of AGI for various income ranges: 1.3% for AGIs below $10k, 5.1% for AGIs $10k-25k, 3.0% for AGIs $25k-50k, 2.3% for AGIs $50k-75k, 0.9% for AGIs $75k-100k, 2.9% for AGIs over 100k)
IRA payment deduction: $2,750 (reported on 3.1% of returns)
50436:
$2,750
Iowa:
$2,970
(% of AGI for various income ranges: 0.2% for AGIs $10k-25k, 0.3% for AGIs $25k-50k, 0.3% for AGIs $50k-75k, 0.2% for AGIs $75k-100k)
Self-employed pension: $8,833 (reported on 0.6% of returns)
Here:
$8,833
Iowa:
$11,928
Total itemized deductions: $15,050 (18% of AGI, reported on 25.8% of returns)
Here:
$15,050
State:
$16,976
Here:
18.4% of AGI
State:
20.8% of AGI
(% of AGI for various income ranges: 21.0% for AGIs below $10k, 10.7% for AGIs $10k-25k, 7.2% for AGIs $25k-50k, 7.7% for AGIs $50k-75k, 11.6% for AGIs $75k-100k, 10.0% for AGIs over 100k)
Charity contributions deductions: $3,214 (4% of AGI, reported on 23.5% of returns)
Here:
$3,214
State:
$3,089
Here:
3.8% of AGI
State:
3.6% of AGI
(% of AGI for various income ranges: 0.9% for AGIs below $10k, 1.3% for AGIs $10k-25k, 1.3% for AGIs $25k-50k, 1.6% for AGIs $50k-75k, 2.4% for AGIs $75k-100k, 2.3% for AGIs over 100k)
Total tax: $5,771 (reported on 76.5% of returns)
50436:
$5,771
State:
$6,177
(% of AGI for various income ranges: 3.9% for AGIs below $10k, 4.4% for AGIs $10k-25k, 6.8% for AGIs $25k-50k, 7.7% for AGIs $50k-75k, 10.1% for AGIs $75k-100k, 19.5% for AGIs over 100k)
Earned income credit: $1,545 (reported on 11.2% of returns)
Here:
$1,545
State:
$1,540
Percentage of individuals using paid preparers for their 2004 taxes: 75.5%
Here:
76%
State:
70%
(% for various income ranges: 59.0% for AGIs below $10k, 80.1% for AGIs $10k-25k, 78.5% for AGIs $25k-50k, 81.6% for AGIs $50k-75k, 77.9% for AGIs $75k-100k, 84.7% for AGIs over 100k)
Household received Food Stamps/SNAP in the past 12 months: 131 Household did not receive Food Stamps/SNAP in the past 12 months: 2,234
Women who had a birth in the past 12 months: 148 (93 now married, 53 unmarried) Women who did not have a birth in the past 12 months: 1,187 (591 now married, 595 unmarried)
Housing units in zip code 50436 with a mortgage: 946 (122 second mortgage, 126 both second mortgage and home equity loan) Houses without a mortgage: 7
Median monthly owner costs for units with a mortgage: $1,301 Median monthly owner costs for units without a mortgage: $588
Residents with income below the poverty level in 2022:
This zip code:
7.0%
Whole state:
11.0%
Residents with income below 50% of the poverty level in 2022:
This zip code:
4.9%
Whole state:
5.5%
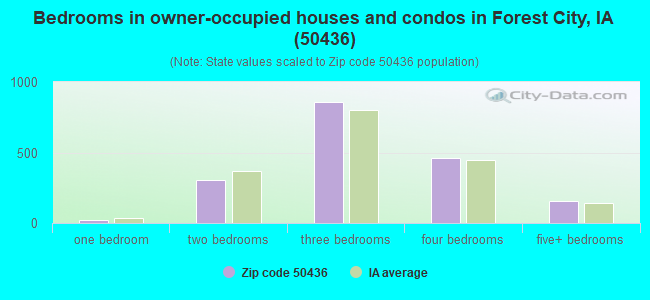
Median number of rooms in houses and condos:
Here:
6.9
State:
6.8
Median number of rooms in apartments:
Here:
5.4
State:
4.2
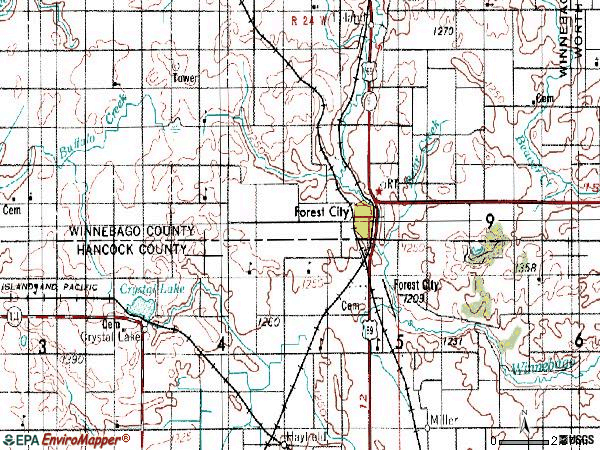
Notable locations in this zip code not listed on our city pages
Notable locations in zip code 50436: Mount Valley (A), Three Fingers Campground (B), Forest City Country Club (C), Forest City (D), Winnebago County Jail (E), Forest City Ambulance Service (F), Winnebago Industries Incorporated (G), Winnebago Industries Visitor Center (H), Timberland Museum (I), Annex (J), Campus Center (K), John K and Luise Hanson Fieldhouse (L), Nilssen-Boe Science Hall (M), Odvin Hagen Music Center (N), Thorson Hall (O), Salveson Hall (P), Forest City Fire Department (Q), Forest City Municipal Library (R), Forest City Hall (S), Mansion Museum (T). Display/hide their locations on the map
Churches in zip code 50436 include: Saint James Catholic Church (A), Forest Evangelical Lutheran Church (B), First Baptist Church (C), Immanual Lutheran Church (D), United Methodist Church (E), Calvary Baptist Church (F), Congregational Church (G), Pilot Knob Church (H). Display/hide their locations on the map
Cemeteries: Oakland Cemetery (1), Pilot Knob Lutheran Cemetery (2), Saint James Cemetery (3), Ellington Cemetery (4), Kingland Cemetery (5), Madison Cemetery (6), South Bethel Cemetery (7). Display/hide their locations on the map
Parks in zip code 50436 include: Eight Mile Pits Wildlife Management Area (1), Meredith Marsh Wildlife Management Area (2), Torkleson Pits Wildlife Area (3), Gabrielson Wildlife Management Area (4), Crystal Hills Wildlife Management Area (5), Clarks Woods Park (6), Thorpe Park (7), Russ Wildlife Area (8), Tim Coffee Park (9). Display/hide their locations on the map
In group quarters: 574 (-1 institutionalized population)
Size of family households: 690 2-persons, 285 3-persons, 304 4-persons, 126 5-persons, 24 6-persons, 9 7-or-more-persons
Size of nonfamily households: 784 1-person, 118 2-persons, 8 3-persons
981 married couples with children.
389 single-parent households (54 men, 335 women).
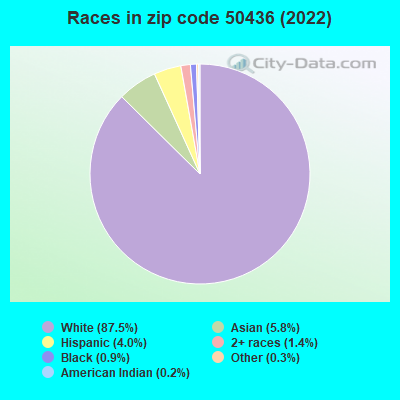
91.1% of residents of 50436 zip code speak English at home.
2.2% of residents speak Spanish at home (89% very well, 10% well, 1% not well).
2.0% of residents speak other Indo-European language at home (80% very well, 20% well).
4.0% of residents speak Asian or Pacific Island language at home (37% very well, 55% well, 4% not well, 4% not at all).
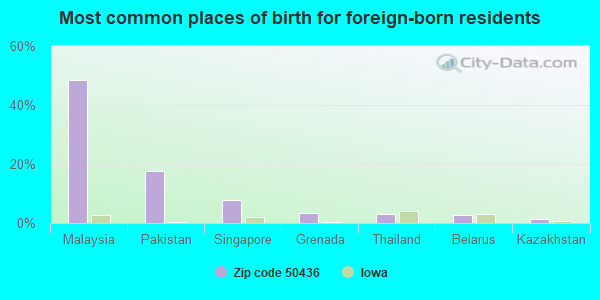
Foreign born population: 314 (5.3%) (64.2% of them are naturalized citizens)
This zip code:
5.3%
Whole state:
6.0%
48%Malaysia
18%Pakistan
8%Singapore
3%Grenada
3%Thailand
3%Belarus
1%Kazakhstan
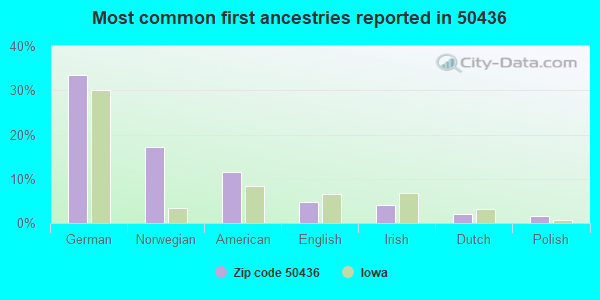
34%German
17%Norwegian
12%American
5%English
4%Irish
2%Dutch
2%Polish
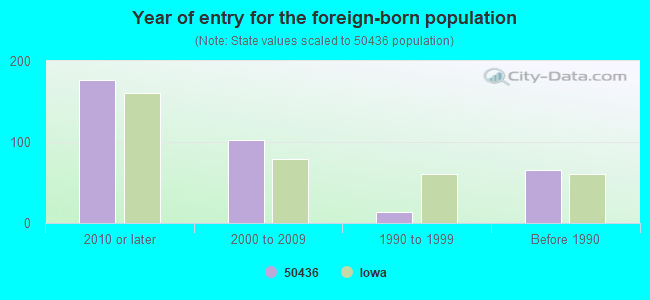
Year of entry for the foreign-born population
1772010 or later
1032000 to 2009
141990 to 1999
65Before 1990
Facilities with environmental interests located in this zip code:
3M DISTIBUTION CENTER (806 WEST CRYSTAL LAKE ROAD in FOREST CITY, IA)
HAZARDOUS WASTE BIENNIAL REPORTER (Resource Conservation and Recovery Act (tracking hazardous waste)) - ICIS-, ENFORCEMENT/COMPLIANCE ACTIVITY, Large Quantity Generators, more that 1000 kg of hazardous waste/month (Resource Conservation and Recovery Act (tracking hazardous waste)) - notification - ICIS-, ENFORCEMENT/COMPLIANCE ACTIVITY, Organizations: 3M COMPANY (CONTACT/OPERATOR)
, WINNEBAGO INDUSTRIES (CONTACT/OWNER)
Alternative names: 3M FOREST CITY DISTRIBUTION CENTER
CLARK (125 W K ST in FOREST CITY, IA)
(Resource Conservation and Recovery Act (tracking hazardous waste)) - ICIS-, ENFORCEMENT/COMPLIANCE ACTIVITY Alternative names: CHRYSLER OF FOREST CITY
HOLLAND CONTRACTING CORP (1400 S 4TH ST in FOREST CITY, IA)
AIR MINOR (AIRS/AFS) (Resource Conservation and Recovery Act (tracking hazardous waste)) Business SIC classification: READY-MIXED CONCRETE Organizations: CHARLES HOLLAND (CONTACT/OWNER)
CDI LLC (305 NOREM DRIVE in FOREST CITY, IA)
AIR MAJOR (AIRS/AFS) Large Quantity Generators, more that 1000 kg of hazardous waste/month (Resource Conservation and Recovery Act (tracking hazardous waste)) TRI REPORTER (Tracking of toxic chemicals releasing facilities) Business SIC classification: TOP, BODY, AND UPHOLSTERY REPAIR SHOPS AND PAINT SHOPS Business NAICS classification: AUTOMOTIVE BODY, PAINT, AND INTERIOR REPAIR AND MAINTENANCE. Organizations: JEFF SCHWARTZ AND JOHN BIBBO (CONTACT/OWNER)
NORTH CENTRAL HUMAN SERVICES (106 E PARK in FOREST CITY, IA)
(Resource Conservation and Recovery Act (tracking hazardous waste)) Business NAICS classification: ALL OTHER TRANSIT AND GROUND PASSENGER TRANSPORTATION.
BEST WAY CONCRETE CO (CRYSTAL LAKE RD in FOREST CITY, IA)
AIR MINOR (AIRS/AFS) Business SIC classification: NONCLASSIFIABLE ESTABLISHMENTS Alternative names: CLOSED FACILITY -- BEST WAY CONCRETE CO
CALVARY BAPTIST CHURCH & VACANT BLDG (WALNUT ST in FOREST CITY, IA)
(Resource Conservation and Recovery Act (tracking hazardous waste)) Business NAICS classification: RESIDENTIAL ELECTRIC LIGHTING FIXTURE MANUFACTURING.
NORTH CENTRAL SALES & SERVICE (16570 370TH STREET in FOREST CITY, IA)
COMPLIANCE ACTIVITY (Tracking inspections of insecticide, fungicide, and rodenticide, and toxic substances) Conditionally Exempt Small Quantity Generators, less than 100 kg/month of hazardous waste (Resource Conservation and Recovery Act (tracking hazardous waste))
3M COMPANY (906 WEST CRYSTAL ROAD in FOREST CITY, IA)
COMPLIANCE ACTIVITY (Tracking inspections of insecticide, fungicide, and rodenticide, and toxic substances)
3M COMPANY (806 CRYSTAL ROAD in FOREST CITY, IA)
COMPLIANCE ACTIVITY (Tracking inspections of insecticide, fungicide, and rodenticide, and toxic substances)
DALES BODY SHOP (.2 MI E OF HWY 69 ON 330TH ST, in FOREST CITY, IA)
Conditionally Exempt Small Quantity Generators, less than 100 kg/month of hazardous waste (Resource Conservation and Recovery Act (tracking hazardous waste)) Business NAICS classification: AUTOMOTIVE BODY, PAINT, AND INTERIOR REPAIR AND MAINTENANCE.
Housing units lacking complete plumbing facilities: 2.4% Housing units lacking complete kitchen facilities: 1.6%
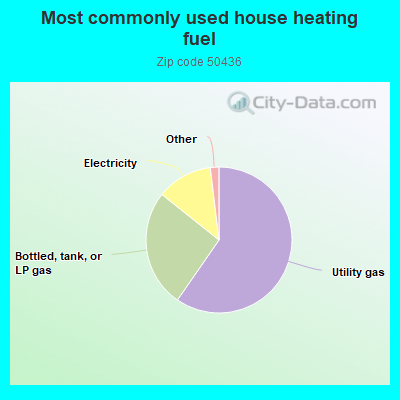
59.7%Utility gas
26.1%Bottled, tank, or LP gas
12.4%Electricity
0.9%Other fuel
0.5%Fuel oil, kerosene, etc.
Population in 1990: 6,010. Population change in the 1990s: +216 (+3.6%).
Place of birth for U.S.-born residents:
This state: 3,809
Northeast: 58
Midwest: 1,279
South: 242
West: 138
58% of the 50436 zip code residents lived in the same house 5 years ago. Out of people who lived in different houses, 42% lived in this county. Out of people who lived in different counties, 50% lived in Iowa.
88% of the 50436 zip code residents lived in the same house 1 year ago. Out of people who lived in different houses, 46% moved from this county. Out of people who lived in different houses, 7% moved from different county within same state. Out of people who lived in different houses, 44% moved from different state. Out of people who lived in different houses, 1% moved from abroad.
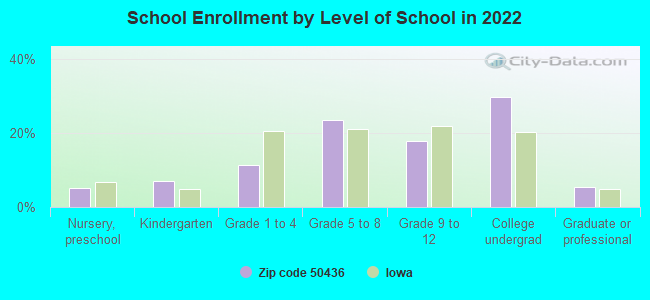
Private vs. public school enrollment:
Students in private schools in grades 1 to 8 (elementary and middle school): 50
Here:
8.2%
Iowa:
10.6%
Students in private schools in grades 9 to 12 (high school): 13
Here:
4.4%
Iowa:
7.9%
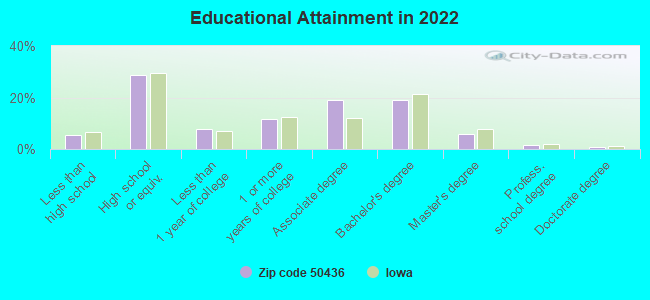
Students in private undergraduate colleges: 227
Here:
43.5%
Iowa:
23.9%
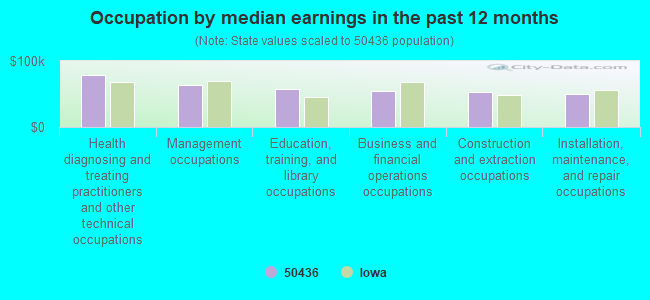
Occupation by median earnings in the past 12 months ($)
78,275Health diagnosing and treating practitioners and other technical occupations
63,292Management occupations
58,115Education, training, and library occupations
53,927Business and financial operations occupations
53,588Construction and extraction occupations
49,980Installation, maintenance, and repair occupations
Companies with federal contracts located in this zip code:
MAT LOGO, INC (36367 165TH AVE in FOREST CITY, IA; small business) : $21,888 in 4 contractsfrom 2003 to 2005
$9,430 with Navy for Floor Coverings. Signed on 2003-02-05. Completion date: 2003-02-28.
$5,279, same as above.Signed on 2005-04-04. Completion date: 2005-04-13.
$4,356 with Air Force for Miscellaneous Items. Signed on 2005-09-09. Completion date: 2005-10-06.
$2,823 with Army for Floor Coverings. Signed on 2004-03-03. Completion date: 2004-03-15.
Top industries in this zip code by the number of employees in 2005:
Other Services (except Public Administration): Civic and Social Organizations (50-99: 1, 5-9: 1)
Accommodation and Food Services: Limited-Service Restaurants (20-49: 2, 5-9: 1)
People in group quarters in 2010:
289 people in college/university student housing
94 people in nursing facilities/skilled-nursing facilities
6 people in local jails and other municipal confinement facilities
3 people in group homes intended for adults
People in group quarters in 2000:
287 people in college dormitories (includes college quarters off campus)
53 people in nursing homes
37 people in homes for the mentally retarded
5 people in homes for the mentally ill
4 people in local jails and other confinement facilities (including police lockups)
Fatal accident statistics in 2014:
Fatal accident count: 1
Vehicles involved in fatal accidents: 2
Fatal accidents caused by drunken drivers: 0
Fatalities: 2
Persons involved in fatal accidents: 3
Pedestrians involved in fatal accidents: 0
2002 - 2018 National Fire Incident Reporting System (NFIRS) incidents
Based on the data from the years 2002 - 2018 the average number of fire incidents per year is 21. The highest number of reported fires - 43 took place in 2003, and the least - 7 in 2017. The data has a declining trend.
When looking into fire subcategories, the most reports belonged to: Outside Fires (41.1%), and Structure Fires (36.4%).
Fire incident types reported to NFIRS in Zip Code 50436


 Nearest zip codes: 50453, 50432, 50438, 50478, 50473, 50423.


 Based on the data from the years 2002 - 2018 the average number of fire incidents per year is 21. The highest number of reported fires - 43 took place in 2003, and the least - 7 in 2017. The data has a declining trend.
 When looking into fire subcategories, the most reports belonged to: Outside Fires (41.1%), and Structure Fires (36.4%).