Estimated zip code population in 2022: 4,661 Zip code population in 2010: 4,412 Zip code population in 2000: 4,232
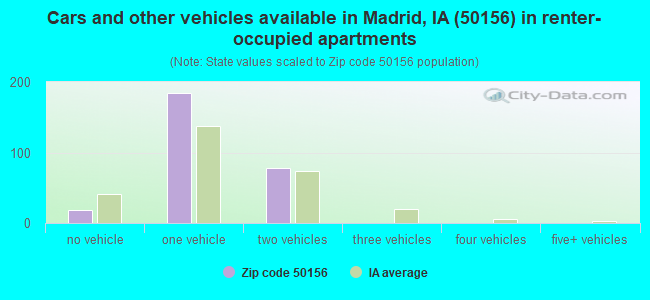
Houses and condos: 2,045 Renter-occupied apartments: 279
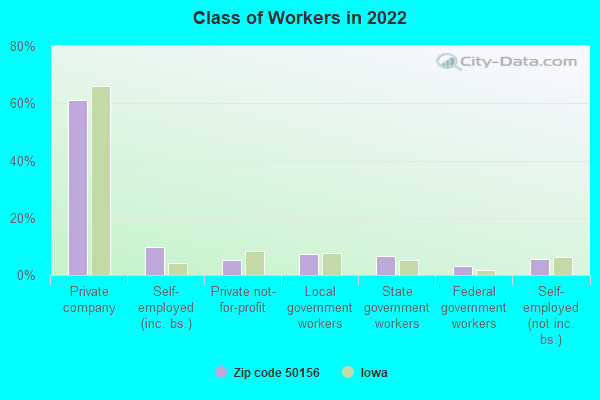
% of renters here:
14%
State:
28%
March 2022 cost of living index in zip code 50156: 83.2 (low, U.S. average is 100)
Land area: 89.7 sq. mi. Water area: 2.5 sq. mi.
Population density: 52 people per square mile
(very low).
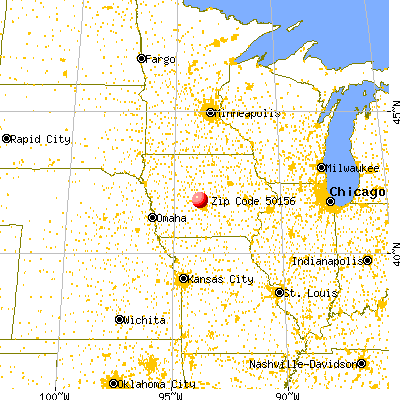
OSM Map
General Map
Google Map
MSN Map
OSM Map
General Map
Google Map
MSN Map
OSM Map
General Map
Google Map
MSN Map
OSM Map
General Map
Google Map
MSN Map
Please wait while loading the map...
Real estate property taxes paid for housing units in 2022:
This zip code:
1.3% ($2,955)
Iowa:
1.4% ($2,724)
Median real estate property taxes paid for housing units with mortgages in 2022: $3,311 (1.4%) Median real estate property taxes paid for housing units with no mortgage in 2022: $2,636 (1.3%)
Business Search- 14 Million verified businesses
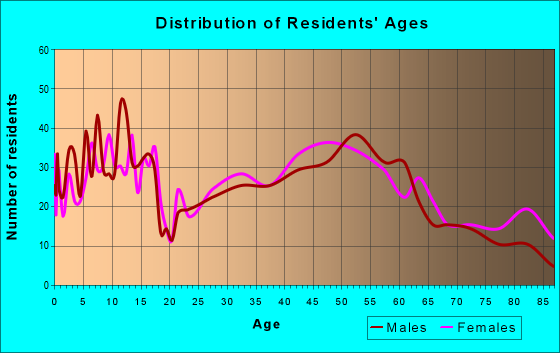
Males: 2,246
(48.2%)
Females: 2,413
(51.8%)
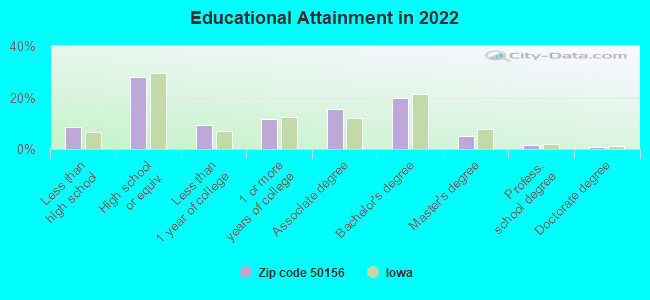
For population 25 years and over in 50156:
High school or higher: 91.0%
Bachelor's degree or higher: 27.2%
Graduate or professional degree: 7.6%
Unemployed: 0.5%
Mean travel time to work (commute): 26.0 minutes
For population 15 years and over in 50156:
Never married: 24.1%
Now married: 57.3%
Separated: 0.4%
Widowed: 6.9%
Divorced: 11.3%
Zip code 50156 compared to state average:
Unemployed percentage significantly below state average.
Black race population percentage significantly below state average.
Hispanic race population percentage below state average.
Median age significantly above state average.
Foreign-born population percentage significantly below state average.
Renting percentage below state average.
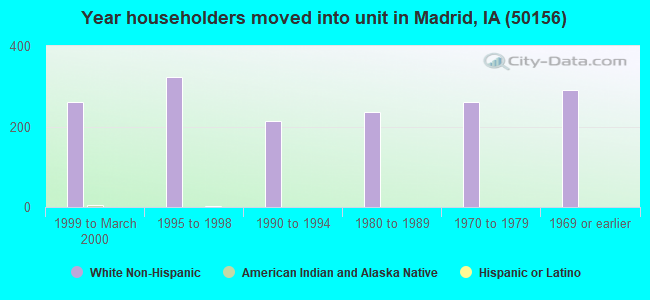
Length of stay since moving in significantly above state average.
Number of college students significantly below state average.
Estimated median house/condo value in 2022: $222,783
50156:
$222,783
Iowa:
$194,600
According to our research of Iowa and other state lists, there were 5 registered sex offenders living in 50156 zip code as of June 06, 2024. The ratio of all residents to sex offenders in zip code 50156 is 866 to 1. The ratio of registered sex offenders to all residents in this zip code is lower than the state average.
Median resident age:
This zip code:
47.2 years
Iowa median age:
38.9 years
Average household size:
This zip code:
2.3 people
Iowa:
2.3 people
Averages for the 2020 tax year for zip code 50156, filed in 2021:
Average Adjusted Gross Income (AGI) in 2020: $73,743 (Individual Income Tax Returns)
Here:
$73,743
State:
$71,087
Salary/wage: $62,526 (reported on 82.4% of returns)
Here:
$62,526
State:
$57,361
(% of AGI for various income ranges: 1177.9% for AGIs below $25k, 3395.4% for AGIs $25k-50k, 6109.3% for AGIs $50k-75k, 8550.5% for AGIs $75k-100k, 16858.8% for AGIs $100k-200k, 78830.0% for AGIs over 200k)
Taxable interest for individuals: $1,290 (reported on 38.0% of returns)
This zip code:
$1,290
Iowa:
$1,633
(% of AGI for various income ranges: 44.7% for AGIs below $25k, 31.5% for AGIs $25k-50k, 43.3% for AGIs $50k-75k, 119.0% for AGIs $75k-100k, 105.8% for AGIs $100k-200k, 705.0% for AGIs over 200k)
Ordinary dividends: $3,392 (reported on 22.7% of returns)
Here:
$3,392
State:
$5,432
(% of AGI for various income ranges: 32.4% for AGIs below $25k, 34.1% for AGIs $25k-50k, 79.3% for AGIs $50k-75k, 157.6% for AGIs $75k-100k, 214.2% for AGIs $100k-200k, 1585.0% for AGIs over 200k)
Net capital gain/loss in AGI: +$13,246 (reported on 19.0% of returns)
Here:
+$13,246
State:
+$15,243
(% of AGI for various income ranges: 19.4% for AGIs below $25k, 23.8% for AGIs $25k-50k, 103.3% for AGIs $50k-75k, 190.5% for AGIs $75k-100k, 471.2% for AGIs $100k-200k, 16840.0% for AGIs over 200k)
Profit/loss from business: +$8,760 (reported on 13.9% of returns)
Here:
+$8,760
State:
+$11,763
(% of AGI for various income ranges: 90.6% for AGIs below $25k, 144.6% for AGIs $25k-50k, 110.4% for AGIs $50k-75k, 281.9% for AGIs $75k-100k, 333.1% for AGIs $100k-200k)
Taxable individual retirement arrangement distribution: $16,293 (reported on 12.5% of returns)
50156:
$16,293
Iowa:
$17,324
(% of AGI for various income ranges: 75.9% for AGIs below $25k, 165.4% for AGIs $25k-50k, 187.8% for AGIs $50k-75k, 371.0% for AGIs $75k-100k, 850.0% for AGIs $100k-200k)
Total itemized deductions: $28,700 (reported on 10.2% of returns)
Here:
$28,700
State:
$33,775
(% of AGI for various income ranges: 222.3% for AGIs $25k-50k, 340.0% for AGIs $50k-75k, 456.2% for AGIs $75k-100k, 793.5% for AGIs $100k-200k, 7540.0% for AGIs over 200k)
Charity contributions: $8,809 (reported on 5.1% of returns)
Here:
$8,809
State:
$13,075
(% of AGI for various income ranges: 48.9% for AGIs $50k-75k, 89.2% for AGIs $100k-200k, 3025.0% for AGIs over 200k)
Taxes paid: $7,500 (reported on 6.5% of returns)
50156:
$7,500
State:
$7,704
(% of AGI for various income ranges: 54.1% for AGIs $25k-50k, 79.5% for AGIs $75k-100k, 158.5% for AGIs $100k-200k, 1300.0% for AGIs over 200k)
Earned income credit: $2,076 (reported on 7.9% of returns)
Here:
$2,076
State:
$2,195
(% of AGI for various income ranges: 53.5% for AGIs below $25k, 43.8% for AGIs $25k-50k)
Percentage of individuals using paid preparers for their 2020 taxes: 94.4%
Here:
94%
State:
95%
(% for various income ranges: 92.0% for AGIs below $25k, 94.1% for AGIs $25k-50k, 94.4% for AGIs $50k-75k, 96.6% for AGIs $75k-100k, 97.6% for AGIs $100k-200k, 87.5% for AGIs over 200k)
Averages for the 2012 tax year for zip code 50156, filed in 2013:
Average Adjusted Gross Income (AGI) in 2012: $60,224 (Individual Income Tax Returns)
Here:
$60,224
State:
$58,860
Salary/wage: $53,050 (reported on 84.1% of returns)
Here:
$53,050
State:
$46,659
(% of AGI for various income ranges: 66.5% for AGIs below $25k, 75.3% for AGIs $25k-50k, 75.3% for AGIs $50k-75k, 80.8% for AGIs $75k-100k, 79.0% for AGIs $100k-200k, 52.5% for AGIs over 200k)
Taxable interest for individuals: $1,228 (reported on 40.8% of returns)
This zip code:
$1,228
Iowa:
$1,537
(% of AGI for various income ranges: 3.2% for AGIs below $25k, 1.1% for AGIs $25k-50k, 0.6% for AGIs $50k-75k, 0.4% for AGIs $75k-100k, 0.6% for AGIs $100k-200k, 0.8% for AGIs over 200k)
Ordinary dividends: $4,336 (reported on 22.4% of returns)
Here:
$4,336
State:
$4,542
(% of AGI for various income ranges: 1.8% for AGIs below $25k, 0.9% for AGIs $25k-50k, 1.1% for AGIs $50k-75k, 1.3% for AGIs $75k-100k, 3.2% for AGIs $100k-200k)
Net capital gain/loss in AGI: +$6,207 (reported on 13.9% of returns)
Here:
+$6,207
State:
+$11,802
(% of AGI for various income ranges: 0.5% for AGIs $25k-50k, 5.0% for AGIs $100k-200k)
Profit/loss from business: +$7,385 (reported on 16.4% of returns)
Here:
+$7,385
State:
+$10,509
(% of AGI for various income ranges: 7.3% for AGIs below $25k, 2.7% for AGIs $25k-50k, 2.3% for AGIs $50k-75k, 1.1% for AGIs $75k-100k, 1.9% for AGIs $100k-200k)
Taxable individual retirement arrangement distribution: $8,600 (reported on 10.9% of returns)
50156:
$8,600
Iowa:
$11,773
(% of AGI for various income ranges: 3.9% for AGIs below $25k, 2.0% for AGIs $25k-50k, 1.8% for AGIs $50k-75k, 0.9% for AGIs $75k-100k, 1.8% for AGIs $100k-200k)
Total itemized deductions: $18,892 (20% of AGI, reported on 37.8% of returns)
Here:
$18,892
State:
$21,278
Here:
20.1% of AGI
State:
18.9% of AGI
(% of AGI for various income ranges: 14.1% for AGIs below $25k, 9.6% for AGIs $25k-50k, 11.3% for AGIs $50k-75k, 11.7% for AGIs $75k-100k, 12.9% for AGIs $100k-200k, 12.3% for AGIs over 200k)
Charity contributions: $2,691 (reported on 28.9% of returns)
Here:
$2,691
State:
$4,044
(% of AGI for various income ranges: 1.1% for AGIs below $25k, 0.9% for AGIs $25k-50k, 1.0% for AGIs $50k-75k, 1.1% for AGIs $75k-100k, 1.6% for AGIs $100k-200k, 2.0% for AGIs over 200k)
Taxes paid: $7,377 (reported on 37.3% of returns)
50156:
$7,377
State:
$8,846
(% of AGI for various income ranges: 2.0% for AGIs below $25k, 2.7% for AGIs $25k-50k, 3.9% for AGIs $50k-75k, 4.6% for AGIs $75k-100k, 6.4% for AGIs $100k-200k, 5.1% for AGIs over 200k)
Earned income credit: $2,009 (reported on 10.9% of returns)
Here:
$2,009
State:
$2,098
(% of AGI for various income ranges: 4.1% for AGIs below $25k, 0.8% for AGIs $25k-50k)
Percentage of individuals using paid preparers for their 2012 taxes: 62.2%
Here:
62%
State:
65%
(% for various income ranges: 54.4% for AGIs below $25k, 55.8% for AGIs $25k-50k, 71.4% for AGIs $50k-75k, 65.4% for AGIs $75k-100k, 70.4% for AGIs $100k-200k, 100.0% for AGIs over 200k)
Averages for the 2004 tax year for zip code 50156, filed in 2005:
Average Adjusted Gross Income (AGI) in 2004: $44,573 (Individual Income Tax Returns)
Here:
$44,573
State:
$43,875
Salary/wage: $42,592 (reported on 85.2% of returns)
Here:
$42,592
State:
$38,265
(% of AGI for various income ranges: 122.2% for AGIs below $10k, 63.3% for AGIs $10k-25k, 80.0% for AGIs $25k-50k, 84.2% for AGIs $50k-75k, 88.4% for AGIs $75k-100k, 74.9% for AGIs over 100k)
Taxable interest for individuals: $1,367 (reported on 58.0% of returns)
This zip code:
$1,367
Iowa:
$1,768
(% of AGI for various income ranges: 8.5% for AGIs below $10k, 4.9% for AGIs $10k-25k, 1.8% for AGIs $25k-50k, 1.3% for AGIs $50k-75k, 1.0% for AGIs $75k-100k, 1.7% for AGIs over 100k)
Taxable dividends: $1,800 (reported on 26.5% of returns)
Here:
$1,800
State:
$2,510
(% of AGI for various income ranges: 3.2% for AGIs below $10k, 1.4% for AGIs $10k-25k, 0.9% for AGIs $25k-50k, 0.6% for AGIs $50k-75k, 0.6% for AGIs $75k-100k, 2.1% for AGIs over 100k)
Net capital gain/loss: +$2,808 (reported on 18.6% of returns)
Here:
+$2,808
State:
+$6,139
(% of AGI for various income ranges: -3.5% for AGIs below $10k, -0.5% for AGIs $10k-25k, 1.0% for AGIs $25k-50k, 1.0% for AGIs $50k-75k, 1.2% for AGIs $75k-100k, 2.6% for AGIs over 100k)
Profit/loss from business: +$6,845 (reported on 16.8% of returns)
Here:
+$6,845
State:
+$8,574
(% of AGI for various income ranges: 7.6% for AGIs below $10k, 5.2% for AGIs $10k-25k, 2.7% for AGIs $25k-50k, 1.9% for AGIs $50k-75k, 2.8% for AGIs $75k-100k, 1.9% for AGIs over 100k)
IRA payment deduction: $2,604 (reported on 2.6% of returns)
50156:
$2,604
Iowa:
$2,970
Self-employed pension: $4,273 (reported on 0.6% of returns)
Here:
$4,273
Iowa:
$11,928
Total itemized deductions: $15,476 (22% of AGI, reported on 35.4% of returns)
Here:
$15,476
State:
$16,976
Here:
22.0% of AGI
State:
20.8% of AGI
(% of AGI for various income ranges: 16.8% for AGIs below $10k, 11.3% for AGIs $10k-25k, 10.1% for AGIs $25k-50k, 10.6% for AGIs $50k-75k, 14.5% for AGIs $75k-100k, 14.8% for AGIs over 100k)
Charity contributions deductions: $2,130 (3% of AGI, reported on 29.9% of returns)
Here:
$2,130
State:
$3,089
Here:
2.9% of AGI
State:
3.6% of AGI
(% of AGI for various income ranges: 0.7% for AGIs below $10k, 0.8% for AGIs $10k-25k, 0.8% for AGIs $25k-50k, 1.0% for AGIs $50k-75k, 1.6% for AGIs $75k-100k, 2.8% for AGIs over 100k)
Total tax: $5,097 (reported on 81.9% of returns)
50156:
$5,097
State:
$6,177
(% of AGI for various income ranges: 3.1% for AGIs below $10k, 4.4% for AGIs $10k-25k, 7.0% for AGIs $25k-50k, 8.1% for AGIs $50k-75k, 9.8% for AGIs $75k-100k, 15.9% for AGIs over 100k)
Earned income credit: $1,566 (reported on 8.2% of returns)
Here:
$1,566
State:
$1,540
Percentage of individuals using paid preparers for their 2004 taxes: 64.6%
Here:
65%
State:
70%
(% for various income ranges: 50.2% for AGIs below $10k, 61.5% for AGIs $10k-25k, 68.6% for AGIs $25k-50k, 70.9% for AGIs $50k-75k, 68.7% for AGIs $75k-100k, 67.6% for AGIs over 100k)
Household received Food Stamps/SNAP in the past 12 months: 45 Household did not receive Food Stamps/SNAP in the past 12 months: 1,928
Women who had a birth in the past 12 months: 49 (17 now married, 30 unmarried) Women who did not have a birth in the past 12 months: 810 (369 now married, 441 unmarried)
Housing units in zip code 50156 with a mortgage: 993 (148 second mortgage, 133 both second mortgage and home equity loan) Median monthly owner costs for units with a mortgage: $1,602 Median monthly owner costs for units without a mortgage: $664
Residents with income below the poverty level in 2022:
This zip code:
9.4%
Whole state:
11.0%
Residents with income below 50% of the poverty level in 2022:
This zip code:
1.1%
Whole state:
5.5%
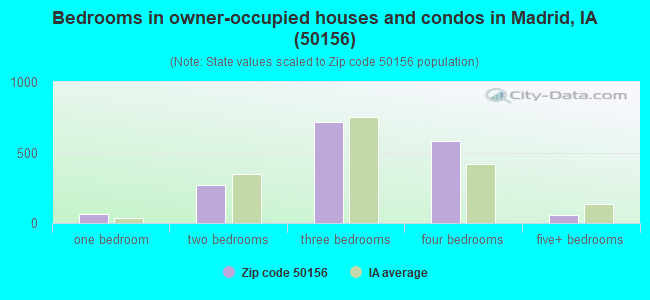
Median number of rooms in houses and condos:
Here:
6.7
State:
6.8
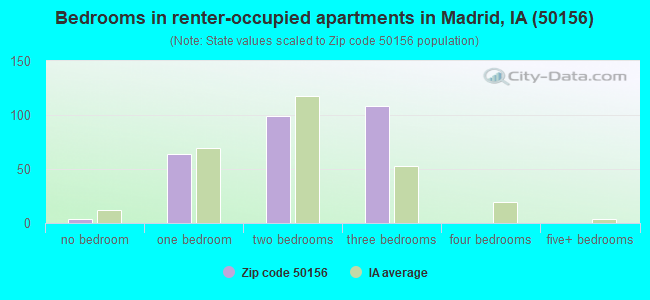
Median number of rooms in apartments:
Here:
4.5
State:
4.2
Notable locations in this zip code not listed on our city pages
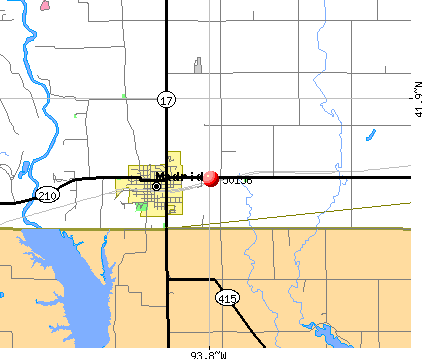
Notable locations in zip code 50156: Snyder Bridge (A), Garden Prairie (B), Camp Laurie (C), Zook Spur (D), Iowa State Experimental Farm (E), High Bridge (F), Madrid (G), Heartland Co-op Elevator (H), Clay Castle Museum (I), Madrid Public Library (J), Madrid Police Department (K), Madrid Fire Department (L). Display/hide their locations on the map
Churches in zip code 50156 include: Church of God Prophecy (A), Saint Paul United Church of Christ (B), Saint Johns Lutheran Church (C), Church of God (D), Church of Christ (E), Eternal Life Church (F), Garden Prairie Church (G), Hopkins Grove Church (H). Display/hide their locations on the map
Cemeteries: Garden Prairie Cemetery (1), James Gildea Cemetery (2), Cassel Cemetery (3), Dalander Cemetery (4), Fairview Cemetery (5), Hillsdale Cemetery (6), Hull Cemetery (7). Display/hide their locations on the map
Streams, rivers, and creeks: Bear Creek (A), Richardson Branch (B), Prairie Creek (C), Peas Creek (D), Murphy Branch (E). Display/hide their locations on the map
Parks in zip code 50156 include: Swede Point Park (1), Long Refuge (2), Iowa Arboretum (3), Edgewood Park (4), McCoy Wildlife Area (5), Worth State Game Farm (6), Ledges State Park (7). Display/hide their locations on the map
In group quarters: 86 (-1 institutionalized population)
Size of family households: 737 2-persons, 262 3-persons, 217 4-persons, 97 5-persons, 17 6-persons, 15 7-or-more-persons
Size of nonfamily households: 494 1-person, 97 2-persons, 18 3-persons
477 married couples with children.
202 single-parent households (76 men, 126 women).
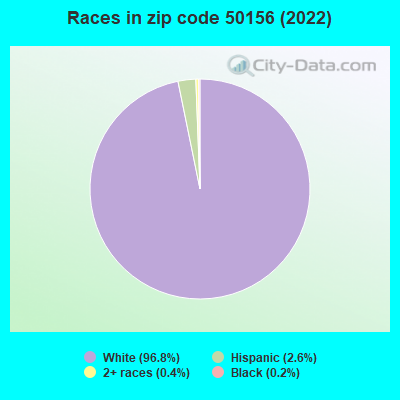
96.8% of residents of 50156 zip code speak English at home.
2.1% of residents speak Spanish at home (100% very well).
1.1% of residents speak other Indo-European language at home (100% very well).
Foreign born population: 6 (0.1%) (100.0% of them are naturalized citizens)
This zip code:
0.1%
Whole state:
6.0%
83%Barbados
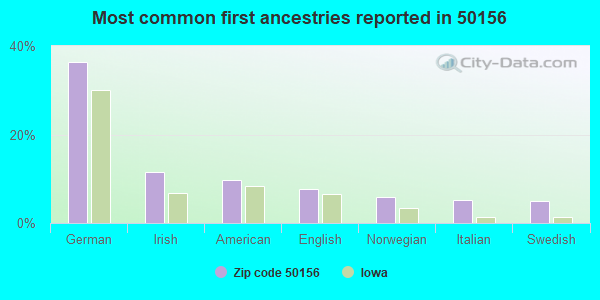
36%German
12%Irish
10%American
8%English
6%Norwegian
5%Italian
5%Swedish
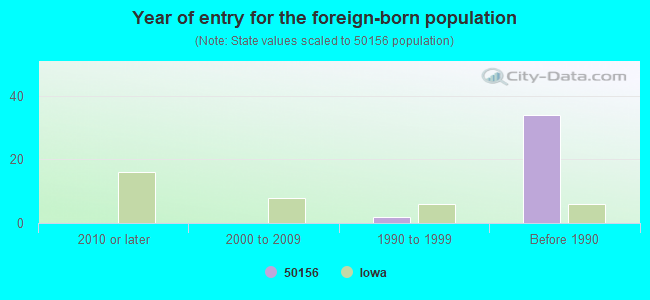
Year of entry for the foreign-born population
02010 or later
02000 to 2009
21990 to 1999
34Before 1990
Facilities with environmental interests located in this zip code:
DNR LEDGES STATE PARK (1519 250TH ST in MADRID, IA)
National Pollutant Discharge Elimination System NON-MAJOR (Tracking pollutant discharge elimination systems) - permit Business SIC classification: AMUSEMENT AND RECREATION SERVICES
AUTO SHOP-FORMER SITE OF (117 S WATER ST in MADRID, IA)
(Resource Conservation and Recovery Act (tracking hazardous waste)) Business NAICS classification: AUTOMOTIVE BODY, PAINT, AND INTERIOR REPAIR AND MAINTENANCE.
CONTINENTAL LABORATORIES (912 S STATE STREET in MADRID, IA)
Conditionally Exempt Small Quantity Generators, less than 100 kg/month of hazardous waste (Resource Conservation and Recovery Act (tracking hazardous waste)) Organizations: RON PONTOLILO (CONTACT/OPERATOR)
, JERRY MILLER (CONTACT/OWNER)
BOONE COUNTY MAINTENANCE SHED (303 S GREEN ST in MADRID, IA)
Conditionally Exempt Small Quantity Generators, less than 100 kg/month of hazardous waste (Resource Conservation and Recovery Act (tracking hazardous waste)) Business NAICS classification: AIR TRAFFIC CONTROL.
SIMMONS OIL INC (625 S KENNEDY AVE in MADRID, IA)
Conditionally Exempt Small Quantity Generators, less than 100 kg/month of hazardous waste (Resource Conservation and Recovery Act (tracking hazardous waste)) Business NAICS classification: GENERAL AUTOMOTIVE REPAIR.
VAN WALL SVCTR (JD) (1872 330TH ST in MADRID, IA)
Small Quantity Generators, between 100 kg and 1000 kg of hazardous waste/month (Resource Conservation and Recovery Act (tracking hazardous waste))
Housing units lacking complete plumbing facilities: 0.5% Housing units lacking complete kitchen facilities: 3.0%
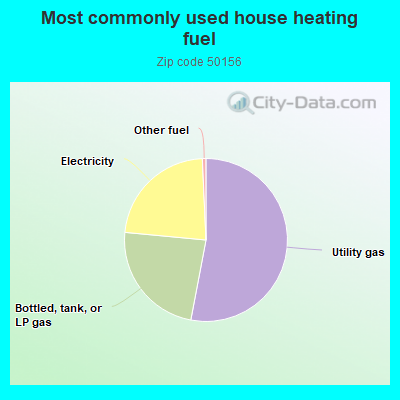
53.0%Utility gas
23.5%Bottled, tank, or LP gas
22.8%Electricity
0.7%Other fuel
Population in 1990: 4,367.
Place of birth for U.S.-born residents:
This state: 3,976
Northeast: 47
Midwest: 256
South: 197
West: 142
67% of the 50156 zip code residents lived in the same house 5 years ago. Out of people who lived in different houses, 35% lived in this county. Out of people who lived in different counties, 50% lived in Iowa.
93% of the 50156 zip code residents lived in the same house 1 year ago. Out of people who lived in different houses, 23% moved from this county. Out of people who lived in different houses, 70% moved from different county within same state. Out of people who lived in different houses, 11% moved from different state.
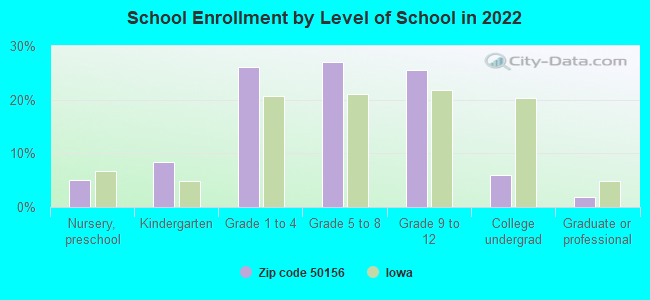
Private vs. public school enrollment:
Students in private schools in grades 1 to 8 (elementary and middle school): 40
Here:
10.4%
Iowa:
10.6%
Students in private schools in grades 9 to 12 (high school):
Here:
0.0%
Iowa:
7.9%
Students in private undergraduate colleges:
Here:
0.0%
Iowa:
23.9%
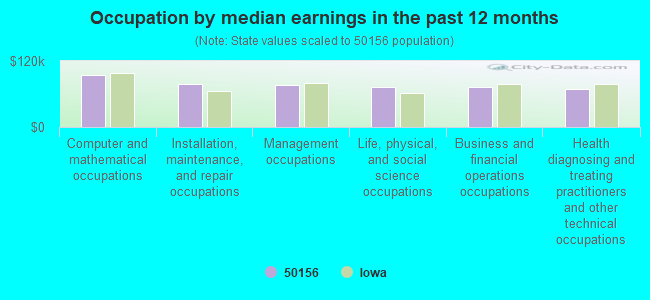
Occupation by median earnings in the past 12 months ($)
93,952Computer and mathematical occupations
79,069Installation, maintenance, and repair occupations
75,681Management occupations
73,359Life, physical, and social science occupations
73,117Business and financial operations occupations
68,446Health diagnosing and treating practitioners and other technical occupations
Companies with federal contracts located in this zip code:
MID-WEST TECH (206 W 2ND ST in MADRID, IA; small business) : $34,135 in 2 contractsin 2005
$24,965 with Army for Miscellaneous Machine Tools. Signed on 2005-04-13. Completion date: 2005-05-12.
$9,170 with Army for ADP Software. Signed on 2005-04-13. Completion date: 2005-05-13.
Top industries in this zip code by the number of employees in 2005:
Health Care and Social Assistance: Nursing Care Facilities (100-249 employees: 1 establishment)
Other Services (except Public Administration): Religious Organizations (5-9: 2, 1-4: 3)
Finance and Insurance: Savings Institutions (10-19: 1)
Administrative and Support and Waste Management and Remediation Services: Landscaping Services (10-19: 1)
Wholesale Trade: Farm and Garden Machinery and Equipment Merchant Wholesalers (10-19: 1)
Accommodation and Food Services: Limited-Service Restaurants (10-19: 1)
Finance and Insurance: Commercial Banking (10-19: 1)
People in group quarters in 2010:
106 people in nursing facilities/skilled-nursing facilities
People in group quarters in 2000:
154 people in nursing homes
Fatal accident statistics in 2014:
Fatal accident count: 1
Vehicles involved in fatal accidents: 1
Fatal accidents caused by drunken drivers: 0
Fatalities: 1
Persons involved in fatal accidents: 1
Pedestrians involved in fatal accidents: 0
Fatal accident statistics in 2013:
Fatal accident count: 1
Vehicles involved in fatal accidents: 1
Fatal accidents caused by drunken drivers: 0
Fatalities: 1
Persons involved in fatal accidents: 1
Pedestrians involved in fatal accidents: 0
Home Mortgage Disclosure Act Aggregated Statistics For Year 2009 (Based on 2 partial tracts)
A) FHA, FSA/RHS & VA Home Purchase Loans
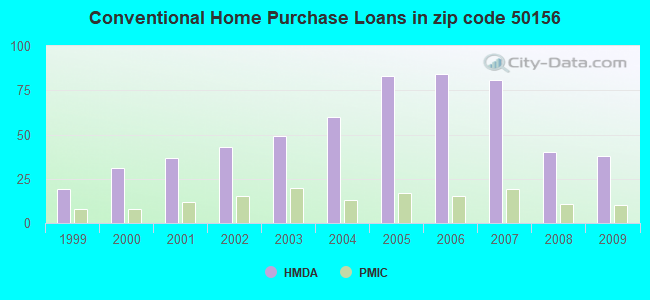
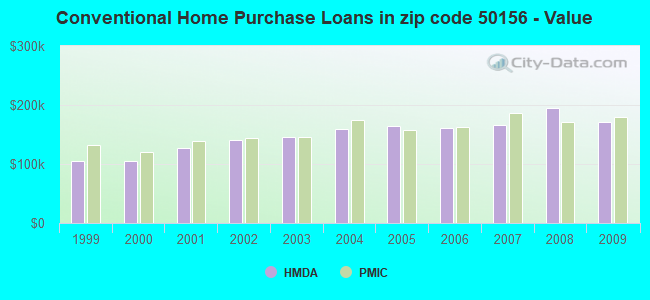
B) Conventional Home Purchase Loans
C) Refinancings
D) Home Improvement Loans
F) Non-occupant Loans on < 5 Family Dwellings (A B C & D)
Number
Average Value
Number
Average Value
Number
Average Value
Number
Average Value
Number
Average Value
LOANS ORIGINATED
25
$175,396
38
$170,534
177
$192,772
5
$38,130
2
$142,985
APPLICATIONS APPROVED, NOT ACCEPTED
0
$0
3
$109,213
15
$167,891
1
$31,390
1
$18,270
APPLICATIONS DENIED
3
$178,470
5
$190,534
26
$199,231
4
$45,950
1
$31,960
APPLICATIONS WITHDRAWN
2
$172,380
5
$159,938
25
$218,456
1
$102,740
0
$0
FILES CLOSED FOR INCOMPLETENESS
2
$154,685
0
$0
4
$231,888
0
$0
0
$0
Aggregated Statistics For Year 2008 (Based on 2 partial tracts)
A) FHA, FSA/RHS & VA Home Purchase Loans
B) Conventional Home Purchase Loans
C) Refinancings
D) Home Improvement Loans
E) Loans on Dwellings For 5+ Families
F) Non-occupant Loans on < 5 Family Dwellings (A B C & D)
G) Loans On Manufactured Home Dwelling (A B C & D)
Number
Average Value
Number
Average Value
Number
Average Value
Number
Average Value
Number
Average Value
Number
Average Value
Number
Average Value
LOANS ORIGINATED
10
$195,042
40
$194,700
82
$193,125
12
$37,292
1
$460,060
6
$123,863
1
$51,940
APPLICATIONS APPROVED, NOT ACCEPTED
1
$81,620
7
$121,254
11
$202,011
2
$44,235
0
$0
1
$34,250
1
$24,540
APPLICATIONS DENIED
3
$143,080
7
$133,730
34
$183,898
7
$63,033
0
$0
2
$85,335
1
$50,800
APPLICATIONS WITHDRAWN
1
$105,600
6
$171,715
17
$212,136
2
$60,505
0
$0
1
$61,650
0
$0
FILES CLOSED FOR INCOMPLETENESS
1
$67,350
0
$0
4
$222,612
1
$17,120
0
$0
0
$0
0
$0
Aggregated Statistics For Year 2007 (Based on 2 partial tracts)
A) FHA, FSA/RHS & VA Home Purchase Loans
B) Conventional Home Purchase Loans
C) Refinancings
D) Home Improvement Loans
E) Loans on Dwellings For 5+ Families
F) Non-occupant Loans on < 5 Family Dwellings (A B C & D)
G) Loans On Manufactured Home Dwelling (A B C & D)
Number
Average Value
Number
Average Value
Number
Average Value
Number
Average Value
Number
Average Value
Number
Average Value
Number
Average Value
LOANS ORIGINATED
2
$157,825
81
$165,990
77
$153,553
12
$42,525
1
$1,509,200
9
$136,802
1
$5,710
APPLICATIONS APPROVED, NOT ACCEPTED
0
$0
5
$128,088
11
$172,330
3
$18,837
0
$0
0
$0
0
$0
APPLICATIONS DENIED
1
$219,190
8
$196,498
31
$191,918
7
$41,913
0
$0
1
$73,630
1
$14,270
APPLICATIONS WITHDRAWN
1
$70,780
6
$197,212
12
$203,966
0
$0
0
$0
0
$0
0
$0
FILES CLOSED FOR INCOMPLETENESS
0
$0
5
$290,538
6
$196,260
1
$82,200
0
$0
1
$61,080
0
$0
Aggregated Statistics For Year 2006 (Based on 2 partial tracts)
A) FHA, FSA/RHS & VA Home Purchase Loans
B) Conventional Home Purchase Loans
C) Refinancings
D) Home Improvement Loans
F) Non-occupant Loans on < 5 Family Dwellings (A B C & D)
G) Loans On Manufactured Home Dwelling (A B C & D)
Number
Average Value
Number
Average Value
Number
Average Value
Number
Average Value
Number
Average Value
Number
Average Value
LOANS ORIGINATED
4
$117,300
84
$160,374
78
$152,945
19
$32,626
5
$83,336
0
$0
APPLICATIONS APPROVED, NOT ACCEPTED
0
$0
10
$113,760
11
$120,595
3
$50,610
1
$17,690
0
$0
APPLICATIONS DENIED
0
$0
11
$206,059
28
$135,219
8
$22,761
0
$0
1
$31,960
APPLICATIONS WITHDRAWN
1
$170,100
8
$178,589
14
$166,470
0
$0
0
$0
0
$0
FILES CLOSED FOR INCOMPLETENESS
0
$0
6
$124,815
15
$195,404
0
$0
0
$0
1
$43,380
Aggregated Statistics For Year 2005 (Based on 2 partial tracts)
A) FHA, FSA/RHS & VA Home Purchase Loans
B) Conventional Home Purchase Loans
C) Refinancings
D) Home Improvement Loans
F) Non-occupant Loans on < 5 Family Dwellings (A B C & D)
G) Loans On Manufactured Home Dwelling (A B C & D)
Number
Average Value
Number
Average Value
Number
Average Value
Number
Average Value
Number
Average Value
Number
Average Value
LOANS ORIGINATED
3
$135,850
83
$165,030
93
$145,959
15
$47,795
5
$132,312
1
$101,600
APPLICATIONS APPROVED, NOT ACCEPTED
0
$0
9
$167,308
10
$90,757
1
$13,130
0
$0
1
$31,390
APPLICATIONS DENIED
1
$85,050
10
$197,268
24
$153,997
5
$47,604
1
$99,890
0
$0
APPLICATIONS WITHDRAWN
0
$0
10
$149,892
19
$141,228
1
$61,080
1
$117,580
0
$0
FILES CLOSED FOR INCOMPLETENESS
0
$0
4
$170,528
14
$165,736
0
$0
0
$0
0
$0
Aggregated Statistics For Year 2004 (Based on 2 partial tracts)
A) FHA, FSA/RHS & VA Home Purchase Loans
B) Conventional Home Purchase Loans
C) Refinancings
D) Home Improvement Loans
F) Non-occupant Loans on < 5 Family Dwellings (A B C & D)
G) Loans On Manufactured Home Dwelling (A B C & D)
Number
Average Value
Number
Average Value
Number
Average Value
Number
Average Value
Number
Average Value
Number
Average Value
LOANS ORIGINATED
3
$136,993
60
$158,835
86
$127,541
20
$47,490
3
$118,727
1
$47,950
APPLICATIONS APPROVED, NOT ACCEPTED
0
$0
7
$184,206
16
$170,634
2
$47,660
1
$47,950
1
$47,950
APPLICATIONS DENIED
0
$0
5
$120,324
34
$127,053
7
$24,544
0
$0
0
$0
APPLICATIONS WITHDRAWN
0
$0
3
$120,250
22
$148,797
3
$59,933
1
$75,920
0
$0
FILES CLOSED FOR INCOMPLETENESS
1
$62,220
3
$84,860
9
$131,221
2
$16,840
0
$0
0
$0
Aggregated Statistics For Year 2003 (Based on 2 partial tracts)
A) FHA, FSA/RHS & VA Home Purchase Loans
B) Conventional Home Purchase Loans
C) Refinancings
D) Home Improvement Loans
F) Non-occupant Loans on < 5 Family Dwellings (A B C & D)
Number
Average Value
Number
Average Value
Number
Average Value
Number
Average Value
Number
Average Value
LOANS ORIGINATED
10
$129,229
49
$145,076
191
$141,047
9
$22,959
6
$243,922
APPLICATIONS APPROVED, NOT ACCEPTED
0
$0
5
$144,412
19
$168,476
3
$40,147
0
$0
APPLICATIONS DENIED
1
$85,050
6
$157,827
36
$132,061
6
$14,840
2
$44,520
APPLICATIONS WITHDRAWN
0
$0
6
$170,765
27
$132,362
0
$0
0
$0
FILES CLOSED FOR INCOMPLETENESS
1
$172,380
1
$135,850
7
$163,820
0
$0
0
$0
Aggregated Statistics For Year 2002 (Based on 2 partial tracts)
A) FHA, FSA/RHS & VA Home Purchase Loans
B) Conventional Home Purchase Loans
C) Refinancings
D) Home Improvement Loans
E) Loans on Dwellings For 5+ Families
F) Non-occupant Loans on < 5 Family Dwellings (A B C & D)
Number
Average Value
Number
Average Value
Number
Average Value
Number
Average Value
Number
Average Value
Number
Average Value
LOANS ORIGINATED
2
$133,280
43
$140,921
111
$142,623
14
$21,854
1
$6,850
5
$79,570
APPLICATIONS APPROVED, NOT ACCEPTED
0
$0
5
$141,672
10
$140,588
2
$15,125
0
$0
0
$0
APPLICATIONS DENIED
0
$0
9
$84,034
23
$115,873
3
$19,217
0
$0
1
$26,830
APPLICATIONS WITHDRAWN
0
$0
3
$116,063
15
$121,543
1
$17,120
0
$0
0
$0
FILES CLOSED FOR INCOMPLETENESS
0
$0
2
$114,730
5
$116,672
1
$11,420
0
$0
0
$0
Aggregated Statistics For Year 2001 (Based on 2 partial tracts)
A) FHA, FSA/RHS & VA Home Purchase Loans
B) Conventional Home Purchase Loans
C) Refinancings
D) Home Improvement Loans
F) Non-occupant Loans on < 5 Family Dwellings (A B C & D)
Number
Average Value
Number
Average Value
Number
Average Value
Number
Average Value
Number
Average Value
LOANS ORIGINATED
7
$109,023
37
$127,412
96
$117,912
18
$14,587
4
$75,488
APPLICATIONS APPROVED, NOT ACCEPTED
0
$0
3
$160,777
6
$105,217
2
$9,990
0
$0
APPLICATIONS DENIED
1
$57,650
3
$96,083
22
$86,035
2
$10,560
1
$121,010
APPLICATIONS WITHDRAWN
0
$0
1
$119,870
15
$104,837
2
$27,685
1
$105,030
FILES CLOSED FOR INCOMPLETENESS
1
$62,790
3
$73,443
5
$131,398
1
$14,840
1
$95,890
Aggregated Statistics For Year 2000 (Based on 2 partial tracts)
A) FHA, FSA/RHS & VA Home Purchase Loans
B) Conventional Home Purchase Loans
C) Refinancings
D) Home Improvement Loans
F) Non-occupant Loans on < 5 Family Dwellings (A B C & D)
Number
Average Value
Number
Average Value
Number
Average Value
Number
Average Value
Number
Average Value
LOANS ORIGINATED
5
$101,146
31
$105,487
29
$93,513
11
$20,030
2
$78,200
APPLICATIONS APPROVED, NOT ACCEPTED
0
$0
5
$92,812
10
$61,818
3
$21,500
0
$0
APPLICATIONS DENIED
0
$0
5
$41,554
13
$54,885
3
$19,597
0
$0
APPLICATIONS WITHDRAWN
0
$0
3
$156,590
4
$99,035
0
$0
0
$0
FILES CLOSED FOR INCOMPLETENESS
0
$0
1
$153,550
3
$146,507
0
$0
0
$0
Aggregated Statistics For Year 1999 (Based on 1 partial tract)
A) FHA, FSA/RHS & VA Home Purchase Loans
B) Conventional Home Purchase Loans
C) Refinancings
D) Home Improvement Loans
F) Non-occupant Loans on < 5 Family Dwellings (A B C & D)
Detailed PMIC statistics for the following Tracts:0115.00
2003 - 2018 National Fire Incident Reporting System (NFIRS) incidents
Based on the data from the years 2003 - 2018 the average number of fires per year is 12. The highest number of fire incidents - 31 took place in 2004, and the least - 0 in 2006. The data has a dropping trend.
When looking into fire subcategories, the most incidents belonged to: Outside Fires (49.7%), and Structure Fires (30.3%).
Fire incident types reported to NFIRS in Zip Code 50156


 Nearest zip codes: 50243, 50109, 50276, 50134, 50226, 50244.
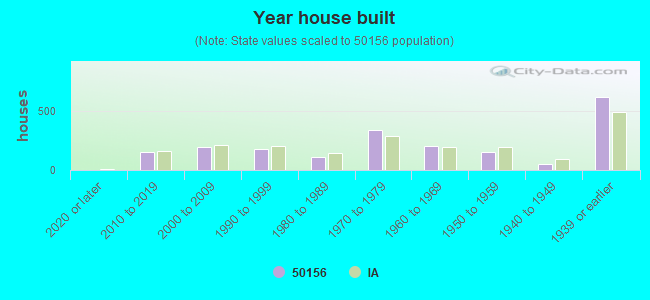


 Based on the data from the years 2003 - 2018 the average number of fires per year is 12. The highest number of fire incidents - 31 took place in 2004, and the least - 0 in 2006. The data has a dropping trend.
 When looking into fire subcategories, the most incidents belonged to: Outside Fires (49.7%), and Structure Fires (30.3%).