Estimated zip code population in 2022: 614 Zip code population in 2010: 466 Zip code population in 2000: 461
Houses and condos: 294 Renter-occupied apartments: 52
% of renters here:
19%
State:
28%
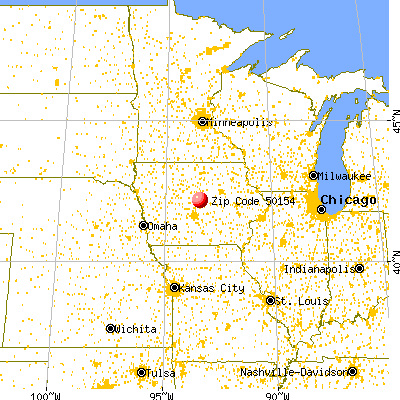
March 2022 cost of living index in zip code 50154: 82.1 (low, U.S. average is 100)
Land area: 20.5 sq. mi. Water area: 0.0 sq. mi.
Population density: 30 people per square mile
(very low).
OSM Map
General Map
Google Map
MSN Map
OSM Map
General Map
Google Map
MSN Map
OSM Map
General Map
Google Map
MSN Map
OSM Map
General Map
Google Map
MSN Map
Please wait while loading the map...
Real estate property taxes paid for housing units in 2022:
This zip code:
0.9% ($1,683)
Iowa:
1.4% ($2,724)
Median real estate property taxes paid for housing units with mortgages in 2022: $1,476 (0.8%) Median real estate property taxes paid for housing units with no mortgage in 2022: $3,453 (1.7%)
Business Search- 14 Million verified businesses
Males: 323
(52.7%)
Females: 290
(47.3%)
For population 25 years and over in 50154:
High school or higher: 94.8%
Bachelor's degree or higher: 13.4%
Graduate or professional degree: 1.3%
Unemployed: 5.0%
Mean travel time to work (commute): 24.9 minutes
For population 15 years and over in 50154:
Never married: 32.8%
Now married: 52.6%
Separated: 0.0%
Widowed: 1.9%
Divorced: 12.7%
Zip code 50154 compared to state average:
Black race population percentage significantly below state average.
Hispanic race population percentage significantly below state average.
Foreign-born population percentage significantly below state average.
Length of stay since moving in significantly above state average.
Number of college students below state average.
Percentage of population with a bachelor's degree or higher significantly below state average.
Averages for the 2020 tax year for zip code 50154, filed in 2021:
Average Adjusted Gross Income (AGI) in 2020: $65,952 (Individual Income Tax Returns)
Here:
$65,952
State:
$71,087
Salary/wage: $60,580 (reported on 80.0% of returns)
Here:
$60,580
State:
$57,361
(% of AGI for various income ranges: 1536.7% for AGIs below $25k, 3726.7% for AGIs $25k-50k, 6517.5% for AGIs $50k-75k, 12065.0% for AGIs $75k-100k, 27585.0% for AGIs $100k-200k)
Taxable interest for individuals: $675 (reported on 32.0% of returns)
This zip code:
$675
Iowa:
$1,633
(% of AGI for various income ranges: 40.0% for AGIs $50k-75k, 190.0% for AGIs $100k-200k)
Ordinary dividends: $900 (reported on 16.0% of returns)
Here:
$900
State:
$5,432
(% of AGI for various income ranges: 90.0% for AGIs $50k-75k)
Net capital gain/loss in AGI: +$425 (reported on 16.0% of returns)
Here:
+$425
State:
+$15,243
(% of AGI for various income ranges: 85.0% for AGIs $75k-100k)
Profit/loss from business: +$5,500 (reported on 8.0% of returns)
Here:
+$5,500
State:
+$11,763
(% of AGI for various income ranges: 366.7% for AGIs $25k-50k)
Percentage of individuals using paid preparers for their 2020 taxes: 92.0%
Here:
92%
State:
95%
(% for various income ranges: 100.0% for AGIs below $25k, 80.0% for AGIs $25k-50k, 100.0% for AGIs $50k-75k, 75.0% for AGIs $75k-100k, 100.0% for AGIs $100k-200k)
Averages for the 2012 tax year for zip code 50154, filed in 2013:
Average Adjusted Gross Income (AGI) in 2012: $58,230 (Individual Income Tax Returns)
Here:
$58,230
State:
$58,860
Salary/wage: $42,785 (reported on 87.0% of returns)
Here:
$42,785
State:
$46,659
(% of AGI for various income ranges: 68.4% for AGIs below $25k, 78.8% for AGIs $25k-50k, 66.8% for AGIs $50k-75k, 83.0% for AGIs $75k-100k, 44.9% for AGIs $100k-200k)
Taxable interest for individuals: $500 (reported on 34.8% of returns)
This zip code:
$500
Iowa:
$1,537
(% of AGI for various income ranges: 1.9% for AGIs below $25k, 0.5% for AGIs $50k-75k, 0.3% for AGIs $75k-100k)
Ordinary dividends: $575 (reported on 17.4% of returns)
Here:
$575
State:
$4,542
Net capital gain/loss in AGI: +$800 (reported on 8.7% of returns)
Here:
+$800
State:
+$11,802
Profit/loss from business: +$967 (reported on 13.0% of returns)
Here:
+$967
State:
+$10,509
Total itemized deductions: $18,362 (18% of AGI, reported on 34.8% of returns)
Here:
$18,362
State:
$21,278
Here:
18.3% of AGI
State:
18.9% of AGI
(% of AGI for various income ranges: 35.8% for AGIs below $25k, 19.1% for AGIs $50k-75k, 12.0% for AGIs $100k-200k)
Charity contributions: $3,200 (reported on 26.1% of returns)
Here:
$3,200
State:
$4,044
Taxes paid: $6,100 (reported on 34.8% of returns)
50154:
$6,100
State:
$8,846
(% of AGI for various income ranges: 7.5% for AGIs below $25k, 6.2% for AGIs $50k-75k, 4.9% for AGIs $100k-200k)
Earned income credit: $1,900 (reported on 13.0% of returns)
Here:
$1,900
State:
$2,098
(% of AGI for various income ranges: 6.0% for AGIs below $25k)
Percentage of individuals using paid preparers for their 2012 taxes: 69.6%
Here:
70%
State:
65%
(% for various income ranges: 71.4% for AGIs below $25k, 66.7% for AGIs $25k-50k, 60.0% for AGIs $50k-75k, 133.3% for AGIs $75k-100k)
Averages for the 2004 tax year for zip code 50154, filed in 2005:
Average Adjusted Gross Income (AGI) in 2004: $38,937 (Individual Income Tax Returns)
Here:
$38,937
State:
$43,875
Salary/wage: $36,186 (reported on 82.1% of returns)
Here:
$36,186
State:
$38,265
(% of AGI for various income ranges: 78.1% for AGIs below $10k, 65.7% for AGIs $10k-25k, 75.4% for AGIs $25k-50k, 78.0% for AGIs $50k-75k, 83.0% for AGIs $75k-100k, 73.9% for AGIs over 100k)
Taxable interest for individuals: $821 (reported on 55.2% of returns)
This zip code:
$821
Iowa:
$1,768
(% of AGI for various income ranges: 1.6% for AGIs below $10k, 1.7% for AGIs $10k-25k, 2.7% for AGIs $25k-50k, 0.8% for AGIs $50k-75k, 0.2% for AGIs $75k-100k)
Taxable dividends: $880 (reported on 22.4% of returns)
Here:
$880
State:
$2,510
Net capital gain/loss: +$371 (reported on 15.7% of returns)
Here:
+$371
State:
+$6,139
Profit/loss from business: +$1,955 (reported on 9.9% of returns)
Here:
+$1,955
State:
+$8,574
Profit/loss from farming: +$235 (reported on 7.6% of returns)
Here:
+$235
State:
-$74
Total itemized deductions: $12,877 (21% of AGI, reported on 29.1% of returns)
Here:
$12,877
State:
$16,976
Here:
20.8% of AGI
State:
20.8% of AGI
Charity contributions deductions: $1,939 (3% of AGI, reported on 22.0% of returns)
Here:
$1,939
State:
$3,089
Here:
3.0% of AGI
State:
3.6% of AGI
Total tax: $4,190 (reported on 80.3% of returns)
50154:
$4,190
State:
$6,177
(% of AGI for various income ranges: 2.1% for AGIs below $10k, 3.6% for AGIs $10k-25k, 6.9% for AGIs $25k-50k, 8.5% for AGIs $50k-75k, 10.2% for AGIs $75k-100k, 14.8% for AGIs over 100k)
Earned income credit: $1,263 (reported on 8.5% of returns)
Here:
$1,263
State:
$1,540
Percentage of individuals using paid preparers for their 2004 taxes: 74.9%
Here:
75%
State:
70%
(% for various income ranges: 71.4% for AGIs below $10k, 69.6% for AGIs $10k-25k, 77.2% for AGIs $25k-50k, 78.0% for AGIs $50k-75k, 133.3% for AGIs $75k-100k)
Household received Food Stamps/SNAP in the past 12 months: 35 Household did not receive Food Stamps/SNAP in the past 12 months: 242
Women who had a birth in the past 12 months: 12 (12 now married, 0 unmarried) Women who did not have a birth in the past 12 months: 117 (46 now married, 71 unmarried)
Housing units in zip code 50154 with a mortgage: 139 (12 second mortgage, 7 both second mortgage and home equity loan) Median monthly owner costs for units with a mortgage: $1,255 Median monthly owner costs for units without a mortgage: $749
Residents with income below the poverty level in 2022:
This zip code:
4.7%
Whole state:
11.0%
Residents with income below 50% of the poverty level in 2022:
This zip code:
1.8%
Whole state:
5.5%
Median number of rooms in houses and condos:
Here:
6.5
State:
6.8
Median number of rooms in apartments:
Here:
3.3
State:
4.2
Notable locations in this zip code not listed on our city pages
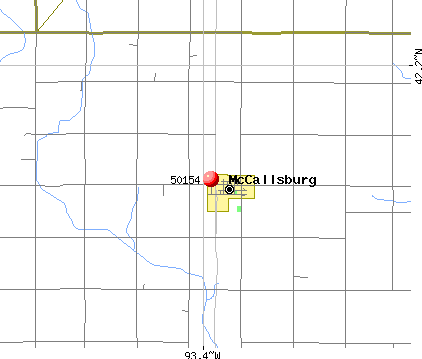
Notable locations in zip code 50154: McCallsburg (A), Mccallsburg First Responders (B), McCallsburg Fire Department (C), McCallsburg City Hall (D). Display/hide their locations on the map
Size of family households: 119 2-persons, 36 3-persons, 22 4-persons, 7 5-persons, 8 6-persons
Size of nonfamily households: 68 1-person, 18 2-persons
70 married couples with children.
28 single-parent households (6 men, 22 women).
99.3% of residents of 50154 zip code speak English at home.
Foreign born population: 0 (0.0%)
:
0.0%
Whole state:
6.0%
37%German
27%American
19%Norwegian
6%Irish
5%English
2%Scotch-Irish
1%Dutch
Facilities with environmental interests located in this zip code:
THOMPSON AUTO PARTS (955 MAIN STREET in MCCALLSBURG, IA)
AIR MINOR (AIRS/AFS) COMPLIANCE ACTIVITY (Tracking inspections of insecticide, fungicide, and rodenticide, and toxic substances) Business SIC classification: MOTOR VEHICLE PARTS, USED
COLO-NESCO CSD (400 LATROBE in MC CALLSBURG, IA)
COMPLIANCE ACTIVITY (Tracking inspections of insecticide, fungicide, and rodenticide, and toxic substances)
Housing units lacking complete plumbing facilities: 3.2% Housing units lacking complete kitchen facilities: 1.4%
46.2%Utility gas
30.2%Electricity
22.7%Bottled, tank, or LP gas
1.9%No fuel used
Population in 1990: 533.
Place of birth for U.S.-born residents:
This state: 509
Northeast: 6
Midwest: 68
South: 20
West: 8
74% of the 50154 zip code residents lived in the same house 5 years ago. Out of people who lived in different houses, 62% lived in this county. Out of people who lived in different counties, 50% lived in Iowa.
92% of the 50154 zip code residents lived in the same house 1 year ago. Out of people who lived in different houses, 103% moved from different county within same state.
Private vs. public school enrollment:
Students in private schools in grades 1 to 8 (elementary and middle school): 3
Here:
7.7%
Iowa:
10.6%
Students in private schools in grades 9 to 12 (high school): 2
Here:
5.4%
Iowa:
7.9%
Students in private undergraduate colleges: 5
Here:
37.3%
Iowa:
23.9%
Occupation by median earnings in the past 12 months ($)
81,608Health diagnosing and treating practitioners and other technical occupations
73,595Installation, maintenance, and repair occupations
64,721Education, training, and library occupations
55,000Construction and extraction occupations
51,970Life, physical, and social science occupations
48,378Production occupations
Top industries in this zip code by the number of employees in 2005:
Other Services (except Public Administration): Religious Organizations (5-9 employees: 1 establishment)
Construction: Residential Remodelers (1-4: 2)
Finance and Insurance: Commercial Banking (1-4: 1)
Construction: New Single-Family Housing Construction (except Operative Builders) (1-4: 1)
Wholesale Trade: Service Establishment Equipment and Supplies Merchant Wholesalers (1-4: 1)
Construction: Site Preparation Contractors (1-4: 1)
Home Mortgage Disclosure Act Aggregated Statistics For Year 2009 (Based on 2 partial tracts)
A) FHA, FSA/RHS & VA Home Purchase Loans
B) Conventional Home Purchase Loans
C) Refinancings
D) Home Improvement Loans
F) Non-occupant Loans on < 5 Family Dwellings (A B C & D)
Number
Average Value
Number
Average Value
Number
Average Value
Number
Average Value
Number
Average Value
LOANS ORIGINATED
2
$92,955
4
$101,705
8
$103,826
1
$53,840
1
$58,610
APPLICATIONS APPROVED, NOT ACCEPTED
0
$0
0
$0
1
$102,370
0
$0
0
$0
APPLICATIONS DENIED
0
$0
1
$65,500
2
$105,020
1
$103,690
0
$0
APPLICATIONS WITHDRAWN
0
$0
1
$47,210
2
$112,845
0
$0
0
$0
FILES CLOSED FOR INCOMPLETENESS
0
$0
0
$0
0
$0
0
$0
0
$0
Aggregated Statistics For Year 2008 (Based on 2 partial tracts)
A) FHA, FSA/RHS & VA Home Purchase Loans
B) Conventional Home Purchase Loans
C) Refinancings
D) Home Improvement Loans
F) Non-occupant Loans on < 5 Family Dwellings (A B C & D)
Number
Average Value
Number
Average Value
Number
Average Value
Number
Average Value
Number
Average Value
LOANS ORIGINATED
1
$50,650
3
$126,677
9
$88,930
3
$36,243
1
$61,260
APPLICATIONS APPROVED, NOT ACCEPTED
0
$0
0
$0
1
$40,580
0
$0
0
$0
APPLICATIONS DENIED
0
$0
0
$0
3
$75,847
1
$20,690
0
$0
APPLICATIONS WITHDRAWN
0
$0
0
$0
2
$125,970
1
$90,170
0
$0
FILES CLOSED FOR INCOMPLETENESS
0
$0
0
$0
1
$66,830
0
$0
0
$0
Aggregated Statistics For Year 2007 (Based on 2 partial tracts)
A) FHA, FSA/RHS & VA Home Purchase Loans
B) Conventional Home Purchase Loans
C) Refinancings
D) Home Improvement Loans
F) Non-occupant Loans on < 5 Family Dwellings (A B C & D)
Number
Average Value
Number
Average Value
Number
Average Value
Number
Average Value
Number
Average Value
LOANS ORIGINATED
1
$84,070
3
$120,930
5
$76,430
4
$50,918
1
$47,470
APPLICATIONS APPROVED, NOT ACCEPTED
0
$0
0
$0
2
$112,310
0
$0
0
$0
APPLICATIONS DENIED
0
$0
1
$40,310
8
$122,755
3
$71,780
0
$0
APPLICATIONS WITHDRAWN
0
$0
0
$0
3
$127,827
0
$0
0
$0
FILES CLOSED FOR INCOMPLETENESS
0
$0
0
$0
1
$212,160
0
$0
0
$0
Aggregated Statistics For Year 2006 (Based on 2 partial tracts)
A) FHA, FSA/RHS & VA Home Purchase Loans
B) Conventional Home Purchase Loans
C) Refinancings
D) Home Improvement Loans
F) Non-occupant Loans on < 5 Family Dwellings (A B C & D)
G) Loans On Manufactured Home Dwelling (A B C & D)
Number
Average Value
Number
Average Value
Number
Average Value
Number
Average Value
Number
Average Value
Number
Average Value
LOANS ORIGINATED
1
$102,370
7
$90,660
10
$99,132
2
$34,345
1
$90,170
0
$0
APPLICATIONS APPROVED, NOT ACCEPTED
0
$0
1
$67,360
2
$56,490
0
$0
1
$50,390
0
$0
APPLICATIONS DENIED
1
$35,800
3
$55,780
7
$89,979
0
$0
1
$24,400
1
$4,770
APPLICATIONS WITHDRAWN
0
$0
1
$60,730
3
$71,957
0
$0
0
$0
0
$0
FILES CLOSED FOR INCOMPLETENESS
0
$0
0
$0
2
$95,470
0
$0
0
$0
0
$0
Aggregated Statistics For Year 2005 (Based on 2 partial tracts)
A) FHA, FSA/RHS & VA Home Purchase Loans
B) Conventional Home Purchase Loans
C) Refinancings
D) Home Improvement Loans
F) Non-occupant Loans on < 5 Family Dwellings (A B C & D)
G) Loans On Manufactured Home Dwelling (A B C & D)
Number
Average Value
Number
Average Value
Number
Average Value
Number
Average Value
Number
Average Value
Number
Average Value
LOANS ORIGINATED
1
$32,620
7
$83,197
11
$74,738
2
$25,990
1
$38,980
0
$0
APPLICATIONS APPROVED, NOT ACCEPTED
0
$0
0
$0
3
$78,323
0
$0
0
$0
0
$0
APPLICATIONS DENIED
0
$0
3
$65,063
7
$78,651
2
$30,100
0
$0
1
$36,600
APPLICATIONS WITHDRAWN
0
$0
1
$58,870
5
$85,130
0
$0
0
$0
0
$0
FILES CLOSED FOR INCOMPLETENESS
0
$0
0
$0
2
$71,075
0
$0
0
$0
0
$0
Aggregated Statistics For Year 2004 (Based on 2 partial tracts)
A) FHA, FSA/RHS & VA Home Purchase Loans
B) Conventional Home Purchase Loans
C) Refinancings
D) Home Improvement Loans
E) Loans on Dwellings For 5+ Families
F) Non-occupant Loans on < 5 Family Dwellings (A B C & D)


+$235
-$74
 Nearest zip codes: 50102, 50236, 50278, 50201, 50230, 50122.


