Estimated zip code population in 2022: 5,928 Zip code population in 2010: 6,096 Zip code population in 2000: 5,864
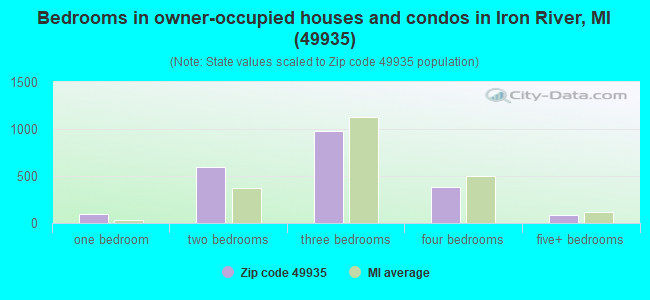
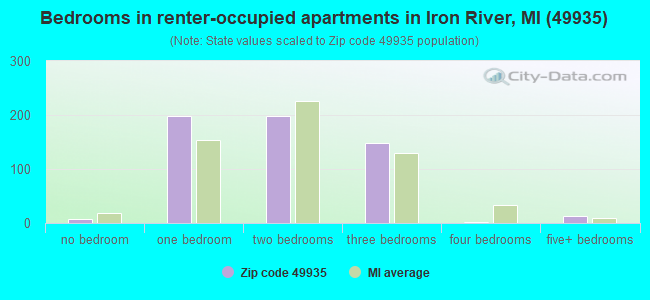
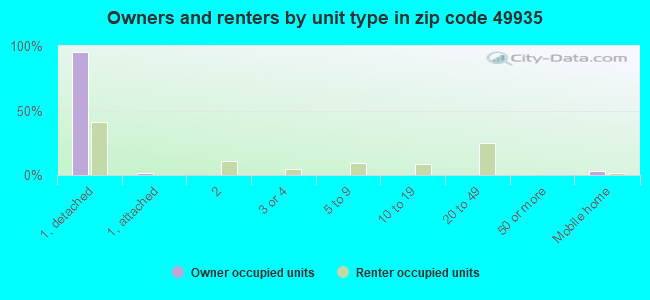
Houses and condos: 4,583 Renter-occupied apartments: 568
% of renters here:
21%
State:
27%
March 2022 cost of living index in zip code 49935: 79.3 (low, U.S. average is 100)
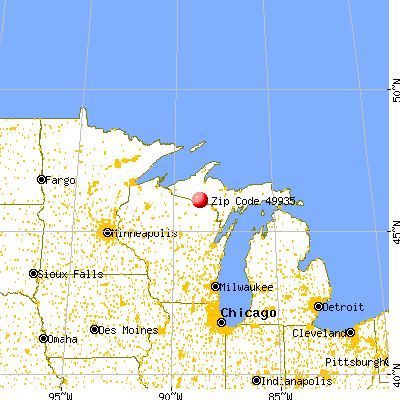
Land area: 474.8 sq. mi. Water area: 12.9 sq. mi.
Population density: 12 people per square mile
(very low).
OSM Map
General Map
Google Map
MSN Map
OSM Map
General Map
Google Map
MSN Map
OSM Map
General Map
Google Map
MSN Map
OSM Map
General Map
Google Map
MSN Map
Please wait while loading the map...
Real estate property taxes paid for housing units in 2022:
This zip code:
1.3% ($1,490)
Michigan:
1.2% ($2,746)
Median real estate property taxes paid for housing units with mortgages in 2022: $1,867 (1.5%) Median real estate property taxes paid for housing units with no mortgage in 2022: $1,190 (1.3%)
Business Search- 14 Million verified businesses
Males: 2,927
(49.4%)
Females: 3,001
(50.6%)
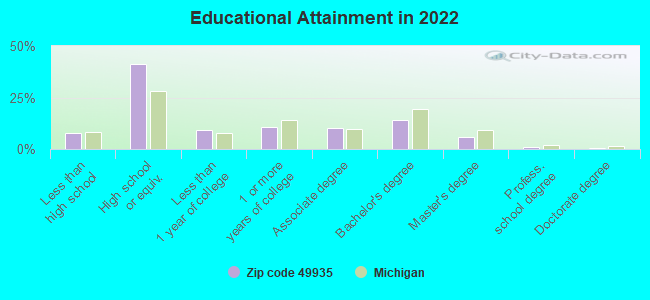
For population 25 years and over in 49935:
High school or higher: 91.9%
Bachelor's degree or higher: 21.3%
Graduate or professional degree: 7.1%
Unemployed: 2.9%
Mean travel time to work (commute): 20.5 minutes
For population 15 years and over in 49935:
Never married: 30.0%
Now married: 48.7%
Separated: 0.1%
Widowed: 6.9%
Divorced: 14.3%
Zip code 49935 compared to state average:
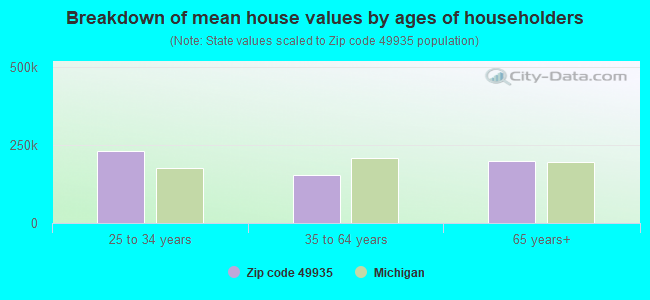
Median house value below state average.
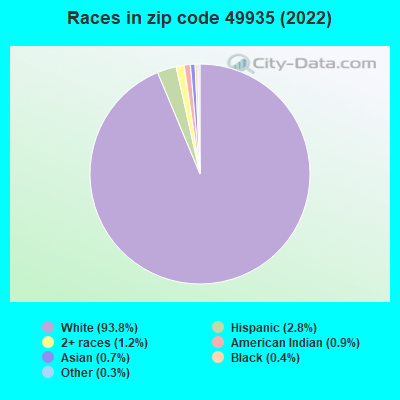
Black race population percentage significantly below state average.
Hispanic race population percentage below state average.
Median age significantly above state average.
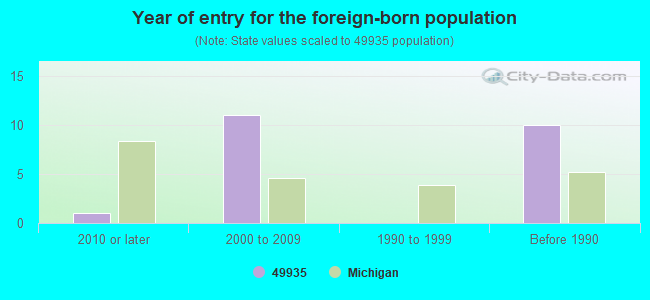
Foreign-born population percentage significantly below state average.
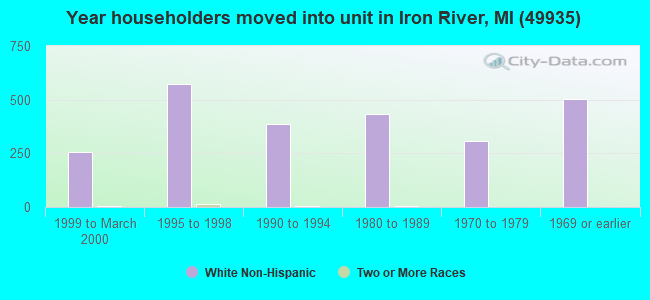
Length of stay since moving in significantly above state average.
Averages for the 2020 tax year for zip code 49935, filed in 2021:
Average Adjusted Gross Income (AGI) in 2020: $46,292 (Individual Income Tax Returns)
Here:
$46,292
State:
$68,945
Salary/wage: $38,733 (reported on 70.6% of returns)
Here:
$38,733
State:
$57,142
(% of AGI for various income ranges: 955.3% for AGIs below $25k, 3036.0% for AGIs $25k-50k, 6036.7% for AGIs $50k-75k, 8253.3% for AGIs $75k-100k, 14580.0% for AGIs $100k-200k)
Taxable interest for individuals: $1,018 (reported on 38.5% of returns)
This zip code:
$1,018
Michigan:
$1,630
(% of AGI for various income ranges: 21.1% for AGIs below $25k, 26.0% for AGIs $25k-50k, 63.3% for AGIs $50k-75k, 138.7% for AGIs $75k-100k, 222.1% for AGIs $100k-200k)
Ordinary dividends: $5,053 (reported on 19.2% of returns)
Here:
$5,053
State:
$6,972
(% of AGI for various income ranges: 34.4% for AGIs below $25k, 74.4% for AGIs $25k-50k, 103.3% for AGIs $50k-75k, 149.3% for AGIs $75k-100k, 481.4% for AGIs $100k-200k)
Net capital gain/loss in AGI: +$5,596 (reported on 18.5% of returns)
Here:
+$5,596
State:
+$20,064
(% of AGI for various income ranges: 24.2% for AGIs below $25k, 39.3% for AGIs $25k-50k, 110.4% for AGIs $50k-75k, 264.7% for AGIs $75k-100k, 514.3% for AGIs $100k-200k)
Profit/loss from business: +$8,003 (reported on 13.3% of returns)
Here:
+$8,003
State:
+$11,172
(% of AGI for various income ranges: 89.2% for AGIs below $25k, 139.1% for AGIs $25k-50k, 172.9% for AGIs $50k-75k, 102.0% for AGIs $75k-100k, 741.4% for AGIs $100k-200k)
Taxable individual retirement arrangement distribution: $17,965 (reported on 14.0% of returns)
49935:
$17,965
Michigan:
$19,803
(% of AGI for various income ranges: 87.6% for AGIs below $25k, 192.6% for AGIs $25k-50k, 410.8% for AGIs $50k-75k, 781.3% for AGIs $75k-100k, 1486.4% for AGIs $100k-200k)
Total itemized deductions: $35,671 (reported on 2.4% of returns)
Here:
$35,671
State:
$34,117
(% of AGI for various income ranges: 201.4% for AGIs $25k-50k, 963.6% for AGIs $100k-200k)
Charity contributions: $7,160 (reported on 1.7% of returns)
Here:
$7,160
State:
$13,548
(% of AGI for various income ranges: 255.7% for AGIs $100k-200k)
Taxes paid: $7,014 (reported on 2.4% of returns)
49935:
$7,014
State:
$7,972
(% of AGI for various income ranges: 60.8% for AGIs $50k-75k, 246.4% for AGIs $100k-200k)
Earned income credit: $2,131 (reported on 18.2% of returns)
Here:
$2,131
State:
$2,251
(% of AGI for various income ranges: 86.2% for AGIs below $25k, 85.4% for AGIs $25k-50k)
Percentage of individuals using paid preparers for their 2020 taxes: 95.8%
Here:
96%
State:
93%
(% for various income ranges: 95.7% for AGIs below $25k, 96.2% for AGIs $25k-50k, 94.7% for AGIs $50k-75k, 95.8% for AGIs $75k-100k, 95.7% for AGIs $100k-200k, 100.0% for AGIs over 200k)
Averages for the 2012 tax year for zip code 49935, filed in 2013:
Average Adjusted Gross Income (AGI) in 2012: $39,018 (Individual Income Tax Returns)
Here:
$39,018
State:
$55,609
Salary/wage: $32,697 (reported on 77.4% of returns)
Here:
$32,697
State:
$46,782
(% of AGI for various income ranges: 64.5% for AGIs below $25k, 69.6% for AGIs $25k-50k, 68.5% for AGIs $50k-75k, 62.3% for AGIs $75k-100k, 87.8% for AGIs $100k-200k)
Taxable interest for individuals: $795 (reported on 43.4% of returns)
This zip code:
$795
Michigan:
$1,491
(% of AGI for various income ranges: 2.2% for AGIs below $25k, 0.7% for AGIs $25k-50k, 0.7% for AGIs $50k-75k, 0.4% for AGIs $75k-100k, 1.3% for AGIs $100k-200k)
Ordinary dividends: $3,396 (reported on 21.1% of returns)
Here:
$3,396
State:
$6,225
(% of AGI for various income ranges: 2.5% for AGIs below $25k, 1.1% for AGIs $25k-50k, 1.5% for AGIs $50k-75k, 1.8% for AGIs $75k-100k, 3.8% for AGIs $100k-200k)
Net capital gain/loss in AGI: +$1,492 (reported on 19.2% of returns)
Here:
+$1,492
State:
+$9,326
(% of AGI for various income ranges: 0.2% for AGIs $25k-50k, 1.1% for AGIs $50k-75k, 0.3% for AGIs $75k-100k, 3.1% for AGIs $100k-200k)
Profit/loss from business: +$6,629 (reported on 13.2% of returns)
Here:
+$6,629
State:
+$11,523
(% of AGI for various income ranges: 4.9% for AGIs below $25k, 2.1% for AGIs $25k-50k, 1.3% for AGIs $50k-75k, 1.5% for AGIs $75k-100k, 3.4% for AGIs $100k-200k)
Taxable individual retirement arrangement distribution: $12,817 (reported on 13.6% of returns)
49935:
$12,817
Michigan:
$15,298
(% of AGI for various income ranges: 4.1% for AGIs below $25k, 3.6% for AGIs $25k-50k, 4.5% for AGIs $50k-75k, 4.8% for AGIs $75k-100k, 8.0% for AGIs $100k-200k)
Total itemized deductions: $18,965 (24% of AGI, reported on 18.5% of returns)
Here:
$18,965
State:
$21,628
Here:
24.0% of AGI
State:
18.4% of AGI
(% of AGI for various income ranges: 5.7% for AGIs below $25k, 7.5% for AGIs $25k-50k, 8.3% for AGIs $50k-75k, 9.3% for AGIs $75k-100k, 19.2% for AGIs $100k-200k)
Charity contributions: $3,072 (reported on 13.6% of returns)
Here:
$3,072
State:
$4,225
(% of AGI for various income ranges: 0.6% for AGIs below $25k, 0.9% for AGIs $25k-50k, 1.1% for AGIs $50k-75k, 1.1% for AGIs $75k-100k, 2.3% for AGIs $100k-200k)
Taxes paid: $6,004 (reported on 18.5% of returns)
49935:
$6,004
State:
$8,327
(% of AGI for various income ranges: 1.0% for AGIs below $25k, 1.8% for AGIs $25k-50k, 2.3% for AGIs $50k-75k, 2.8% for AGIs $75k-100k, 8.3% for AGIs $100k-200k)
Earned income credit: $1,953 (reported on 18.5% of returns)
Here:
$1,953
State:
$2,306
(% of AGI for various income ranges: 5.4% for AGIs below $25k, 0.8% for AGIs $25k-50k)
Percentage of individuals using paid preparers for their 2012 taxes: 66.4%
Here:
66%
State:
57%
(% for various income ranges: 59.7% for AGIs below $25k, 67.6% for AGIs $25k-50k, 72.5% for AGIs $50k-75k, 77.8% for AGIs $75k-100k, 84.6% for AGIs $100k-200k, 100.0% for AGIs over 200k)
Averages for the 2004 tax year for zip code 49935, filed in 2005:
Average Adjusted Gross Income (AGI) in 2004: $31,642 (Individual Income Tax Returns)
Here:
$31,642
State:
$48,204
Salary/wage: $27,752 (reported on 78.4% of returns)
Here:
$27,752
State:
$42,791
(% of AGI for various income ranges: 92.2% for AGIs below $10k, 63.0% for AGIs $10k-25k, 72.4% for AGIs $25k-50k, 74.6% for AGIs $50k-75k, 72.2% for AGIs $75k-100k, 53.5% for AGIs over 100k)
Taxable interest for individuals: $1,447 (reported on 48.9% of returns)
This zip code:
$1,447
Michigan:
$1,725
(% of AGI for various income ranges: 7.2% for AGIs below $10k, 3.1% for AGIs $10k-25k, 1.5% for AGIs $25k-50k, 1.4% for AGIs $50k-75k, 0.8% for AGIs $75k-100k, 4.0% for AGIs over 100k)
Taxable dividends: $2,031 (reported on 25.5% of returns)
Here:
$2,031
State:
$3,420
(% of AGI for various income ranges: 3.2% for AGIs below $10k, 1.6% for AGIs $10k-25k, 1.2% for AGIs $25k-50k, 1.2% for AGIs $50k-75k, 1.3% for AGIs $75k-100k, 2.8% for AGIs over 100k)
Net capital gain/loss: +$5,768 (reported on 21.2% of returns)
Here:
+$5,768
State:
+$8,532
(% of AGI for various income ranges: -1.4% for AGIs below $10k, 0.8% for AGIs $10k-25k, 0.9% for AGIs $25k-50k, 1.7% for AGIs $50k-75k, 2.4% for AGIs $75k-100k, 16.2% for AGIs over 100k)
Profit/loss from business: +$6,687 (reported on 15.0% of returns)
Here:
+$6,687
State:
+$9,547
(% of AGI for various income ranges: 2.7% for AGIs below $10k, 4.2% for AGIs $10k-25k, 2.3% for AGIs $25k-50k, 1.4% for AGIs $50k-75k, 3.0% for AGIs $75k-100k, 6.2% for AGIs over 100k)
IRA payment deduction: $2,905 (reported on 2.3% of returns)
49935:
$2,905
Michigan:
$2,875
Total itemized deductions: $15,029 (22% of AGI, reported on 16.9% of returns)
Here:
$15,029
State:
$18,509
Here:
22.3% of AGI
State:
20.7% of AGI
(% of AGI for various income ranges: 6.5% for AGIs below $10k, 5.8% for AGIs $10k-25k, 6.8% for AGIs $25k-50k, 8.5% for AGIs $50k-75k, 10.8% for AGIs $75k-100k, 9.9% for AGIs over 100k)
Charity contributions deductions: $2,485 (3% of AGI, reported on 13.8% of returns)
Here:
$2,485
State:
$3,365
Here:
3.4% of AGI
State:
3.6% of AGI
(% of AGI for various income ranges: 0.7% for AGIs $10k-25k, 0.8% for AGIs $25k-50k, 1.1% for AGIs $50k-75k, 2.1% for AGIs $75k-100k, 1.5% for AGIs over 100k)
Total tax: $4,083 (reported on 67.8% of returns)
49935:
$4,083
State:
$7,691
(% of AGI for various income ranges: 2.3% for AGIs below $10k, 3.8% for AGIs $10k-25k, 6.3% for AGIs $25k-50k, 8.9% for AGIs $50k-75k, 10.7% for AGIs $75k-100k, 16.8% for AGIs over 100k)
Earned income credit: $1,470 (reported on 17.3% of returns)
Here:
$1,470
State:
$1,737
Percentage of individuals using paid preparers for their 2004 taxes: 66.6%
Here:
67%
State:
60%
(% for various income ranges: 57.1% for AGIs below $10k, 67.0% for AGIs $10k-25k, 70.5% for AGIs $25k-50k, 71.8% for AGIs $50k-75k, 72.9% for AGIs $75k-100k, 84.1% for AGIs over 100k)
Likely homosexual households (counted as self-reported same-sex unmarried-partner households)
Lesbian couples: 0.1% of all households
Gay men: 0.0% of all households
Household received Food Stamps/SNAP in the past 12 months: 318 Household did not receive Food Stamps/SNAP in the past 12 months: 2,388
Women who had a birth in the past 12 months: 106 (7 now married, 93 unmarried) Women who did not have a birth in the past 12 months: 921 (326 now married, 595 unmarried)
Housing units in zip code 49935 with a mortgage: 979 (124 second mortgage, 2 home equity loan, 100 both second mortgage and home equity loan) Houses without a mortgage: 13
Median monthly owner costs for units with a mortgage: $1,088 Median monthly owner costs for units without a mortgage: $444
Residents with income below the poverty level in 2022:
This zip code:
14.8%
Whole state:
13.4%
Residents with income below 50% of the poverty level in 2022:
This zip code:
8.4%
Whole state:
6.9%
Median number of rooms in houses and condos:
Here:
5.9
State:
6.5
Median number of rooms in apartments:
Here:
3.9
State:
4.3
Notable locations in this zip code not listed on our city pages
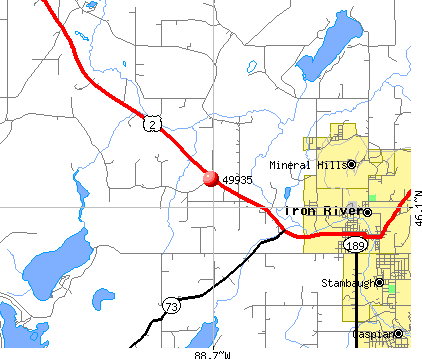
Notable locations in zip code 49935: George Young Golf Course (A), Iron River Country Club (B), Iron County Fairgrounds (C), Iron River RV Park (D), Wild River Motel and RV Park (E), Old Atkinson Dam Site (F), Golden Lake Recreation Area (G), Paint River Forks Campground (H), Black House Campground (I), Camp Gibbs Recreation Area (J), Perch Lake Campground (K), Lake Sainte Kathryn Campground (L), State Line Recreation Area (M), Hagerman Lake Recreation Area (N), Lake Ottawa Recreation Area (O), Holmes Park (P), Brule Mountain Ski Area (Q), Nesbit Lake Organization Camp (R), Norway Lake Campground and Picnic Area (S), Camp Gibbs (T). Display/hide their locations on the map
Churches in zip code 49935 include: Bethany Church (A), Finnish Lutheran Church (B), First Assembly of God Church (C), Trinity Lutheran Church (D), First Lutheran Church (E), Community Church of Nazarene (F), First Presbyterian Church (G), First Baptist Church (H), Grace Covenant Church (I). Display/hide their locations on the map
Cemeteries: Stambaugh Cemetery (1), Rosehill Cemetery (2), Bates Cemetery (3), Stambaugh Cemetery (4), Resthaven Cemetery (5), Iron River Cemetery (6). Display/hide their locations on the map
Lakes: Hannah Webb Lake (A), Porcupine Lake (B), Ponozzo Lake (C), Little Wolf Lake (D), Petrow Lake (E), Perch Lake (F), Bearpaw Lake (G), Bennan Lake (H). Display/hide their locations on the map
Streams, rivers, and creeks: Camp Lake Creek (A), Bush Creek (B), Nash Creek (C), North Branch Paint River (D), Borski Creek (E), Bleat Creek (F), Paint Creek (G), Sunset Creek (H), Kidney Creek (I). Display/hide their locations on the map
Parks in zip code 49935 include: Elmwood Wayside (1), Mattol Park (2), Hoover Park (3), Nelson Field (4), Bachman Park (5), Nanaimo Park (6), Sunset Lake Park (7), Ice Lake Park (8), Iron Inn Historical Marker (9). Display/hide their locations on the map
In group quarters: 88 (-1 institutionalized population)
Size of family households: 982 2-persons, 378 3-persons, 150 4-persons, 80 5-persons, 48 6-persons, 6 7-or-more-persons
Size of nonfamily households: 952 1-person, 112 2-persons, 9 3-persons
449 married couples with children.
402 single-parent households (145 men, 257 women).
99.0% of residents of 49935 zip code speak English at home.
0.3% of residents speak Spanish at home (83% very well, 11% well, 6% not well).
0.4% of residents speak other Indo-European language at home (92% very well, 8% well).
0.2% of residents speak Asian or Pacific Island language at home (100% very well).
0.4% of residents speak other language at home (100% very well).
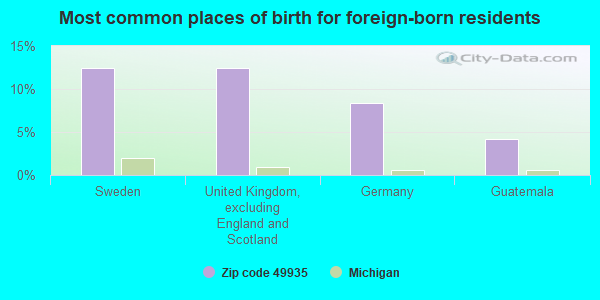
Foreign born population: 24 (0.4%) (88.1% of them are naturalized citizens)
This zip code:
0.4%
Whole state:
6.9%
12%Sweden
12%United Kingdom, excluding England and Scotland
8%Germany
4%Guatemala
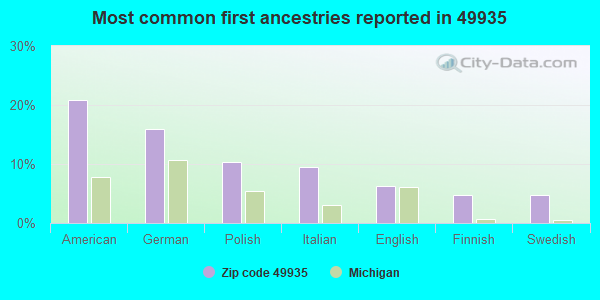
21%American
16%German
10%Polish
9%Italian
6%English
5%Finnish
5%Swedish
Year of entry for the foreign-born population
12010 or later
112000 to 2009
01990 to 1999
10Before 1990
Major facilities with environmental interests located in this zip code:
A.C.E. HIGH SCHOOL (702 4TH STREET in IRON RIVER, MI)
(National Center for Education Statistics) - STATE ID-07936 Organizations: WEST IRON COUNTY PUBLIC SCHOOLS (SCHOOL DISTRICT)
BATES ELEMENTARY SCHOOL (3257 HIGHWAY US-2 in IRON RIVER, MI)
(National Center for Education Statistics) - STATE ID-00217 Organizations: WEST IRON COUNTY PUBLIC SCHOOLS (SCHOOL DISTRICT)
DEVELOPMENTAL KINDERGARTEN (611 JEFFERSON in IRON RIVER, MI)
(National Center for Education Statistics) - STATE ID-08160 Organizations: WEST IRON COUNTY PUBLIC SCHOOLS (SCHOOL DISTRICT)
MI DEPT/TRANSPORTATION BRIDGE (US-2 OVER S BR IRON RIVER in IRON RIVER, MI)
(Resource Conservation and Recovery Act (tracking hazardous waste)) Organizations: MICH DEPT OF TRANSPORTATION (CONTACT/OPERATOR)
Alternative names: MIDOT BRIDGE US-2 OVER S BR IRON RIVER
MI DEPT/TRANSPORTATION BRIDGE B01-36021 (US-2 OVER CROOKS RUN RIVER in IRON RIVER, MI)
(Resource Conservation and Recovery Act (tracking hazardous waste)) Organizations: MICH DEPT OF TRANSPORTATION (CONTACT/OWNER)
Alternative names: MIDOT BRIDGE US-2 OVER COOKS RUN RIVER
MI DEPT/TRANSPORTATION BRIDGE B03-36021 (HWY US2 OVER S BR PAINT RV in IRON RIVER, MI)
(Resource Conservation and Recovery Act (tracking hazardous waste)) Organizations: MICH DEPT OF TRANSPORTATION (CONTACT/OPERATOR)
Alternative names: MIDOT BRIDGE US-2 OVER S B PAINT RIVER
Housing units lacking complete plumbing facilities: 6.1% Housing units lacking complete kitchen facilities: 5.9%
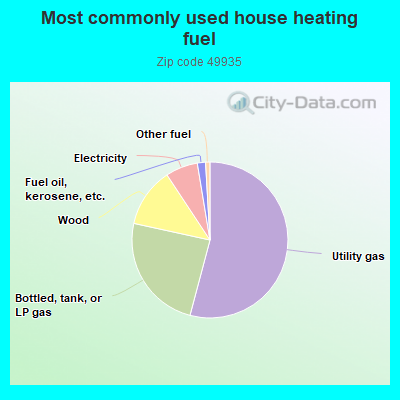
54.2%Utility gas
24.3%Bottled, tank, or LP gas
12.3%Wood
6.7%Electricity
1.7%Fuel oil, kerosene, etc.
0.9%Other fuel
Population in 1990: 7,882.
Place of birth for U.S.-born residents:
This state: 4,128
Northeast: 58
Midwest: 1,288
South: 264
West: 181
68% of the 49935 zip code residents lived in the same house 5 years ago. Out of people who lived in different houses, 56% lived in this county. Out of people who lived in different counties, 50% lived in Michigan.
92% of the 49935 zip code residents lived in the same house 1 year ago. Out of people who lived in different houses, 47% moved from this county. Out of people who lived in different houses, 26% moved from different county within same state. Out of people who lived in different houses, 30% moved from different state.
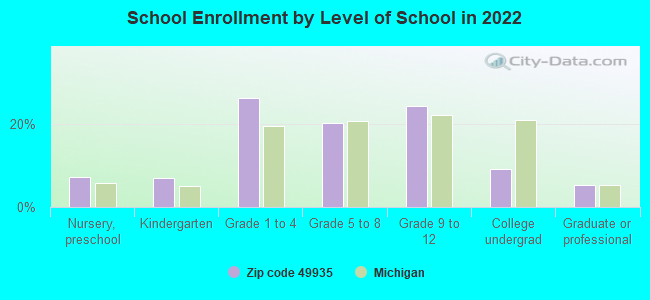
Private vs. public school enrollment:
Students in private schools in grades 1 to 8 (elementary and middle school): 35
Here:
7.8%
Michigan:
12.4%
Students in private schools in grades 9 to 12 (high school): 23
Here:
9.8%
Michigan:
9.8%
Students in private undergraduate colleges: 24
Here:
27.6%
Michigan:
14.9%
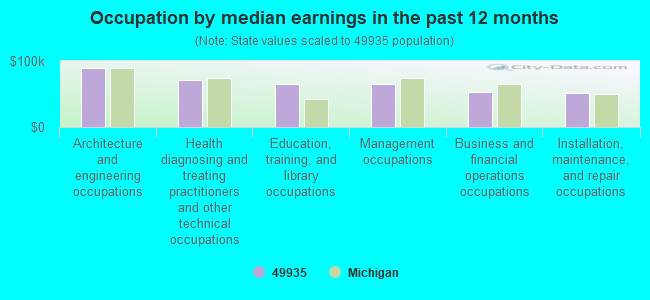
Occupation by median earnings in the past 12 months ($)
90,026Architecture and engineering occupations
71,419Health diagnosing and treating practitioners and other technical occupations
65,314Education, training, and library occupations
64,693Management occupations
53,391Business and financial operations occupations
51,533Installation, maintenance, and repair occupations
Companies with federal contracts located in this zip code:
JOE STIEVENART (1609 PETERSON ST in IRON RIVER, MI; small business)
$6,975 with U.S. Army Corps of Engineers - civil program financing only for Operation of Government-Owned Facilities -- Recreation Facilities (Non-Building). Taking place in NM. Signed on 2002-03-07. Completion date: 2002-10-31.
OLDENBURG GROUP INCORPORATED (1150 W ADAMS ST in IRON RIVER, MI; small business) : $4,269 in 2 contractsfrom 2002 to 2005
$3,525 with Navy for Miscellaneous Items. Signed on 2002-11-13. Completion date: 2002-11-19.
$744 with Navy for Hose, Pipe, Tube, Lubrication, and Railing Fittings. Signed on 2005-05-26. Completion date: 2005-07-29.
Top industries in this zip code by the number of employees in 2005:
Health Care and Social Assistance: General Medical and Surgical Hospitals (100-249 employees: 1 establishment)
68 people in nursing facilities/skilled-nursing facilities
16 people in group homes intended for adults
15 people in emergency and transitional shelters (with sleeping facilities) for people experiencing homelessness
5 people in residential treatment centers for juveniles (non-correctional)
People in group quarters in 2000:
229 people in other types of correctional institutions
68 people in nursing homes
15 people in homes for the mentally ill
14 people in other group homes
2 people in homes for the physically handicapped
Fatal accident statistics in 2014:
Fatal accident count: 1
Vehicles involved in fatal accidents: 2
Fatal accidents caused by drunken drivers: 0
Fatalities: 1
Persons involved in fatal accidents: 2
Pedestrians involved in fatal accidents: 0
Fatal accident statistics in 2011:
Fatal accident count: 2
Vehicles involved in fatal accidents: 3
Fatal accidents caused by drunken drivers: 1
Fatalities: 2
Persons involved in fatal accidents: 12
Pedestrians involved in fatal accidents: 0
2002 - 2018 National Fire Incident Reporting System (NFIRS) incidents
According to the data from the years 2002 - 2018 the average number of fire incidents per year is 24. The highest number of fires - 37 took place in 2009, and the least - 14 in 2005. The data has a decreasing trend.
When looking into fire subcategories, the most incidents belonged to: Structure Fires (44.0%), and Outside Fires (36.8%).
Fire incident types reported to NFIRS in Zip Code 49935


 Nearest zip codes: 49915, 54542, 49927, 54554, 49903, 49961.


 According to the data from the years 2002 - 2018 the average number of fire incidents per year is 24. The highest number of fires - 37 took place in 2009, and the least - 14 in 2005. The data has a decreasing trend.
 When looking into fire subcategories, the most incidents belonged to: Structure Fires (44.0%), and Outside Fires (36.8%).