Estimated zip code population in 2022: 3,534 Zip code population in 2010: 3,685 Zip code population in 2000: 3,725
Houses and condos: 2,724 Renter-occupied apartments: 340
% of renters here:
19%
State:
27%
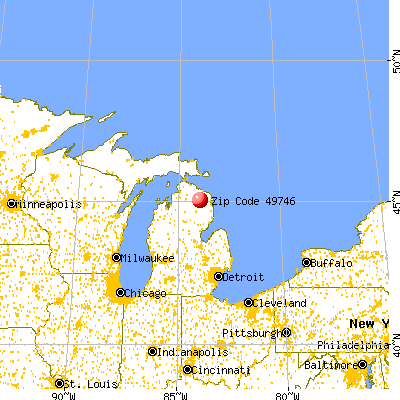
March 2022 cost of living index in zip code 49746: 80.9 (low, U.S. average is 100)
Land area: 211.7 sq. mi. Water area: 12.8 sq. mi.
Population density: 17 people per square mile
(very low).
OSM Map
General Map
Google Map
MSN Map
OSM Map
General Map
Google Map
MSN Map
OSM Map
General Map
Google Map
MSN Map
OSM Map
General Map
Google Map
MSN Map
Please wait while loading the map...
Real estate property taxes paid for housing units in 2022:
This zip code:
0.9% ($1,326)
Michigan:
1.2% ($2,746)
Median real estate property taxes paid for housing units with mortgages in 2022: $1,477 (0.9%) Median real estate property taxes paid for housing units with no mortgage in 2022: $1,136 (0.9%)
Business Search- 14 Million verified businesses
Males: 1,805
(51.1%)
Females: 1,728
(48.9%)
For population 25 years and over in 49746:
High school or higher: 87.2%
Bachelor's degree or higher: 12.9%
Graduate or professional degree: 4.5%
Unemployed: 4.2%
Mean travel time to work (commute): 27.7 minutes
For population 15 years and over in 49746:
Never married: 21.8%
Now married: 52.8%
Separated: 0.6%
Widowed: 6.1%
Divorced: 18.6%
Zip code 49746 compared to state average:
Median household income below state average.
Median house value below state average.
Black race population percentage significantly below state average.
Hispanic race population percentage significantly below state average.
Median age significantly above state average.
Foreign-born population percentage significantly below state average.
Length of stay since moving in significantly above state average.
Percentage of population with a bachelor's degree or higher significantly below state average.
Averages for the 2020 tax year for zip code 49746, filed in 2021:
Average Adjusted Gross Income (AGI) in 2020: $45,024 (Individual Income Tax Returns)
Here:
$45,024
State:
$68,945
Salary/wage: $37,291 (reported on 70.7% of returns)
Here:
$37,291
State:
$57,142
(% of AGI for various income ranges: 993.8% for AGIs below $25k, 2958.2% for AGIs $25k-50k, 4864.4% for AGIs $50k-75k, 7936.0% for AGIs $75k-100k, 15973.8% for AGIs $100k-200k)
Taxable interest for individuals: $951 (reported on 30.5% of returns)
This zip code:
$951
Michigan:
$1,630
(% of AGI for various income ranges: 23.5% for AGIs below $25k, 24.8% for AGIs $25k-50k, 58.3% for AGIs $50k-75k, 52.0% for AGIs $75k-100k, 166.2% for AGIs $100k-200k)
Ordinary dividends: $2,950 (reported on 15.6% of returns)
Here:
$2,950
State:
$6,972
(% of AGI for various income ranges: 27.1% for AGIs below $25k, 29.4% for AGIs $25k-50k, 76.1% for AGIs $50k-75k, 122.0% for AGIs $75k-100k, 351.2% for AGIs $100k-200k)
Net capital gain/loss in AGI: +$6,854 (reported on 14.4% of returns)
Here:
+$6,854
State:
+$20,064
(% of AGI for various income ranges: 20.2% for AGIs below $25k, 92.1% for AGIs $25k-50k, 136.1% for AGIs $50k-75k, 305.0% for AGIs $75k-100k, 867.5% for AGIs $100k-200k)
Profit/loss from business: +$8,935 (reported on 13.8% of returns)
Here:
+$8,935
State:
+$11,172
(% of AGI for various income ranges: 69.6% for AGIs below $25k, 124.2% for AGIs $25k-50k, 168.3% for AGIs $50k-75k, 313.0% for AGIs $75k-100k, 868.8% for AGIs $100k-200k)
Taxable individual retirement arrangement distribution: $16,362 (reported on 12.6% of returns)
49746:
$16,362
Michigan:
$19,803
(% of AGI for various income ranges: 99.8% for AGIs below $25k, 136.4% for AGIs $25k-50k, 257.2% for AGIs $50k-75k, 822.0% for AGIs $75k-100k, 1527.5% for AGIs $100k-200k)
Total itemized deductions: $32,700 (reported on 2.4% of returns)
Here:
$32,700
State:
$34,117
(% of AGI for various income ranges: 1635.0% for AGIs $100k-200k)
Charity contributions: $6,200 (reported on 1.8% of returns)
Here:
$6,200
State:
$13,548
(% of AGI for various income ranges: 186.0% for AGIs $75k-100k)
Taxes paid: $7,850 (reported on 2.4% of returns)
49746:
$7,850
State:
$7,972
(% of AGI for various income ranges: 392.5% for AGIs $100k-200k)
Earned income credit: $2,056 (reported on 16.2% of returns)
Here:
$2,056
State:
$2,251
(% of AGI for various income ranges: 68.8% for AGIs below $25k, 68.2% for AGIs $25k-50k)
Percentage of individuals using paid preparers for their 2020 taxes: 94.0%
Here:
94%
State:
93%
(% for various income ranges: 92.8% for AGIs below $25k, 95.5% for AGIs $25k-50k, 91.7% for AGIs $50k-75k, 93.3% for AGIs $75k-100k, 100.0% for AGIs $100k-200k, 100.0% for AGIs over 200k)
Averages for the 2012 tax year for zip code 49746, filed in 2013:
Average Adjusted Gross Income (AGI) in 2012: $35,297 (Individual Income Tax Returns)
Here:
$35,297
State:
$55,609
Salary/wage: $29,262 (reported on 73.4% of returns)
Here:
$29,262
State:
$46,782
(% of AGI for various income ranges: 57.9% for AGIs below $25k, 64.7% for AGIs $25k-50k, 67.7% for AGIs $50k-75k, 65.6% for AGIs $75k-100k, 45.9% for AGIs $100k-200k)
Taxable interest for individuals: $967 (reported on 35.1% of returns)
This zip code:
$967
Michigan:
$1,491
(% of AGI for various income ranges: 2.1% for AGIs below $25k, 0.7% for AGIs $25k-50k, 0.3% for AGIs $50k-75k, 0.6% for AGIs $75k-100k, 1.4% for AGIs $100k-200k)
Ordinary dividends: $2,062 (reported on 16.9% of returns)
Here:
$2,062
State:
$6,225
(% of AGI for various income ranges: 1.2% for AGIs below $25k, 0.8% for AGIs $25k-50k, 0.9% for AGIs $50k-75k, 0.5% for AGIs $75k-100k, 1.6% for AGIs $100k-200k)
Net capital gain/loss in AGI: +$3,671 (reported on 13.6% of returns)
Here:
+$3,671
State:
+$9,326
(% of AGI for various income ranges: 0.4% for AGIs $25k-50k, 1.2% for AGIs $50k-75k, 1.3% for AGIs $75k-100k, 4.3% for AGIs $100k-200k)
Profit/loss from business: +$4,100 (reported on 14.3% of returns)
Here:
+$4,100
State:
+$11,523
(% of AGI for various income ranges: 4.2% for AGIs below $25k, 2.0% for AGIs $25k-50k, 1.5% for AGIs $50k-75k, 0.6% for AGIs $100k-200k)
Taxable individual retirement arrangement distribution: $10,380 (reported on 13.0% of returns)
49746:
$10,380
Michigan:
$15,298
(% of AGI for various income ranges: 4.2% for AGIs below $25k, 3.7% for AGIs $25k-50k, 2.8% for AGIs $50k-75k, 4.7% for AGIs $75k-100k, 4.3% for AGIs $100k-200k)
Total itemized deductions: $16,926 (24% of AGI, reported on 17.5% of returns)
Here:
$16,926
State:
$21,628
Here:
24.3% of AGI
State:
18.4% of AGI
(% of AGI for various income ranges: 7.6% for AGIs below $25k, 5.6% for AGIs $25k-50k, 7.5% for AGIs $50k-75k, 9.6% for AGIs $75k-100k, 12.9% for AGIs $100k-200k)
Charity contributions: $2,595 (reported on 13.0% of returns)
Here:
$2,595
State:
$4,225
(% of AGI for various income ranges: 0.5% for AGIs below $25k, 0.7% for AGIs $25k-50k, 1.0% for AGIs $50k-75k, 0.5% for AGIs $75k-100k, 1.9% for AGIs $100k-200k)
Taxes paid: $4,941 (reported on 17.5% of returns)
49746:
$4,941
State:
$8,327
(% of AGI for various income ranges: 1.5% for AGIs below $25k, 1.5% for AGIs $25k-50k, 2.1% for AGIs $50k-75k, 2.6% for AGIs $75k-100k, 4.9% for AGIs $100k-200k)
Earned income credit: $1,861 (reported on 20.1% of returns)
Here:
$1,861
State:
$2,306
(% of AGI for various income ranges: 4.6% for AGIs below $25k, 1.2% for AGIs $25k-50k)
Percentage of individuals using paid preparers for their 2012 taxes: 61.0%
Here:
61%
State:
57%
(% for various income ranges: 53.2% for AGIs below $25k, 65.0% for AGIs $25k-50k, 65.0% for AGIs $50k-75k, 80.0% for AGIs $75k-100k, 85.7% for AGIs $100k-200k)
Averages for the 2004 tax year for zip code 49746, filed in 2005:
Average Adjusted Gross Income (AGI) in 2004: $29,493 (Individual Income Tax Returns)
Here:
$29,493
State:
$48,204
Salary/wage: $24,493 (reported on 79.8% of returns)
Here:
$24,493
State:
$42,791
(% of AGI for various income ranges: 107.3% for AGIs below $10k, 65.6% for AGIs $10k-25k, 69.1% for AGIs $25k-50k, 69.2% for AGIs $50k-75k, 57.7% for AGIs $75k-100k, 50.4% for AGIs over 100k)
Taxable interest for individuals: $1,274 (reported on 47.0% of returns)
This zip code:
$1,274
Michigan:
$1,725
(% of AGI for various income ranges: 9.0% for AGIs below $10k, 2.0% for AGIs $10k-25k, 1.6% for AGIs $25k-50k, 1.4% for AGIs $50k-75k, 1.6% for AGIs $75k-100k, 3.2% for AGIs over 100k)
Taxable dividends: $1,730 (reported on 18.8% of returns)
Here:
$1,730
State:
$3,420
(% of AGI for various income ranges: 3.8% for AGIs below $10k, 1.1% for AGIs $10k-25k, 0.7% for AGIs $25k-50k, 0.7% for AGIs $50k-75k, 0.7% for AGIs $75k-100k, 2.7% for AGIs over 100k)
Net capital gain/loss: +$2,950 (reported on 17.0% of returns)
Here:
+$2,950
State:
+$8,532
(% of AGI for various income ranges: -3.7% for AGIs below $10k, 1.0% for AGIs $10k-25k, 0.7% for AGIs $25k-50k, 1.4% for AGIs $50k-75k, 2.5% for AGIs $75k-100k, 6.6% for AGIs over 100k)
Profit/loss from business: +$3,702 (reported on 15.6% of returns)
Here:
+$3,702
State:
+$9,547
(% of AGI for various income ranges: 6.9% for AGIs below $10k, 4.8% for AGIs $10k-25k, 2.8% for AGIs $25k-50k, 0.2% for AGIs $50k-75k, -0.9% for AGIs $75k-100k)
IRA payment deduction: $2,236 (reported on 3.3% of returns)
49746:
$2,236
Michigan:
$2,875
Total itemized deductions: $15,557 (26% of AGI, reported on 18.6% of returns)
Here:
$15,557
State:
$18,509
Here:
26.3% of AGI
State:
20.7% of AGI
(% of AGI for various income ranges: 15.8% for AGIs below $10k, 5.8% for AGIs $10k-25k, 7.7% for AGIs $25k-50k, 11.4% for AGIs $50k-75k, 16.4% for AGIs $75k-100k, 12.5% for AGIs over 100k)
Charity contributions deductions: $2,036 (3% of AGI, reported on 15.1% of returns)
Here:
$2,036
State:
$3,365
Here:
3.2% of AGI
State:
3.6% of AGI
(% of AGI for various income ranges: 0.5% for AGIs $10k-25k, 0.8% for AGIs $25k-50k, 1.1% for AGIs $50k-75k, 1.7% for AGIs $75k-100k, 2.3% for AGIs over 100k)
Total tax: $3,215 (reported on 68.9% of returns)
49746:
$3,215
State:
$7,691
(% of AGI for various income ranges: 2.3% for AGIs below $10k, 3.9% for AGIs $10k-25k, 5.8% for AGIs $25k-50k, 7.7% for AGIs $50k-75k, 9.0% for AGIs $75k-100k, 16.8% for AGIs over 100k)
Earned income credit: $1,676 (reported on 17.4% of returns)
Here:
$1,676
State:
$1,737
Percentage of individuals using paid preparers for their 2004 taxes: 66.2%
Here:
66%
State:
60%
(% for various income ranges: 60.8% for AGIs below $10k, 64.7% for AGIs $10k-25k, 69.1% for AGIs $25k-50k, 70.7% for AGIs $50k-75k, 80.0% for AGIs $75k-100k, 67.6% for AGIs over 100k)
Likely homosexual households (counted as self-reported same-sex unmarried-partner households)
Lesbian couples: 0.1% of all households
Gay men: 0.0% of all households
Household received Food Stamps/SNAP in the past 12 months: 328 Household did not receive Food Stamps/SNAP in the past 12 months: 1,429
Women who had a birth in the past 12 months: 22 (20 now married, 2 unmarried) Women who did not have a birth in the past 12 months: 548 (207 now married, 341 unmarried)
Housing units in zip code 49746 with a mortgage: 724 (41 second mortgage, 26 both second mortgage and home equity loan) Houses without a mortgage: 15
Median monthly owner costs for units with a mortgage: $947 Median monthly owner costs for units without a mortgage: $430
Residents with income below the poverty level in 2022:
This zip code:
17.6%
Whole state:
13.4%
Residents with income below 50% of the poverty level in 2022:
This zip code:
11.9%
Whole state:
6.9%
Median number of rooms in houses and condos:
Here:
6.0
State:
6.5
Median number of rooms in apartments:
Here:
4.4
State:
4.3
Notable locations in this zip code not listed on our city pages
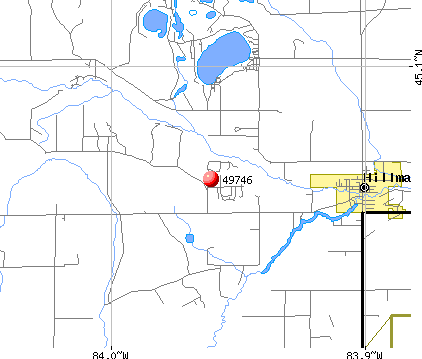
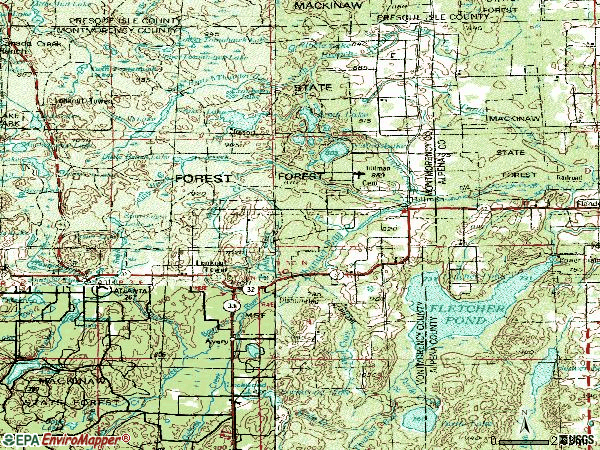
Notable locations in zip code 49746: Ess Lake State Forest Campground (A), South Bay Campground (B), Thunder Bay Golf Resort (C), Montmorency Township Hall (D), Hillman Wright Library (E), Hillman Fire and Ambulance Department (F). Display/hide their locations on the map
Churches in zip code 49746 include: Pleasant Valley Church (A), Saint Johns Church (B), Calvary Episcopal Church (C), Saint John Lutheran Church (D), Pleasant Valley Free Methodist Church (E), Saint Augustine Church (F), Hillman United Methodist Church (G), Hillman Free Methodist Church (H), Maple Grove Brethren in Christ Church (I). Display/hide their locations on the map
Cemeteries: Hillman Cemetery (1), Saint Augustine Cemetery (2), Saint Johns Cemetery (3), Rust Cemetery (4), Montmorency Cemetery (5). Display/hide their locations on the map
Lakes and reservoirs: Ribble Lake (A), Turtle Lake (B), Lower Tomahawk Lake (C), Lost Lake (D), Upper Tomahawk Lake (E), Long Lake (F), Lockwood Lake (G), Horseshoe Lake (H). Display/hide their locations on the map
Rivers and creeks: Bullock Creek (A), Weber Creek (B), Upper South Branch Thunder Bay River (C), Turtle Creek (D), Grass Creek (E), Quinn Creek (F), Sucker Creek (G), Jewett Creek (H), Brush Creek (I). Display/hide their locations on the map
365 married couples with children.
127 single-parent households (73 men, 54 women).
99.6% of residents of 49746 zip code speak English at home.
0.1% of residents speak Spanish at home (40% very well, 20% well, 40% not well).
0.5% of residents speak other Indo-European language at home (50% very well, 11% well, 39% not well).
0.1% of residents speak other language at home (100% very well).
Foreign born population: 24 (0.7%) (84.0% of them are naturalized citizens)
This zip code:
0.7%
Whole state:
6.9%
25%North Macedonia (Macedonia)
21%Sweden
17%Liberia
4%Honduras
31%German
15%American
14%English
6%Polish
5%French
4%Irish
3%European
Year of entry for the foreign-born population
22010 or later
32000 to 2009
111990 to 1999
15Before 1990
Major facilities with environmental interests located in this zip code:
MI DEPT/TRANSPORTATION BRIDGE (M-32 OVER THUNDER BAY RIVER in HILLMAN, MI)
(Resource Conservation and Recovery Act (tracking hazardous waste)) Organizations: MICH DEPT OF TRANSPORTATION (CONTACT/OPERATOR)
Alternative names: MIDOT BRIDGE M-32 OVER THUNDER BAY RIVER
MI DEPT/TRANSPORTATION BRIDGE B02-60011 (M-33 OVER THUNDER BAY CREEK in HILLMAN, MI)
(Resource Conservation and Recovery Act (tracking hazardous waste)) Organizations: MICH DEPT OF TRANSPORTATION (CONTACT/OPERATOR)
Alternative names: MI DEPT/TRANS BRIDGE B02-60011
GREATER HILLMAN ENTERPRISES LLC (27400 M-32 in HILLMAN, MI)
(Resource Conservation and Recovery Act (tracking hazardous waste))
MI DEPT/TRANSPORTATION (410 N STATE ST in HILLMAN, MI)
Conditionally Exempt Small Quantity Generators, less than 100 kg/month of hazardous waste (Resource Conservation and Recovery Act (tracking hazardous waste)) Organizations: MICH DEPT OF TRANSPORTATION (CONTACT/OPERATOR)
Alternative names: MIDOT MAINT DIV
Housing units lacking complete plumbing facilities: 4.4% Housing units lacking complete kitchen facilities: 4.0%
49.4%Utility gas
27.5%Bottled, tank, or LP gas
13.0%Wood
5.0%Electricity
3.5%Fuel oil, kerosene, etc.
1.3%Other fuel
Population in 1990: 3,902.
Place of birth for U.S.-born residents:
This state: 3,152
Northeast: 61
Midwest: 121
South: 101
West: 55
64% of the 49746 zip code residents lived in the same house 5 years ago. Out of people who lived in different houses, 41% lived in this county. Out of people who lived in different counties, 50% lived in Michigan.
89% of the 49746 zip code residents lived in the same house 1 year ago. Out of people who lived in different houses, 38% moved from this county. Out of people who lived in different houses, 34% moved from different county within same state. Out of people who lived in different houses, 27% moved from different state. Out of people who lived in different houses, 2% moved from abroad.
Private vs. public school enrollment:
Students in private schools in grades 1 to 8 (elementary and middle school): 22
Here:
8.4%
Michigan:
12.4%
Students in private schools in grades 9 to 12 (high school): 7
Here:
4.3%
Michigan:
9.8%
Students in private undergraduate colleges: 22
Here:
34.4%
Michigan:
14.9%
Occupation by median earnings in the past 12 months ($)
54,078Farming, fishing, and forestry occupations
48,570Health diagnosing and treating practitioners and other technical occupations
48,066Education, training, and library occupations
43,595Transportation occupations
39,462Health technologists and technicians
36,836Installation, maintenance, and repair occupations
Companies with federal contracts located in this zip code:
ZIMAX INDUSTRIAL PRODUCTS, INC (21709 COUNTY ROAD 624 in HILLMAN, MI; small business) : $6,064 in 3 contractsin 2005
$47,381 with Navy for Bars and Rods. Signed on 2005-05-14. Completion date: 2005-09-19.
$6,064 with Army for Fans, Air Circulators, and Blower Equipment. Signed on 2005-03-31. Completion date: 2005-05-16.
-$47,381 with Navy for Bars and Rods. Signed on 2005-08-05. Completion date: 2005-09-19.
CORDES EXCAVATION INC (704 E PROGRESS ST in HILLMAN, MI; small business)
$200 with Army for Maintenance, Repair or Alteration of Real Property -- Air Traffic Control Training Facilities. Signed on 2005-09-29. Completion date: 2005-09-30.
Top industries in this zip code by the number of employees in 2005:
Health Care and Social Assistance: Nursing Care Facilities (100-249 employees: 1 establishment)
Health Care and Social Assistance: Offices of Physicians (except Mental Health Specialists) (20-49: 1)
Arts, Entertainment, and Recreation: Golf Courses and Country Clubs (20-49: 1)
Administrative and Support and Waste Management and Remediation Services: Professional Employer Organizations (20-49: 1)
Other Services (except Public Administration): Religious Organizations (5-9: 1, 1-4: 5)
People in group quarters in 2010:
71 people in nursing facilities/skilled-nursing facilities
34 people in group homes intended for adults
8 people in workers' group living quarters and job corps centers
People in group quarters in 2000:
83 people in nursing homes
9 people in homes for the mentally retarded
7 people in other group homes
6 people in other noninstitutional group quarters
2 people in other nonhousehold living situations
Fatal accident statistics in 2014:
Fatal accident count: 1
Vehicles involved in fatal accidents: 2
Fatal accidents caused by drunken drivers: 1
Fatalities: 1
Persons involved in fatal accidents: 4
Pedestrians involved in fatal accidents: 0
Fatal accident statistics in 2013:
Fatal accident count: 2
Vehicles involved in fatal accidents: 3
Fatal accidents caused by drunken drivers: 1
Fatalities: 2
Persons involved in fatal accidents: 3
Pedestrians involved in fatal accidents: 0
2002 - 2018 National Fire Incident Reporting System (NFIRS) incidents
According to the data from the years 2002 - 2018 the average number of fires per year is 20. The highest number of reported fires - 34 took place in 2012, and the least - 9 in 2018. The data has a decreasing trend.
When looking into fire subcategories, the most incidents belonged to: Structure Fires (47.9%), and Outside Fires (36.9%).
Fire incident types reported to NFIRS in Zip Code 49746


 Nearest zip codes: 49753, 49709, 49743, 48619, 49744, 49776.


 According to the data from the years 2002 - 2018 the average number of fires per year is 20. The highest number of reported fires - 34 took place in 2012, and the least - 9 in 2018. The data has a decreasing trend.
 When looking into fire subcategories, the most incidents belonged to: Structure Fires (47.9%), and Outside Fires (36.9%).