Estimated zip code population in 2022: 1,459 Zip code population in 2010: 1,446 Zip code population in 2000: 1,656
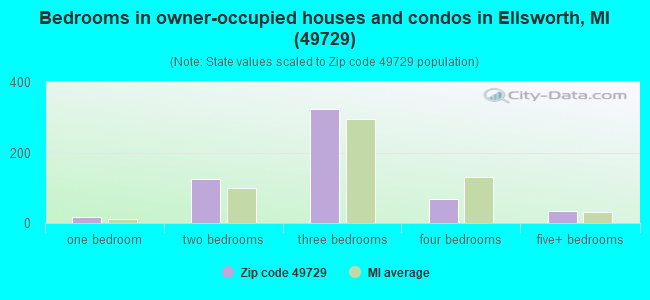
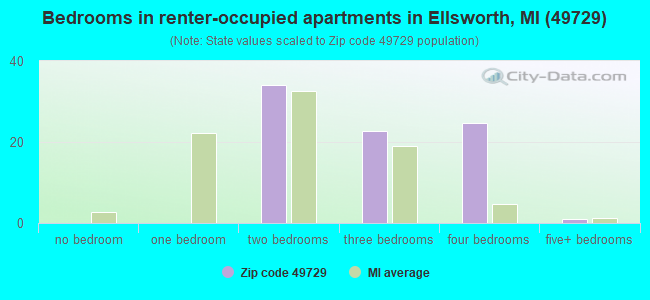
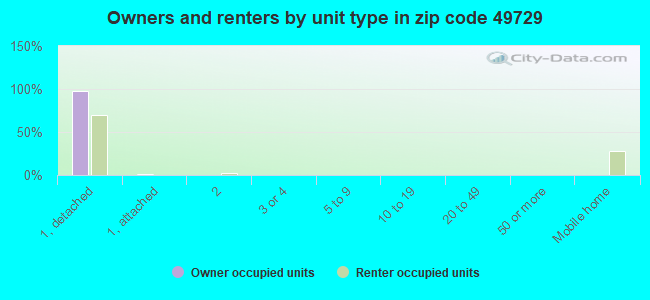
Houses and condos: 1,015 Renter-occupied apartments: 81
% of renters here:
13%
State:
27%
March 2022 cost of living index in zip code 49729: 81.7 (low, U.S. average is 100)
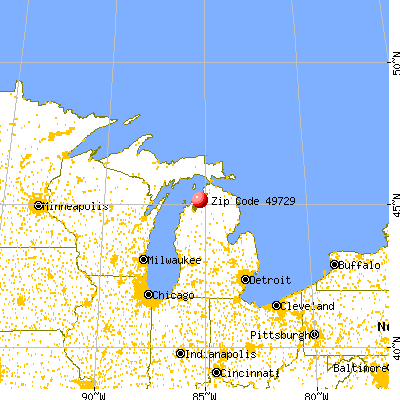
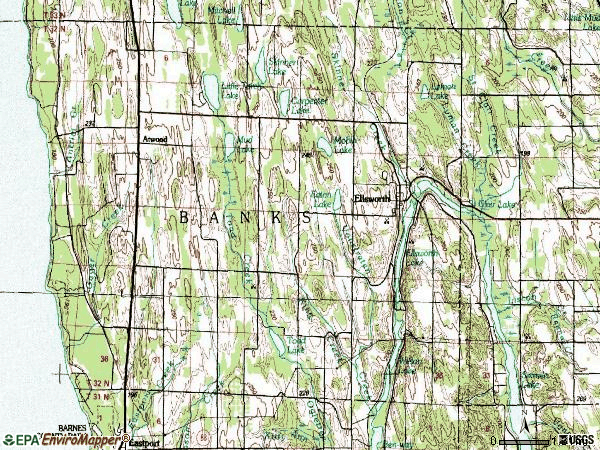
Land area: 37.8 sq. mi. Water area: 5.3 sq. mi.
Population density: 39 people per square mile
(very low).
OSM Map
General Map
Google Map
MSN Map
OSM Map
General Map
Google Map
MSN Map
OSM Map
General Map
Google Map
MSN Map
OSM Map
General Map
Google Map
MSN Map
Please wait while loading the map...
Real estate property taxes paid for housing units in 2022:
This zip code:
0.8% ($1,622)
Michigan:
1.2% ($2,746)
Median real estate property taxes paid for housing units with mortgages in 2022: $1,629 (0.9%) Median real estate property taxes paid for housing units with no mortgage in 2022: $1,644 (0.7%)
Business Search- 14 Million verified businesses
Males: 760
(52.1%)
Females: 698
(47.9%)
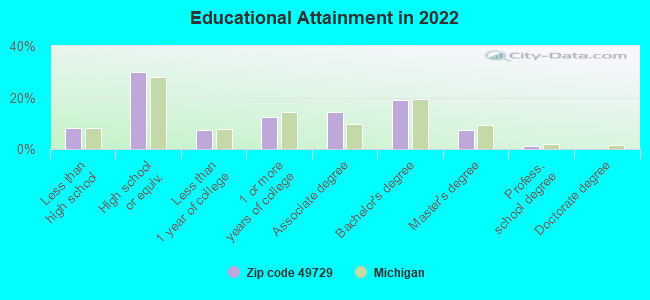
For population 25 years and over in 49729:
High school or higher: 90.7%
Bachelor's degree or higher: 27.2%
Graduate or professional degree: 8.5%
Unemployed: 4.7%
Mean travel time to work (commute): 22.8 minutes
For population 15 years and over in 49729:
Never married: 25.1%
Now married: 58.2%
Separated: 1.5%
Widowed: 7.6%
Divorced: 7.5%
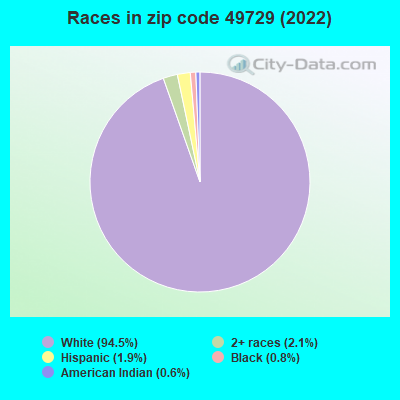
Zip code 49729 compared to state average:
Black race population percentage significantly below state average.
Hispanic race population percentage below state average.
Median age above state average.
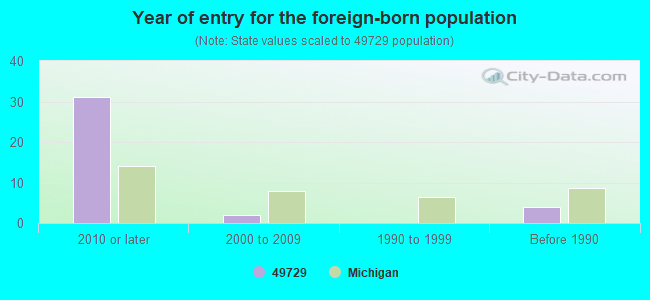
Foreign-born population percentage significantly below state average.
Averages for the 2020 tax year for zip code 49729, filed in 2021:
Average Adjusted Gross Income (AGI) in 2020: $55,090 (Individual Income Tax Returns)
Here:
$55,090
State:
$68,945
Salary/wage: $46,503 (reported on 76.2% of returns)
Here:
$46,503
State:
$57,142
(% of AGI for various income ranges: 891.1% for AGIs below $25k, 3266.5% for AGIs $25k-50k, 6211.2% for AGIs $50k-75k, 9790.0% for AGIs $75k-100k, 18761.7% for AGIs $100k-200k)
Taxable interest for individuals: $854 (reported on 32.5% of returns)
This zip code:
$854
Michigan:
$1,630
(% of AGI for various income ranges: 16.3% for AGIs below $25k, 28.2% for AGIs $25k-50k, 12.5% for AGIs $50k-75k, 20.0% for AGIs $75k-100k, 205.0% for AGIs $100k-200k)
Ordinary dividends: $2,646 (reported on 16.2% of returns)
Here:
$2,646
State:
$6,972
(% of AGI for various income ranges: 40.0% for AGIs below $25k, 162.5% for AGIs $50k-75k, 230.0% for AGIs $100k-200k)
Net capital gain/loss in AGI: +$6,458 (reported on 15.0% of returns)
Here:
+$6,458
State:
+$20,064
(% of AGI for various income ranges: 13.7% for AGIs below $25k, 37.1% for AGIs $25k-50k, 284.0% for AGIs $75k-100k, 906.7% for AGIs $100k-200k)
Profit/loss from business: +$7,250 (reported on 15.0% of returns)
Here:
+$7,250
State:
+$11,172
(% of AGI for various income ranges: 135.8% for AGIs below $25k, 140.0% for AGIs $25k-50k, 417.5% for AGIs $50k-75k, 66.7% for AGIs $100k-200k)
Taxable individual retirement arrangement distribution: $15,956 (reported on 11.2% of returns)
49729:
$15,956
Michigan:
$19,803
(% of AGI for various income ranges: 184.2% for AGIs below $25k, 651.2% for AGIs $50k-75k, 941.7% for AGIs $100k-200k)
Total itemized deductions: $29,667 (reported on 3.8% of returns)
Here:
$29,667
State:
$34,117
(% of AGI for various income ranges: 1483.3% for AGIs $100k-200k)
Charity contributions: $11,650 (reported on 2.5% of returns)
Here:
$11,650
State:
$13,548
(% of AGI for various income ranges: 291.2% for AGIs $50k-75k)
Taxes paid: $7,933 (reported on 3.8% of returns)
49729:
$7,933
State:
$7,972
(% of AGI for various income ranges: 396.7% for AGIs $100k-200k)
Earned income credit: $2,100 (reported on 12.5% of returns)
Here:
$2,100
State:
$2,251
(% of AGI for various income ranges: 61.6% for AGIs below $25k, 54.7% for AGIs $25k-50k)
Percentage of individuals using paid preparers for their 2020 taxes: 92.5%
Here:
92%
State:
93%
(% for various income ranges: 96.4% for AGIs below $25k, 90.5% for AGIs $25k-50k, 91.7% for AGIs $50k-75k, 87.5% for AGIs $75k-100k, 111.1% for AGIs $100k-200k, 0.0% for AGIs over 200k)
Averages for the 2012 tax year for zip code 49729, filed in 2013:
Average Adjusted Gross Income (AGI) in 2012: $49,119 (Individual Income Tax Returns)
Here:
$49,119
State:
$55,609
Salary/wage: $37,105 (reported on 81.2% of returns)
Here:
$37,105
State:
$46,782
(% of AGI for various income ranges: 65.9% for AGIs below $25k, 72.5% for AGIs $25k-50k, 72.9% for AGIs $50k-75k, 73.3% for AGIs $75k-100k, 42.2% for AGIs $100k-200k)
Taxable interest for individuals: $922 (reported on 39.1% of returns)
This zip code:
$922
Michigan:
$1,491
(% of AGI for various income ranges: 2.0% for AGIs below $25k, 0.7% for AGIs $25k-50k, 0.8% for AGIs $50k-75k, 0.6% for AGIs $75k-100k, 0.4% for AGIs $100k-200k)
Ordinary dividends: $2,690 (reported on 14.5% of returns)
Here:
$2,690
State:
$6,225
(% of AGI for various income ranges: 0.6% for AGIs below $25k, 1.3% for AGIs $25k-50k, 1.2% for AGIs $50k-75k, 1.6% for AGIs $75k-100k)
Net capital gain/loss in AGI: +$21,978 (reported on 13.0% of returns)
Here:
+$21,978
State:
+$9,326
(% of AGI for various income ranges: 0.7% for AGIs $50k-75k, 16.2% for AGIs $100k-200k)
Profit/loss from business: +$7,755 (reported on 15.9% of returns)
Here:
+$7,755
State:
+$11,523
(% of AGI for various income ranges: 7.8% for AGIs below $25k, 3.1% for AGIs $25k-50k, 5.9% for AGIs $50k-75k)
Taxable individual retirement arrangement distribution: $12,212 (reported on 11.6% of returns)
49729:
$12,212
Michigan:
$15,298
(% of AGI for various income ranges: 4.9% for AGIs below $25k, 3.9% for AGIs $25k-50k, 8.5% for AGIs $50k-75k)
Total itemized deductions: $19,333 (17% of AGI, reported on 21.7% of returns)
Here:
$19,333
State:
$21,628
Here:
16.9% of AGI
State:
18.4% of AGI
(% of AGI for various income ranges: 11.9% for AGIs $25k-50k, 8.9% for AGIs $50k-75k, 14.2% for AGIs $75k-100k, 6.5% for AGIs $100k-200k)
Charity contributions: $3,831 (reported on 18.8% of returns)
Here:
$3,831
State:
$4,225
(% of AGI for various income ranges: 1.7% for AGIs $25k-50k, 1.9% for AGIs $50k-75k, 2.4% for AGIs $75k-100k, 1.1% for AGIs $100k-200k)
Taxes paid: $7,506 (reported on 23.2% of returns)
49729:
$7,506
State:
$8,327
(% of AGI for various income ranges: 2.8% for AGIs $25k-50k, 2.5% for AGIs $50k-75k, 4.0% for AGIs $75k-100k, 5.3% for AGIs $100k-200k)
Earned income credit: $1,808 (reported on 18.8% of returns)
Here:
$1,808
State:
$2,306
(% of AGI for various income ranges: 4.7% for AGIs below $25k, 1.2% for AGIs $25k-50k)
Percentage of individuals using paid preparers for their 2012 taxes: 58.0%
Here:
58%
State:
57%
(% for various income ranges: 53.3% for AGIs below $25k, 58.8% for AGIs $25k-50k, 54.5% for AGIs $50k-75k, 83.3% for AGIs $75k-100k, 60.0% for AGIs $100k-200k)
Averages for the 2004 tax year for zip code 49729, filed in 2005:
Average Adjusted Gross Income (AGI) in 2004: $36,604 (Individual Income Tax Returns)
Here:
$36,604
State:
$48,204
Salary/wage: $31,990 (reported on 85.5% of returns)
Here:
$31,990
State:
$42,791
(% of AGI for various income ranges: 108.9% for AGIs below $10k, 75.8% for AGIs $10k-25k, 79.7% for AGIs $25k-50k, 82.4% for AGIs $50k-75k, 69.8% for AGIs $75k-100k, 54.7% for AGIs over 100k)
Taxable interest for individuals: $1,098 (reported on 45.7% of returns)
This zip code:
$1,098
Michigan:
$1,725
(% of AGI for various income ranges: 7.7% for AGIs below $10k, 2.0% for AGIs $10k-25k, 0.9% for AGIs $25k-50k, 1.0% for AGIs $50k-75k, 1.4% for AGIs $75k-100k, 1.5% for AGIs over 100k)
Taxable dividends: $1,283 (reported on 16.4% of returns)
Here:
$1,283
State:
$3,420
(% of AGI for various income ranges: 2.3% for AGIs below $10k, 1.7% for AGIs $10k-25k, 0.8% for AGIs $25k-50k, 0.2% for AGIs $50k-75k, 0.4% for AGIs $75k-100k, 0.1% for AGIs over 100k)
Net capital gain/loss: +$5,163 (reported on 14.2% of returns)
Here:
+$5,163
State:
+$8,532
(% of AGI for various income ranges: 1.8% for AGIs below $10k, -0.3% for AGIs $10k-25k, 0.5% for AGIs $25k-50k, -0.1% for AGIs $50k-75k, -0.3% for AGIs $75k-100k, 10.6% for AGIs over 100k)
Profit/loss from business: +$4,413 (reported on 15.1% of returns)
Here:
+$4,413
State:
+$9,547
(% of AGI for various income ranges: 13.7% for AGIs below $10k, 1.1% for AGIs $10k-25k, 2.4% for AGIs $25k-50k, 0.0% for AGIs $50k-75k, 4.5% for AGIs $75k-100k)
IRA payment deduction: $1,688 (reported on 2.3% of returns)
49729:
$1,688
Michigan:
$2,875
Total itemized deductions: $15,036 (24% of AGI, reported on 28.0% of returns)
Here:
$15,036
State:
$18,509
Here:
23.6% of AGI
State:
20.7% of AGI
(% of AGI for various income ranges: 28.7% for AGIs below $10k, 10.2% for AGIs $10k-25k, 10.2% for AGIs $25k-50k, 10.4% for AGIs $50k-75k, 12.8% for AGIs $75k-100k, 12.5% for AGIs over 100k)
Charity contributions deductions: $2,975 (4% of AGI, reported on 23.3% of returns)
Here:
$2,975
State:
$3,365
Here:
4.4% of AGI
State:
3.6% of AGI
(% of AGI for various income ranges: 1.5% for AGIs $10k-25k, 1.8% for AGIs $25k-50k, 1.6% for AGIs $50k-75k, 3.4% for AGIs $75k-100k, 1.7% for AGIs over 100k)
Total tax: $4,556 (reported on 70.9% of returns)
49729:
$4,556
State:
$7,691
(% of AGI for various income ranges: 3.8% for AGIs below $10k, 3.8% for AGIs $10k-25k, 6.0% for AGIs $25k-50k, 8.2% for AGIs $50k-75k, 10.3% for AGIs $75k-100k, 16.0% for AGIs over 100k)
Earned income credit: $1,610 (reported on 15.2% of returns)
Here:
$1,610
State:
$1,737
Percentage of individuals using paid preparers for their 2004 taxes: 60.6%
Here:
61%
State:
60%
(% for various income ranges: 44.8% for AGIs below $10k, 62.3% for AGIs $10k-25k, 66.7% for AGIs $25k-50k, 62.7% for AGIs $50k-75k, 71.1% for AGIs $75k-100k, 80.0% for AGIs over 100k)
Household received Food Stamps/SNAP in the past 12 months: 32 Household did not receive Food Stamps/SNAP in the past 12 months: 609
Women who had a birth in the past 12 months: 21 (12 now married, 8 unmarried) Women who did not have a birth in the past 12 months: 267 (139 now married, 127 unmarried)
Housing units in zip code 49729 with a mortgage: 331 (13 second mortgage, 9 both second mortgage and home equity loan) Houses without a mortgage: 18
Median monthly owner costs for units with a mortgage: $1,120 Median monthly owner costs for units without a mortgage: $519
Residents with income below the poverty level in 2022:
This zip code:
2.8%
Whole state:
13.4%
Residents with income below 50% of the poverty level in 2022:
This zip code:
2.0%
Whole state:
6.9%
Median number of rooms in houses and condos:
Here:
6.0
State:
6.5
Median number of rooms in apartments:
Here:
6.1
State:
4.3
Notable locations in this zip code not listed on our city pages
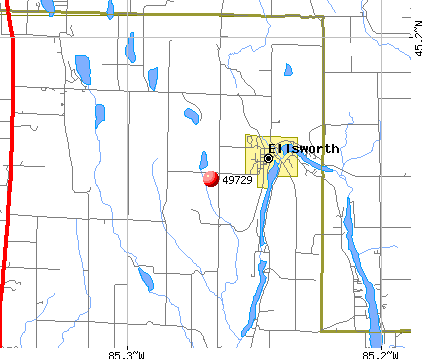
Notable locations in zip code 49729: Antrim Dells Golf Course (A), Wielands Whistling Pines Campground (B), Banks Township Hall (C), Banks Township Fire Department Station 1 Headquarters (D), Banks Township Fire Department Station 2 (E). Display/hide their locations on the map
Churches in zip code 49729 include: Gospel Center Church (A), Ellsworth Wesleyan Church (B), Christian Reformed Church (C), Atwood Church (D), The Wayside Chapel (E). Display/hide their locations on the map
Lakes: Lymans Lake (A), Little Torch Lake (B), Wilson Lake (C), Mud Lake (D), Ellsworth Lake (E), Sixmile Lake (F), Saint Clair Lake (G), Toad Lake (H). Display/hide their locations on the map
In group quarters: 32 (-1 institutionalized population)
Size of family households: 240 2-persons, 79 3-persons, 76 4-persons, 11 5-persons, 16 6-persons, 10 7-or-more-persons
Size of nonfamily households: 150 1-person, 63 2-persons
218 married couples with children.
32 single-parent households (23 men, 9 women).
94.4% of residents of 49729 zip code speak English at home.
2.7% of residents speak Spanish at home (21% very well, 66% well, 13% not well).
2.7% of residents speak other Indo-European language at home (100% very well).
0.1% of residents speak other language at home (100% not well).
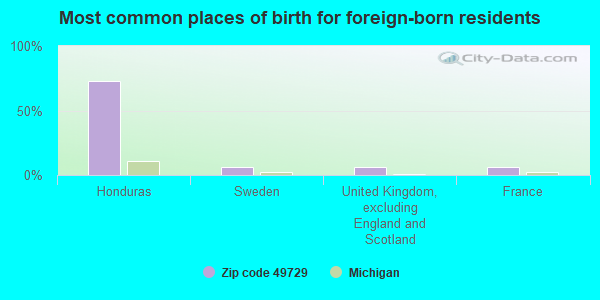
Foreign born population: 32 (2.2%) (25.2% of them are naturalized citizens)
This zip code:
2.2%
Whole state:
6.9%
73%Honduras
6%Sweden
6%United Kingdom, excluding England and Scotland
6%France
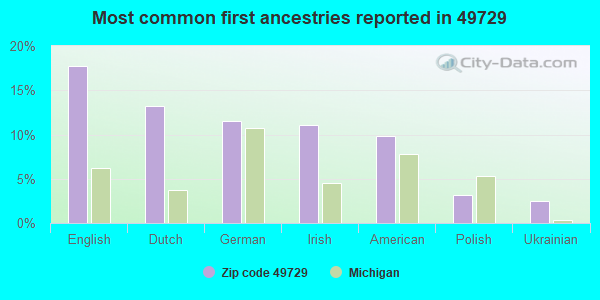
18%English
13%Dutch
12%German
11%Irish
10%American
3%Polish
3%Ukrainian
Year of entry for the foreign-born population
312010 or later
22000 to 2009
01990 to 1999
4Before 1990
Facilities with environmental interests located in this zip code:
ELLSWORTH COMMUNITY SCHOOL (9467 PARK STREET in ELLSWORTH, MI)
(National Center for Education Statistics) - STATE ID-05859 Organizations: ELLSWORTH COMMUNITY SCHOOLS (SCHOOL DISTRICT)
CRITERIA AND HAZARDOUS AIR POLLUTANT INVENTORY (Inventory of air pollution sources) National Pollutant Discharge Elimination System NON-MAJOR (Tracking pollutant discharge elimination systems) - permit Business SIC classification: CONSTRUCTION SAND AND GRAVEL Organizations: DRENTH BROTHERS, INCORPORATED (CONTACT/OWNER)
ELL-TRON MFG CO (9709 MAIN ST in ELLSWORTH, MI)
(Resource Conservation and Recovery Act (tracking hazardous waste))
DRENTH BROTHERS, INC. (9448 SIX MILE LAKE RD in ELLSWORTH, MI)
CRITERIA AND HAZARDOUS AIR POLLUTANT INVENTORY (Inventory of air pollution sources) Business SIC classification: CONSTRUCTION SAND AND GRAVEL
ELLSWORTH FARMERS CO-OP (6927 CENTER BOX 98 in ELLSWORTH, MI)
COMPLIANCE ACTIVITY (Tracking inspections of insecticide, fungicide, and rodenticide, and toxic substances)
Housing units lacking complete plumbing facilities: 3.9% Housing units lacking complete kitchen facilities: 4.0%
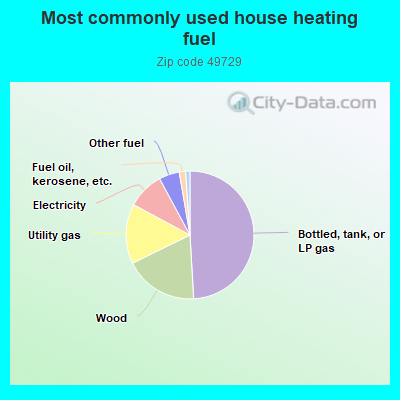
49.3%Bottled, tank, or LP gas
18.7%Wood
15.2%Utility gas
9.3%Electricity
5.2%Other fuel
1.6%Fuel oil, kerosene, etc.
1.1%Coal or coke
Population in 1990: 1,223. Population change in the 1990s: +433 (+35.4%).
Place of birth for U.S.-born residents:
This state: 1,209
Northeast: 32
Midwest: 104
South: 59
West: 17
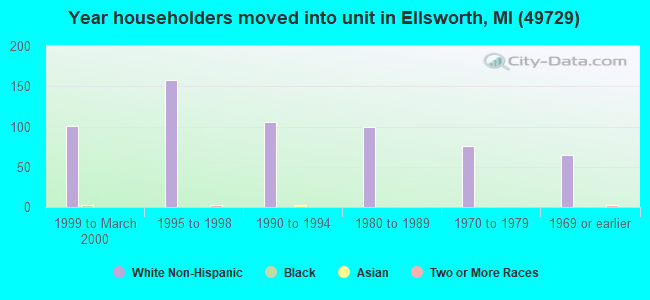
57% of the 49729 zip code residents lived in the same house 5 years ago. Out of people who lived in different houses, 36% lived in this county. Out of people who lived in different counties, 50% lived in Michigan.
95% of the 49729 zip code residents lived in the same house 1 year ago. Out of people who lived in different houses, 4% moved from this county. Out of people who lived in different houses, 45% moved from different county within same state. Out of people who lived in different houses, 4% moved from different state. Out of people who lived in different houses, 55% moved from abroad.
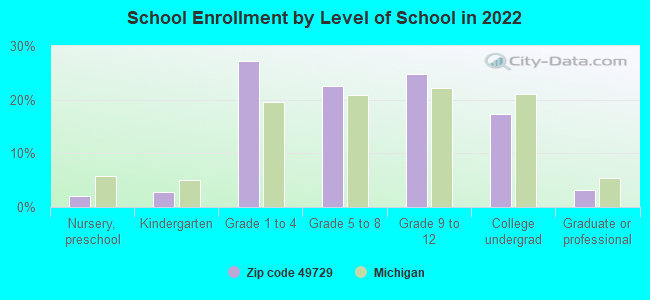
Private vs. public school enrollment:
Students in private schools in grades 1 to 8 (elementary and middle school): 74
Here:
51.3%
Michigan:
12.4%
Students in private schools in grades 9 to 12 (high school): 18
Here:
26.4%
Michigan:
9.8%
Students in private undergraduate colleges: 16
Here:
33.1%
Michigan:
14.9%
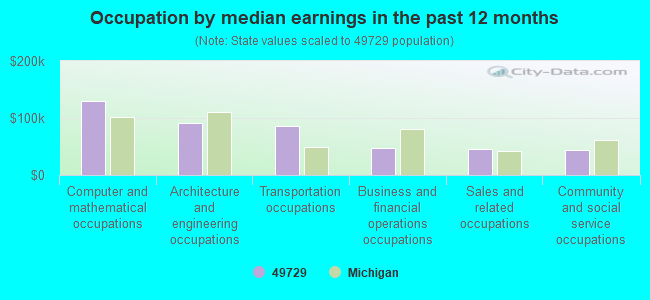
Occupation by median earnings in the past 12 months ($)
129,648Computer and mathematical occupations
91,569Architecture and engineering occupations
86,603Transportation occupations
47,184Business and financial operations occupations
46,368Sales and related occupations
43,068Community and social service occupations
Top industries in this zip code by the number of employees in 2005:
Construction: New Single-Family Housing Construction (except Operative Builders) (10-19: 1, 5-9: 1, 1-4: 4)
Mining: Construction Sand and Gravel Mining (10-19: 1)
Accommodation and Food Services: Limited-Service Restaurants (5-9: 1, 1-4: 1)
Construction: Residential Remodelers (5-9: 1)
Construction: Site Preparation Contractors (1-4: 3)
People in group quarters in 2010:
5 people in workers' group living quarters and job corps centers
People in group quarters in 2000:
23 people in unknown juvenile institutions
13 people in other noninstitutional group quarters
2002 - 2018 National Fire Incident Reporting System (NFIRS) incidents
Based on the data from the years 2002 - 2018 the average number of fire incidents per year is 9. The highest number of reported fires - 17 took place in 2012, and the least - 4 in 2018. The data has a dropping trend.
When looking into fire subcategories, the most reports belonged to: Structure Fires (56.5%), and Outside Fires (35.4%).
Fire incident types reported to NFIRS in Zip Code 49729


 Nearest zip codes: 49622, 49627, 49720, 49648, 49727, 49615.


 Based on the data from the years 2002 - 2018 the average number of fire incidents per year is 9. The highest number of reported fires - 17 took place in 2012, and the least - 4 in 2018. The data has a dropping trend.
 When looking into fire subcategories, the most reports belonged to: Structure Fires (56.5%), and Outside Fires (35.4%).