Estimated zip code population in 2022: 1,606 Zip code population in 2010: 1,560 Zip code population in 2000: 1,630
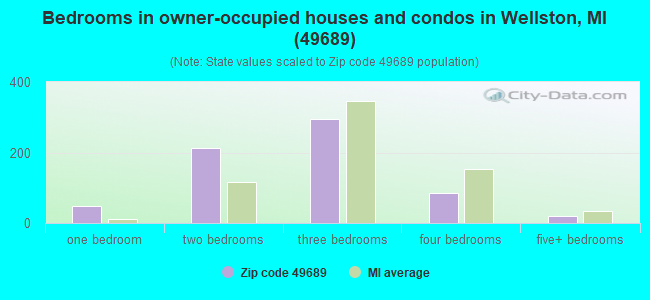
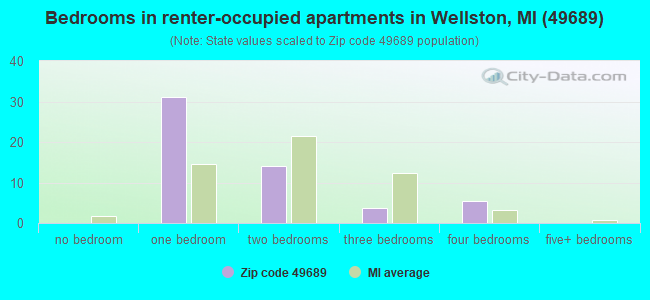
Houses and condos: 1,620 Renter-occupied apartments: 52
% of renters here:
7%
State:
27%
March 2022 cost of living index in zip code 49689: 80.0 (low, U.S. average is 100)
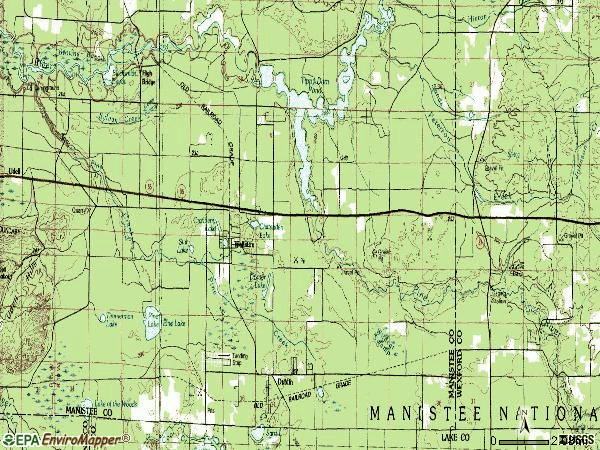
Land area: 78.7 sq. mi. Water area: 1.8 sq. mi.
Population density: 20 people per square mile
(very low).
OSM Map
General Map
Google Map
MSN Map
OSM Map
General Map
Google Map
MSN Map
OSM Map
General Map
Google Map
MSN Map
OSM Map
General Map
Google Map
MSN Map
Please wait while loading the map...
Real estate property taxes paid for housing units in 2022:
This zip code:
1.0% ($1,366)
Michigan:
1.2% ($2,746)
Median real estate property taxes paid for housing units with mortgages in 2022: $1,410 (0.9%) Median real estate property taxes paid for housing units with no mortgage in 2022: $1,307 (1.1%)
Business Search- 14 Million verified businesses
Males: 861
(53.6%)
Females: 744
(46.4%)
For population 25 years and over in 49689:
High school or higher: 86.8%
Bachelor's degree or higher: 23.1%
Graduate or professional degree: 7.4%
Unemployed: 4.5%
Mean travel time to work (commute): 28.8 minutes
For population 15 years and over in 49689:
Never married: 25.5%
Now married: 56.1%
Separated: 1.8%
Widowed: 6.3%
Divorced: 10.3%
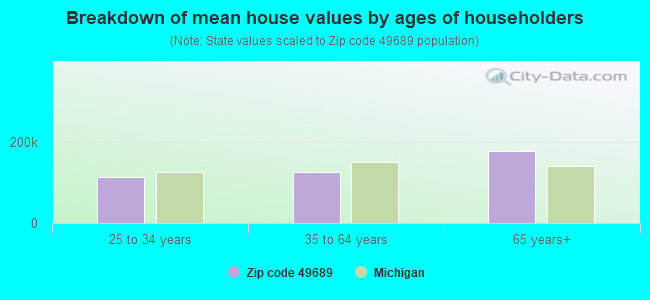
Zip code 49689 compared to state average:
Median house value below state average.
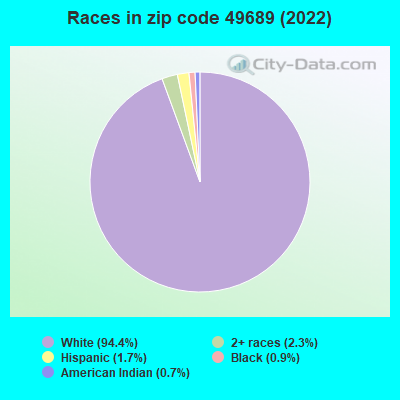
Black race population percentage significantly below state average.
Hispanic race population percentage significantly below state average.
Median age significantly above state average.
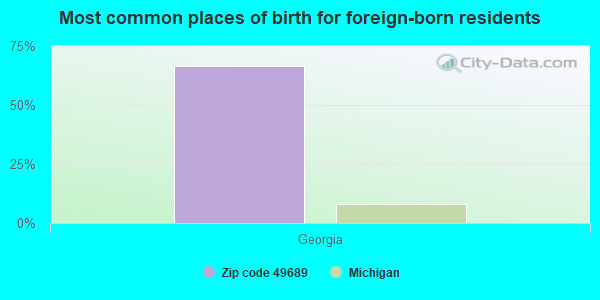
Foreign-born population percentage significantly below state average.
Renting percentage significantly below state average.
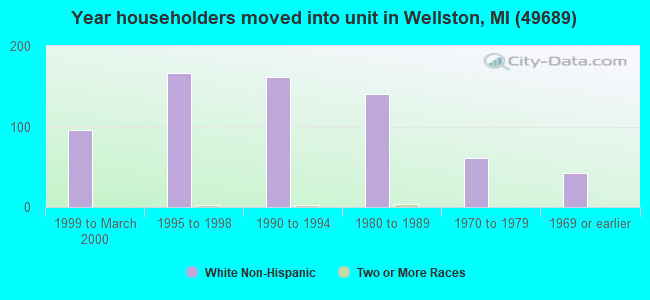
Length of stay since moving in above state average.
Averages for the 2020 tax year for zip code 49689, filed in 2021:
Average Adjusted Gross Income (AGI) in 2020: $44,639 (Individual Income Tax Returns)
Here:
$44,639
State:
$68,945
Salary/wage: $34,781 (reported on 70.7% of returns)
Here:
$34,781
State:
$57,142
(% of AGI for various income ranges: 904.7% for AGIs below $25k, 2722.5% for AGIs $25k-50k, 5001.2% for AGIs $50k-75k, 7762.5% for AGIs $75k-100k, 13132.5% for AGIs $100k-200k)
Taxable interest for individuals: $780 (reported on 26.7% of returns)
This zip code:
$780
Michigan:
$1,630
(% of AGI for various income ranges: 17.4% for AGIs below $25k, 20.0% for AGIs $25k-50k, 50.0% for AGIs $50k-75k, 7.5% for AGIs $75k-100k, 120.0% for AGIs $100k-200k)
Ordinary dividends: $2,875 (reported on 10.7% of returns)
Here:
$2,875
State:
$6,972
(% of AGI for various income ranges: 34.2% for AGIs below $25k, 26.2% for AGIs $50k-75k, 360.0% for AGIs $100k-200k)
Net capital gain/loss in AGI: +$6,200 (reported on 9.3% of returns)
Here:
+$6,200
State:
+$20,064
(% of AGI for various income ranges: 6.9% for AGIs $25k-50k, 1057.5% for AGIs $100k-200k)
Profit/loss from business: +$8,530 (reported on 13.3% of returns)
Here:
+$8,530
State:
+$11,172
(% of AGI for various income ranges: 97.4% for AGIs below $25k, 151.2% for AGIs $25k-50k, 532.5% for AGIs $50k-75k)
Taxable individual retirement arrangement distribution: $17,880 (reported on 13.3% of returns)
49689:
$17,880
Michigan:
$19,803
(% of AGI for various income ranges: 154.2% for AGIs below $25k, 881.2% for AGIs $50k-75k, 1975.0% for AGIs $100k-200k)
Earned income credit: $2,085 (reported on 17.3% of returns)
Here:
$2,085
State:
$2,251
(% of AGI for various income ranges: 91.6% for AGIs below $25k, 60.6% for AGIs $25k-50k)
Percentage of individuals using paid preparers for their 2020 taxes: 90.7%
Here:
91%
State:
93%
(% for various income ranges: 90.0% for AGIs below $25k, 90.0% for AGIs $25k-50k, 90.9% for AGIs $50k-75k, 100.0% for AGIs $75k-100k, 87.5% for AGIs $100k-200k)
Averages for the 2012 tax year for zip code 49689, filed in 2013:
Average Adjusted Gross Income (AGI) in 2012: $33,209 (Individual Income Tax Returns)
Here:
$33,209
State:
$55,609
Salary/wage: $24,978 (reported on 74.6% of returns)
Here:
$24,978
State:
$46,782
(% of AGI for various income ranges: 61.8% for AGIs below $25k, 60.6% for AGIs $25k-50k, 57.3% for AGIs $50k-75k, 43.6% for AGIs $75k-100k, 51.1% for AGIs $100k-200k)
Taxable interest for individuals: $945 (reported on 29.9% of returns)
This zip code:
$945
Michigan:
$1,491
(% of AGI for various income ranges: 0.9% for AGIs below $25k, 0.5% for AGIs $25k-50k, 1.0% for AGIs $50k-75k, 2.4% for AGIs $75k-100k)
Ordinary dividends: $2,033 (reported on 13.4% of returns)
Here:
$2,033
State:
$6,225
(% of AGI for various income ranges: 0.6% for AGIs below $25k, 0.7% for AGIs $25k-50k, 0.9% for AGIs $50k-75k, 2.5% for AGIs $75k-100k)
Net capital gain/loss in AGI: +$3,000 (reported on 11.9% of returns)
Here:
+$3,000
State:
+$9,326
(% of AGI for various income ranges: 0.8% for AGIs $25k-50k, 7.4% for AGIs $75k-100k)
Profit/loss from business: +$5,789 (reported on 13.4% of returns)
Here:
+$5,789
State:
+$11,523
Taxable individual retirement arrangement distribution: $15,543 (reported on 10.4% of returns)
49689:
$15,543
Michigan:
$15,298
(% of AGI for various income ranges: 4.4% for AGIs below $25k, 3.0% for AGIs $25k-50k, 13.7% for AGIs $50k-75k)
Total itemized deductions: $17,570 (29% of AGI, reported on 14.9% of returns)
Here:
$17,570
State:
$21,628
Here:
29.4% of AGI
State:
18.4% of AGI
(% of AGI for various income ranges: 7.2% for AGIs below $25k, 8.9% for AGIs $25k-50k, 6.5% for AGIs $50k-75k, 20.7% for AGIs $75k-100k)
Charity contributions: $3,143 (reported on 10.4% of returns)
Here:
$3,143
State:
$4,225
Taxes paid: $4,970 (reported on 14.9% of returns)
49689:
$4,970
State:
$8,327
(% of AGI for various income ranges: 1.4% for AGIs below $25k, 1.9% for AGIs $25k-50k, 2.0% for AGIs $50k-75k, 7.8% for AGIs $75k-100k)
Earned income credit: $2,150 (reported on 17.9% of returns)
Here:
$2,150
State:
$2,306
(% of AGI for various income ranges: 5.0% for AGIs below $25k, 1.0% for AGIs $25k-50k)
Percentage of individuals using paid preparers for their 2012 taxes: 55.2%
Here:
55%
State:
57%
(% for various income ranges: 48.6% for AGIs below $25k, 58.8% for AGIs $25k-50k, 66.7% for AGIs $50k-75k, 66.7% for AGIs $75k-100k, 66.7% for AGIs $100k-200k)
Averages for the 2004 tax year for zip code 49689, filed in 2005:
Average Adjusted Gross Income (AGI) in 2004: $29,202 (Individual Income Tax Returns)
Here:
$29,202
State:
$48,204
Salary/wage: $24,668 (reported on 76.0% of returns)
Here:
$24,668
State:
$42,791
(% of AGI for various income ranges: 72.5% for AGIs below $10k, 59.1% for AGIs $10k-25k, 71.8% for AGIs $25k-50k, 61.8% for AGIs $50k-75k, 73.5% for AGIs $75k-100k, 44.3% for AGIs over 100k)
Taxable interest for individuals: $1,042 (reported on 41.0% of returns)
This zip code:
$1,042
Michigan:
$1,725
(% of AGI for various income ranges: 3.8% for AGIs below $10k, 3.0% for AGIs $10k-25k, 1.1% for AGIs $25k-50k, 0.8% for AGIs $50k-75k, 0.3% for AGIs $75k-100k, 1.8% for AGIs over 100k)
Taxable dividends: $1,093 (reported on 15.6% of returns)
Here:
$1,093
State:
$3,420
(% of AGI for various income ranges: 2.1% for AGIs below $10k, 0.3% for AGIs $10k-25k, 0.5% for AGIs $25k-50k, 0.8% for AGIs $50k-75k, 0.8% for AGIs $75k-100k)
Net capital gain/loss: +$2,318 (reported on 12.7% of returns)
Here:
+$2,318
State:
+$8,532
(% of AGI for various income ranges: 1.0% for AGIs $10k-25k, -0.2% for AGIs $25k-50k, 3.7% for AGIs $50k-75k, 0.2% for AGIs $75k-100k)
Profit/loss from business: +$6,187 (reported on 17.7% of returns)
Here:
+$6,187
State:
+$9,547
(% of AGI for various income ranges: 17.1% for AGIs below $10k, 5.5% for AGIs $10k-25k, 5.0% for AGIs $25k-50k, 2.7% for AGIs $50k-75k)
IRA payment deduction: $2,647 (reported on 2.5% of returns)
49689:
$2,647
Michigan:
$2,875
Total itemized deductions: $15,706 (31% of AGI, reported on 19.6% of returns)
Here:
$15,706
State:
$18,509
Here:
30.8% of AGI
State:
20.7% of AGI
(% of AGI for various income ranges: 15.7% for AGIs $10k-25k, 7.5% for AGIs $25k-50k, 9.6% for AGIs $50k-75k, 24.1% for AGIs $75k-100k)
Charity contributions deductions: $1,895 (4% of AGI, reported on 15.2% of returns)
Here:
$1,895
State:
$3,365
Here:
3.6% of AGI
State:
3.6% of AGI
(% of AGI for various income ranges: 0.8% for AGIs $10k-25k, 0.8% for AGIs $25k-50k, 1.2% for AGIs $50k-75k, 2.5% for AGIs $75k-100k)
Total tax: $3,722 (reported on 68.0% of returns)
49689:
$3,722
State:
$7,691
(% of AGI for various income ranges: 4.1% for AGIs below $10k, 3.9% for AGIs $10k-25k, 6.5% for AGIs $25k-50k, 9.3% for AGIs $50k-75k, 10.1% for AGIs $75k-100k, 21.0% for AGIs over 100k)
Earned income credit: $1,646 (reported on 22.8% of returns)
Here:
$1,646
State:
$1,737
Percentage of individuals using paid preparers for their 2004 taxes: 63.2%
Here:
63%
State:
60%
(% for various income ranges: 62.1% for AGIs below $10k, 57.2% for AGIs $10k-25k, 70.6% for AGIs $25k-50k, 64.6% for AGIs $50k-75k, 90.0% for AGIs $75k-100k)
Likely homosexual households (counted as self-reported same-sex unmarried-partner households)
Lesbian couples: 0.0% of all households
Gay men: 0.6% of all households
Household received Food Stamps/SNAP in the past 12 months: 133 Household did not receive Food Stamps/SNAP in the past 12 months: 579
Women who had a birth in the past 12 months: 23 (10 now married, 12 unmarried) Women who did not have a birth in the past 12 months: 296 (154 now married, 141 unmarried)
Housing units in zip code 49689 with a mortgage: 380 (23 second mortgage, 24 both second mortgage and home equity loan) Median monthly owner costs for units with a mortgage: $1,189 Median monthly owner costs for units without a mortgage: $452
Residents with income below the poverty level in 2022:
This zip code:
12.4%
Whole state:
13.4%
Residents with income below 50% of the poverty level in 2022:
This zip code:
3.2%
Whole state:
6.9%
Median number of rooms in houses and condos:
Here:
6.3
State:
6.5
Median number of rooms in apartments:
Here:
3.6
State:
4.3
Notable locations in this zip code not listed on our city pages
Notable locations in zip code 49689: Tippy Dam Road Campgrounds (A), Twin Oaks Campground (B), Heart of the Forest RV Park (C), Fawn Crest Golf Course (D), Pine River Paddlesport Center and Campground (E), Peterson Bridge Campground (F), Coolwater Camp Grounds (G), Kestelwoods Campgrounds (H), Blacksmith Bayou Public Access (I), High Bridge Public Access (J), Old High Bridge R R Crossing Site (K), Blacksmith Bayou Campground (L), Low Bridge Canoe Access (M), Peterson Bridge Campground (N), Peterson Bridge Canoe Access (O), Wellston County Library (P), South Branch Township Volunteer Fire Department (Q), Norman Township Fire Department (R). Display/hide their locations on the map
Lakes, reservoirs, and swamps: Chittenden Lake (A), Cranberry Lake (B), Dorner Lake (C), Lost Lake (D), Mud Lake (E), Pine Lake (F), Star Lake (G), Sylvan Pond (H). Display/hide their locations on the map
142 married couples with children.
53 single-parent households (50 men, 3 women).
99.2% of residents of 49689 zip code speak English at home.
0.7% of residents speak Spanish at home (64% very well, 36% well).
0.1% of residents speak other language at home (100% very well).
Foreign born population: 3 (0.2%) (100.0% of them are naturalized citizens)
This zip code:
0.2%
Whole state:
6.9%
67%Georgia
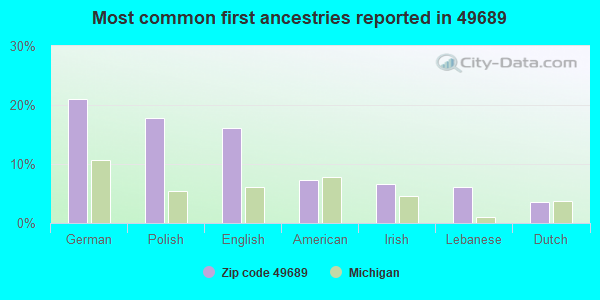
21%German
18%Polish
16%English
7%American
7%Irish
6%Lebanese
4%Dutch
Year of entry for the foreign-born population
02010 or later
02000 to 2009
21990 to 1999
2Before 1990
Facilities with environmental interests located in this zip code:
MI DEPT/TRANSPORTATION BRIDGE (M-55 SECTION 8 in WELLSTON, MI)
(Resource Conservation and Recovery Act (tracking hazardous waste)) Organizations: MICH DEPT OF TRANSPORTATION (CONTACT/OPERATOR)
Alternative names: MIDOT BRIDGE M-55 SECTION 8
Housing units lacking complete plumbing facilities: 3.3% Housing units lacking complete kitchen facilities: 2.3%
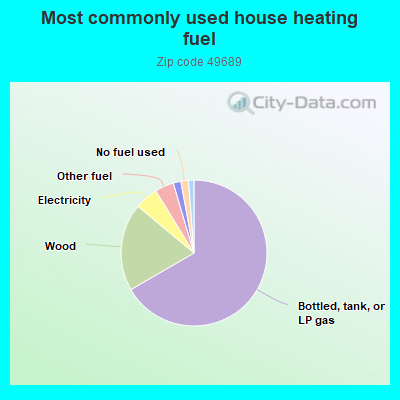
66.9%Bottled, tank, or LP gas
19.5%Wood
5.2%Electricity
4.2%Other fuel
1.7%Fuel oil, kerosene, etc.
1.7%No fuel used
1.2%Utility gas
Population in 1990: 1,043. Population change in the 1990s: +587 (+56.3%).
Place of birth for U.S.-born residents:
This state: 1,362
Northeast: 12
Midwest: 139
South: 65
West: 18
59% of the 49689 zip code residents lived in the same house 5 years ago. Out of people who lived in different houses, 31% lived in this county. Out of people who lived in different counties, 50% lived in Michigan.
88% of the 49689 zip code residents lived in the same house 1 year ago. Out of people who lived in different houses, 38% moved from this county. Out of people who lived in different houses, 21% moved from different county within same state. Out of people who lived in different houses, 43% moved from different state.
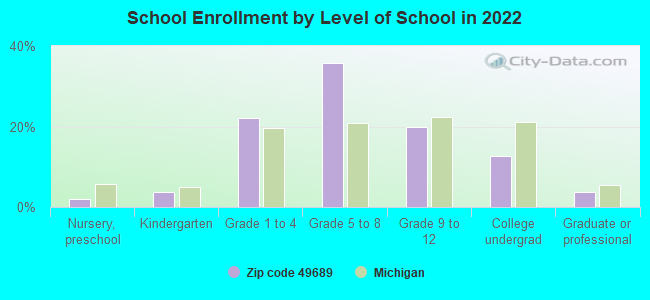
Private vs. public school enrollment:
Students in private schools in grades 1 to 8 (elementary and middle school): 2
Here:
1.3%
Michigan:
12.4%
Students in private schools in grades 9 to 12 (high school):
Here:
0.0%
Michigan:
9.8%
Students in private undergraduate colleges: 3
Here:
10.3%
Michigan:
14.9%
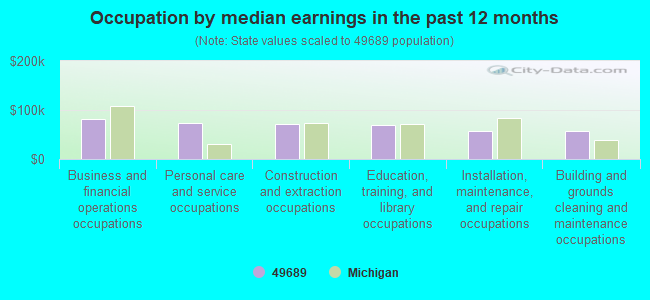
Occupation by median earnings in the past 12 months ($)
81,665Business and financial operations occupations
73,324Personal care and service occupations
71,380Construction and extraction occupations
68,416Education, training, and library occupations
57,247Installation, maintenance, and repair occupations
57,200Building and grounds cleaning and maintenance occupations
Top industries in this zip code by the number of employees in 2005:
Construction: New Single-Family Housing Construction (except Operative Builders) (1-4: 4)
Finance and Insurance: Commercial Banking (5-9: 1)
Real Estate and Rental and Leasing: Lessors of Nonresidential Buildings (except Miniwarehouses) (5-9: 1)
Construction: Other Building Equipment Contractors (5-9: 1)
Fatal accident statistics in 2013:
Fatal accident count: 1
Vehicles involved in fatal accidents: 2
Fatal accidents caused by drunken drivers: 0
Fatalities: 1
Persons involved in fatal accidents: 5
Pedestrians involved in fatal accidents: 0
Fatal accident statistics in 2012:
Fatal accident count: 1
Vehicles involved in fatal accidents: 1
Fatal accidents caused by drunken drivers: 0
Fatalities: 1
Persons involved in fatal accidents: 1
Pedestrians involved in fatal accidents: 0
2002 - 2018 National Fire Incident Reporting System (NFIRS) incidents
According to the data from the years 2002 - 2018 the average number of fires per year is 10. The highest number of reported fire incidents - 25 took place in 2015, and the least - 1 in 2005. The data has a growing trend.
When looking into fire subcategories, the most incidents belonged to: Structure Fires (51.2%), and Outside Fires (34.9%).
Fire incident types reported to NFIRS in Zip Code 49689

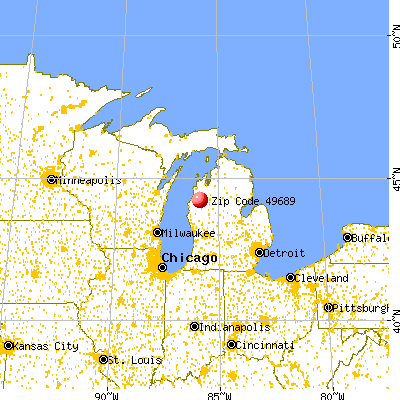


 Nearest zip codes: 49644, 49619, 49638, 49645, 49625, 49656.


 According to the data from the years 2002 - 2018 the average number of fires per year is 10. The highest number of reported fire incidents - 25 took place in 2015, and the least - 1 in 2005. The data has a growing trend.
 When looking into fire subcategories, the most incidents belonged to: Structure Fires (51.2%), and Outside Fires (34.9%).