Estimated zip code population in 2022: 3,362 Zip code population in 2010: 3,625 Zip code population in 2000: 3,328
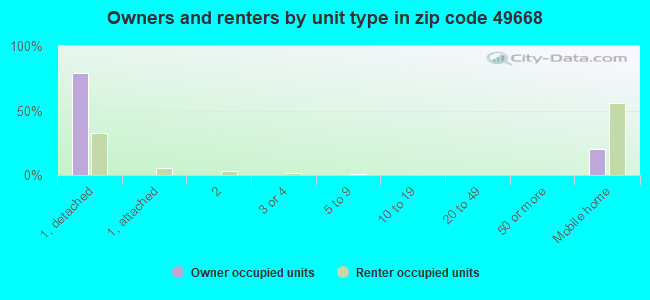
Houses and condos: 1,902 Renter-occupied apartments: 177
% of renters here:
13%
State:
27%
March 2022 cost of living index in zip code 49668: 81.8 (low, U.S. average is 100)
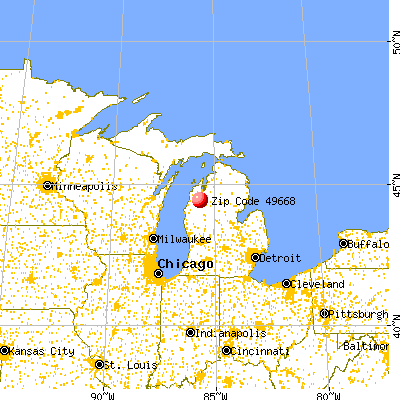
Land area: 106.3 sq. mi. Water area: 3.1 sq. mi.
Population density: 32 people per square mile
(very low).
OSM Map
General Map
Google Map
MSN Map
OSM Map
General Map
Google Map
MSN Map
OSM Map
General Map
Google Map
MSN Map
OSM Map
General Map
Google Map
MSN Map
Please wait while loading the map...
Real estate property taxes paid for housing units in 2022:
This zip code:
0.9% ($1,399)
Michigan:
1.2% ($2,746)
Median real estate property taxes paid for housing units with mortgages in 2022: $1,479 (0.9%) Median real estate property taxes paid for housing units with no mortgage in 2022: $1,274 (1.0%)
Business Search- 14 Million verified businesses
Males: 1,729
(51.5%)
Females: 1,632
(48.5%)
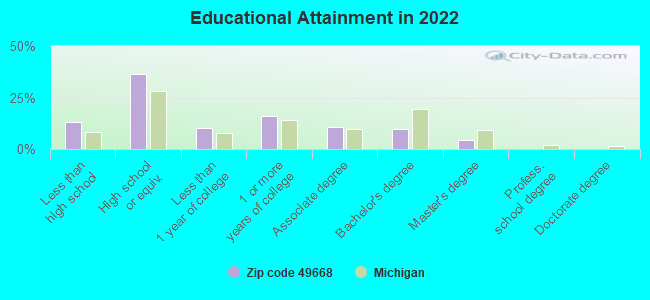
For population 25 years and over in 49668:
High school or higher: 86.1%
Bachelor's degree or higher: 14.0%
Graduate or professional degree: 4.2%
Unemployed: 7.7%
Mean travel time to work (commute): 31.4 minutes
For population 15 years and over in 49668:
Never married: 22.5%
Now married: 53.4%
Separated: 1.4%
Widowed: 8.7%
Divorced: 14.0%
Zip code 49668 compared to state average:
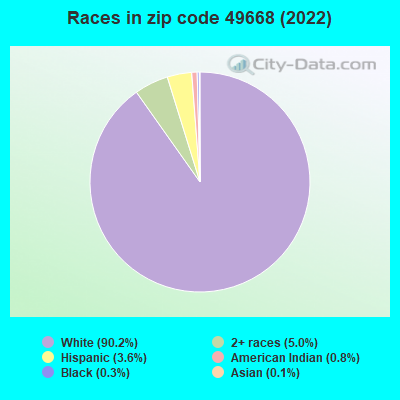
Black race population percentage significantly below state average.
Foreign-born population percentage significantly below state average.
Renting percentage below state average.
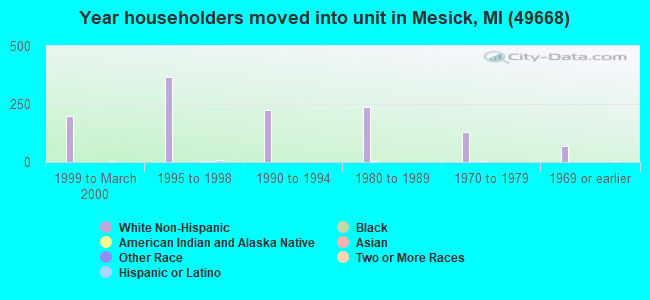
Length of stay since moving in significantly above state average.
Number of college students below state average.
Percentage of population with a bachelor's degree or higher significantly below state average.
Averages for the 2020 tax year for zip code 49668, filed in 2021:
Average Adjusted Gross Income (AGI) in 2020: $44,161 (Individual Income Tax Returns)
Here:
$44,161
State:
$68,945
Salary/wage: $38,147 (reported on 77.1% of returns)
Here:
$38,147
State:
$57,142
(% of AGI for various income ranges: 994.7% for AGIs below $25k, 2980.0% for AGIs $25k-50k, 6320.5% for AGIs $50k-75k, 9202.0% for AGIs $75k-100k, 19841.7% for AGIs $100k-200k)
Taxable interest for individuals: $679 (reported on 22.3% of returns)
This zip code:
$679
Michigan:
$1,630
(% of AGI for various income ranges: 11.7% for AGIs below $25k, 13.5% for AGIs $25k-50k, 13.7% for AGIs $50k-75k, 16.0% for AGIs $75k-100k, 176.7% for AGIs $100k-200k)
Ordinary dividends: $2,782 (reported on 9.7% of returns)
Here:
$2,782
State:
$6,972
(% of AGI for various income ranges: 5.7% for AGIs below $25k, 23.9% for AGIs $25k-50k, 22.1% for AGIs $50k-75k, 84.0% for AGIs $75k-100k, 350.0% for AGIs $100k-200k)
Net capital gain/loss in AGI: +$9,050 (reported on 10.3% of returns)
Here:
+$9,050
State:
+$20,064
(% of AGI for various income ranges: 0.9% for AGIs below $25k, 43.9% for AGIs $25k-50k, 96.3% for AGIs $50k-75k, 249.0% for AGIs $75k-100k, 1651.7% for AGIs $100k-200k)
Profit/loss from business: +$8,180 (reported on 14.3% of returns)
Here:
+$8,180
State:
+$11,172
(% of AGI for various income ranges: 55.3% for AGIs below $25k, 156.5% for AGIs $25k-50k, 238.9% for AGIs $50k-75k, 229.0% for AGIs $75k-100k, 636.7% for AGIs $100k-200k)
Taxable individual retirement arrangement distribution: $12,667 (reported on 10.3% of returns)
49668:
$12,667
Michigan:
$19,803
(% of AGI for various income ranges: 71.5% for AGIs below $25k, 92.0% for AGIs $25k-50k, 223.2% for AGIs $50k-75k, 438.0% for AGIs $75k-100k, 1098.3% for AGIs $100k-200k)
Total itemized deductions: $22,767 (reported on 1.7% of returns)
Here:
$22,767
State:
$34,117
(% of AGI for various income ranges: 359.5% for AGIs $50k-75k)
Taxes paid: $5,800 (reported on 1.7% of returns)
49668:
$5,800
State:
$7,972
(% of AGI for various income ranges: 91.6% for AGIs $50k-75k)
Earned income credit: $2,166 (reported on 20.0% of returns)
Here:
$2,166
State:
$2,251
(% of AGI for various income ranges: 88.3% for AGIs below $25k, 74.6% for AGIs $25k-50k)
Percentage of individuals using paid preparers for their 2020 taxes: 93.7%
Here:
94%
State:
93%
(% for various income ranges: 93.8% for AGIs below $25k, 94.5% for AGIs $25k-50k, 92.6% for AGIs $50k-75k, 93.3% for AGIs $75k-100k, 92.3% for AGIs $100k-200k)
Averages for the 2012 tax year for zip code 49668, filed in 2013:
Average Adjusted Gross Income (AGI) in 2012: $33,449 (Individual Income Tax Returns)
Here:
$33,449
State:
$55,609
Salary/wage: $29,277 (reported on 80.0% of returns)
Here:
$29,277
State:
$46,782
(% of AGI for various income ranges: 61.7% for AGIs below $25k, 76.9% for AGIs $25k-50k, 70.3% for AGIs $50k-75k, 72.9% for AGIs $75k-100k, 64.9% for AGIs $100k-200k)
Taxable interest for individuals: $912 (reported on 22.0% of returns)
This zip code:
$912
Michigan:
$1,491
(% of AGI for various income ranges: 1.4% for AGIs below $25k, 0.5% for AGIs $25k-50k, 0.6% for AGIs $50k-75k, 0.2% for AGIs $75k-100k, 0.2% for AGIs $100k-200k)
Ordinary dividends: $1,559 (reported on 11.3% of returns)
Here:
$1,559
State:
$6,225
(% of AGI for various income ranges: 0.7% for AGIs below $25k, 0.4% for AGIs $25k-50k, 0.5% for AGIs $50k-75k, 1.2% for AGIs $75k-100k)
Net capital gain/loss in AGI: +$1,571 (reported on 9.3% of returns)
Here:
+$1,571
State:
+$9,326
(% of AGI for various income ranges: 0.4% for AGIs $25k-50k, 2.6% for AGIs $75k-100k)
Profit/loss from business: +$7,573 (reported on 14.7% of returns)
Here:
+$7,573
State:
+$11,523
(% of AGI for various income ranges: 9.2% for AGIs below $25k, 3.2% for AGIs $25k-50k, 3.0% for AGIs $50k-75k)
Taxable individual retirement arrangement distribution: $10,669 (reported on 10.7% of returns)
49668:
$10,669
Michigan:
$15,298
(% of AGI for various income ranges: 3.8% for AGIs below $25k, 2.3% for AGIs $25k-50k, 2.7% for AGIs $50k-75k, 10.0% for AGIs $75k-100k)
Total itemized deductions: $15,352 (24% of AGI, reported on 15.3% of returns)
Here:
$15,352
State:
$21,628
Here:
24.2% of AGI
State:
18.4% of AGI
(% of AGI for various income ranges: 4.9% for AGIs below $25k, 6.0% for AGIs $25k-50k, 7.7% for AGIs $50k-75k, 8.2% for AGIs $75k-100k, 9.3% for AGIs $100k-200k)
Charity contributions: $2,913 (reported on 10.0% of returns)
Here:
$2,913
State:
$4,225
(% of AGI for various income ranges: 0.8% for AGIs $25k-50k, 1.1% for AGIs $50k-75k, 0.4% for AGIs $75k-100k, 2.2% for AGIs $100k-200k)
Taxes paid: $4,252 (reported on 15.3% of returns)
49668:
$4,252
State:
$8,327
(% of AGI for various income ranges: 0.6% for AGIs below $25k, 1.5% for AGIs $25k-50k, 2.0% for AGIs $50k-75k, 2.7% for AGIs $75k-100k, 3.5% for AGIs $100k-200k)
Earned income credit: $2,182 (reported on 25.3% of returns)
Here:
$2,182
State:
$2,306
(% of AGI for various income ranges: 6.9% for AGIs below $25k, 1.3% for AGIs $25k-50k)
Percentage of individuals using paid preparers for their 2012 taxes: 54.7%
Here:
55%
State:
57%
(% for various income ranges: 49.4% for AGIs below $25k, 56.4% for AGIs $25k-50k, 61.1% for AGIs $50k-75k, 62.5% for AGIs $75k-100k, 83.3% for AGIs $100k-200k)
Averages for the 2004 tax year for zip code 49668, filed in 2005:
Average Adjusted Gross Income (AGI) in 2004: $30,431 (Individual Income Tax Returns)
Here:
$30,431
State:
$48,204
Salary/wage: $26,925 (reported on 85.0% of returns)
Here:
$26,925
State:
$42,791
(% of AGI for various income ranges: 115.4% for AGIs below $10k, 71.0% for AGIs $10k-25k, 78.2% for AGIs $25k-50k, 81.6% for AGIs $50k-75k, 79.7% for AGIs $75k-100k, 47.6% for AGIs over 100k)
Taxable interest for individuals: $970 (reported on 31.0% of returns)
This zip code:
$970
Michigan:
$1,725
(% of AGI for various income ranges: 4.0% for AGIs below $10k, 1.8% for AGIs $10k-25k, 0.9% for AGIs $25k-50k, 0.7% for AGIs $50k-75k, 0.4% for AGIs $75k-100k, 0.7% for AGIs over 100k)
Taxable dividends: $1,492 (reported on 11.9% of returns)
Here:
$1,492
State:
$3,420
(% of AGI for various income ranges: 2.3% for AGIs below $10k, 0.7% for AGIs $10k-25k, 0.5% for AGIs $25k-50k, 0.2% for AGIs $50k-75k, 0.1% for AGIs $75k-100k, 1.3% for AGIs over 100k)
Net capital gain/loss: +$6,256 (reported on 10.6% of returns)
Here:
+$6,256
State:
+$8,532
(% of AGI for various income ranges: -1.9% for AGIs below $10k, -0.1% for AGIs $10k-25k, 0.6% for AGIs $25k-50k, 1.3% for AGIs $50k-75k, 0.5% for AGIs $75k-100k, 13.3% for AGIs over 100k)
Profit/loss from business: +$3,563 (reported on 16.6% of returns)
Here:
+$3,563
State:
+$9,547
(% of AGI for various income ranges: 4.5% for AGIs below $10k, 4.2% for AGIs $10k-25k, 3.7% for AGIs $25k-50k, -0.4% for AGIs $50k-75k, 0.5% for AGIs $75k-100k)
IRA payment deduction: $2,484 (reported on 1.9% of returns)
49668:
$2,484
Michigan:
$2,875
Total itemized deductions: $14,080 (25% of AGI, reported on 21.0% of returns)
Here:
$14,080
State:
$18,509
Here:
25.0% of AGI
State:
20.7% of AGI
(% of AGI for various income ranges: 8.2% for AGIs below $10k, 8.9% for AGIs $10k-25k, 8.5% for AGIs $25k-50k, 10.6% for AGIs $50k-75k, 11.1% for AGIs $75k-100k, 11.0% for AGIs over 100k)
Charity contributions deductions: $2,477 (4% of AGI, reported on 13.7% of returns)
Here:
$2,477
State:
$3,365
Here:
3.8% of AGI
State:
3.6% of AGI
(% of AGI for various income ranges: 0.6% for AGIs $10k-25k, 0.8% for AGIs $25k-50k, 1.2% for AGIs $50k-75k, 1.6% for AGIs $75k-100k, 2.4% for AGIs over 100k)
Total tax: $3,525 (reported on 68.4% of returns)
49668:
$3,525
State:
$7,691
(% of AGI for various income ranges: 3.8% for AGIs below $10k, 3.7% for AGIs $10k-25k, 6.4% for AGIs $25k-50k, 7.7% for AGIs $50k-75k, 10.3% for AGIs $75k-100k, 16.5% for AGIs over 100k)
Earned income credit: $1,736 (reported on 22.9% of returns)
Here:
$1,736
State:
$1,737
Percentage of individuals using paid preparers for their 2004 taxes: 58.5%
Here:
59%
State:
60%
(% for various income ranges: 49.9% for AGIs below $10k, 61.7% for AGIs $10k-25k, 59.5% for AGIs $25k-50k, 59.3% for AGIs $50k-75k, 72.1% for AGIs $75k-100k, 75.7% for AGIs over 100k)
Household received Food Stamps/SNAP in the past 12 months: 259 Household did not receive Food Stamps/SNAP in the past 12 months: 1,147
Women who had a birth in the past 12 months: 41 (29 now married, 11 unmarried) Women who did not have a birth in the past 12 months: 647 (337 now married, 308 unmarried)
Housing units in zip code 49668 with a mortgage: 707 (26 second mortgage, 21 both second mortgage and home equity loan) Houses without a mortgage: 6
Median monthly owner costs for units with a mortgage: $1,132 Median monthly owner costs for units without a mortgage: $476
Residents with income below the poverty level in 2022:
This zip code:
20.9%
Whole state:
13.4%
Residents with income below 50% of the poverty level in 2022:
This zip code:
12.9%
Whole state:
6.9%
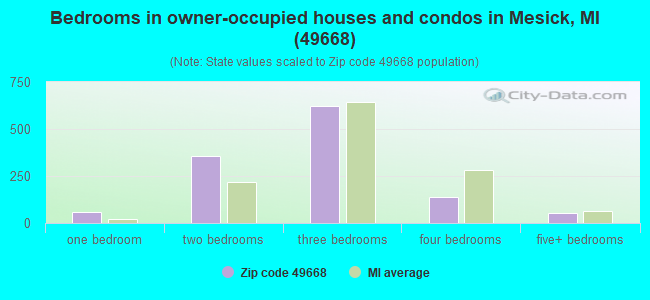
Median number of rooms in houses and condos:
Here:
5.8
State:
6.5
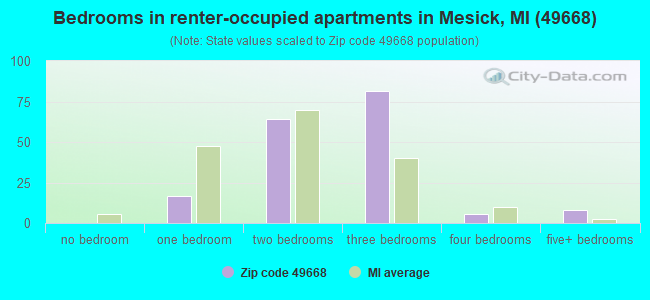
Median number of rooms in apartments:
Here:
4.6
State:
4.3
Notable locations in this zip code not listed on our city pages
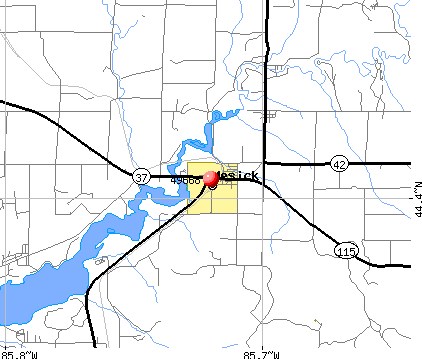
Notable locations in zip code 49668: Yuma Station (A), Indian Crossing Campground (B), Burton Trailer Park (C), Mesick RV Park (D), Spruce Hollow Campground (E), Dennis Family Campground (F), Briar at Mesick Golf Club (G), Briar Hill Ski Jump (H), Seaton Creek Campground (I), Hodenpyle Overlook (J), Mesick Rescue Squad (K), Mesick Public Library (L), Springville Township Volunteer Fire Department (M). Display/hide their locations on the map
Churches in zip code 49668 include: Free Methodist Church (A), Faith Lutheran Church (B), Bible Believers Fellowship Church (C), Mesick Seventh Day Adventist Church (D), United Methodist Church (E), Antioch Church (F). Display/hide their locations on the map
Lakes and reservoirs: Carp Lake (A), Carpenter Lake (B), Ferguson Lake (C), Jewett Lake (D), Oatly Lake (E), Twin Lakes (F), Lake of the Woods (G), Hodenpyl Dam Pond (H). Display/hide their locations on the map
Creeks: Burkett Creek (A), Adams Creek (B), Tar Creek (C), Cripple Creek (D), Wheeler Creek (E), Cole Creek (F), Preston Creek (G), Seaton Creek (H), Fletcher Creek (I). Display/hide their locations on the map
508 married couples with children.
187 single-parent households (32 men, 155 women).
98.6% of residents of 49668 zip code speak English at home.
0.7% of residents speak Spanish at home (74% very well, 26% well).
0.2% of residents speak other Indo-European language at home (100% very well).
0.1% of residents speak Asian or Pacific Island language at home (100% well).
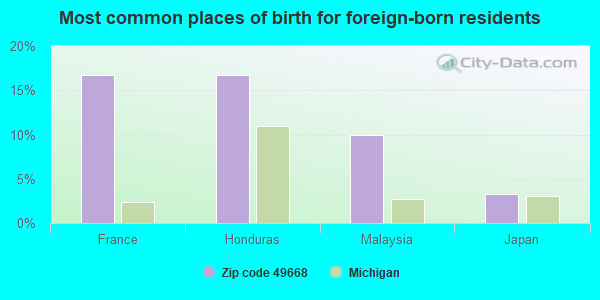
Foreign born population: 29 (0.9%) (13.9% of them are naturalized citizens)
This zip code:
0.9%
Whole state:
6.9%
17%France
17%Honduras
10%Malaysia
3%Japan
18%English
13%German
13%American
11%Irish
4%Polish
3%Italian
3%French Canadian
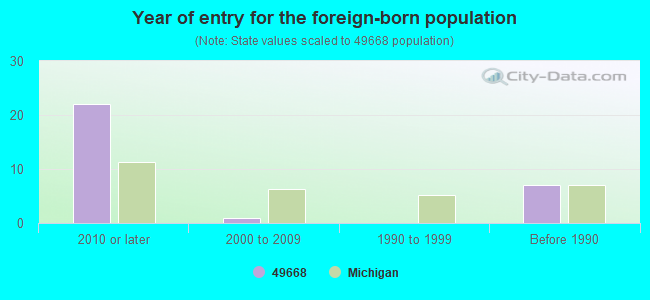
Year of entry for the foreign-born population
222010 or later
12000 to 2009
01990 to 1999
7Before 1990
Major facilities with environmental interests located in this zip code:
MESICK MIDDLE SCHOOL (210 MESICK AVENUE in MESICK, MI)
(National Center for Education Statistics) - STATE ID-08614 Organizations: MESICK CONSOLIDATED SCHOOLS (SCHOOL DISTRICT)
MESICK ALTERNATIVE EDUCATION (210 MESICK AVENUE in MESICK, MI)
(National Center for Education Statistics) - STATE ID-08014 Organizations: MESICK CONSOLIDATED SCHOOLS (SCHOOL DISTRICT)
MESICK CONSOLIDATED HIGH SCHOOL (581 SOUTH CLARK in MESICK, MI)
(National Center for Education Statistics) - STATE ID-05866 Organizations: MESICK CONSOLIDATED SCHOOLS (SCHOOL DISTRICT)
FEDERAL OIL CO (SECTION 6, T 24N R 12 W in MESICK, MI)
(Resource Conservation and Recovery Act (tracking hazardous waste))
FLOYD M. JEWETT ELEM. SCHOOL (210 MESICK AVENUE in MESICK, MI)
(National Center for Education Statistics) - STATE ID-02527 Organizations: MESICK CONSOLIDATED SCHOOLS (SCHOOL DISTRICT)
MI DEPT/TRANSPORTATION (100 MESICK AVE in MESICK, MI)
(Resource Conservation and Recovery Act (tracking hazardous waste)) Organizations: MICH DEPT OF TRANSPORTATION (CONTACT/OPERATOR)
MI DEPT/TRANSPORTATION BRIDGE (M-37 OVER TSBY RR in MESICK, MI)
(Resource Conservation and Recovery Act (tracking hazardous waste)) Organizations: MICH DEPT OF TRANSPORTATION (CONTACT/OWNER)
Alternative names: MIDOT BRIDGE M-37 OVER TSBY RR
MI DEPT/TRANSPORTATION BRIDGE (M-115 OVER MANISTEE RIVER in MESICK, MI)
(Resource Conservation and Recovery Act (tracking hazardous waste)) Organizations: MICH DEPT OF TRANSPORTATION (CONTACT/OPERATOR)
Alternative names: MIDOT BRIDGE M-115 OVER MANISTEE RIVER
Housing units lacking complete plumbing facilities: 3.8% Housing units lacking complete kitchen facilities: 1.4%
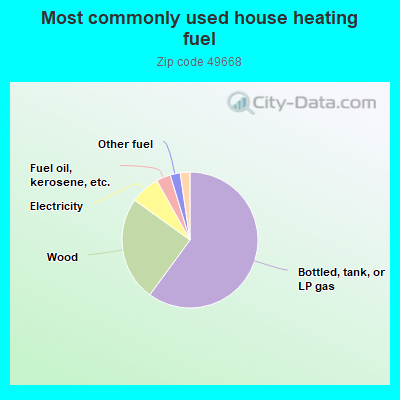
60.2%Bottled, tank, or LP gas
24.9%Wood
7.0%Electricity
3.4%Fuel oil, kerosene, etc.
2.4%Other fuel
2.3%Utility gas
Population in 1990: 2,864. Population change in the 1990s: +464 (+16.2%).
Place of birth for U.S.-born residents:
This state: 2,797
Northeast: 47
Midwest: 186
South: 146
West: 158
58% of the 49668 zip code residents lived in the same house 5 years ago. Out of people who lived in different houses, 40% lived in this county. Out of people who lived in different counties, 50% lived in Michigan.
94% of the 49668 zip code residents lived in the same house 1 year ago. Out of people who lived in different houses, 29% moved from this county. Out of people who lived in different houses, 46% moved from different county within same state. Out of people who lived in different houses, 29% moved from different state.
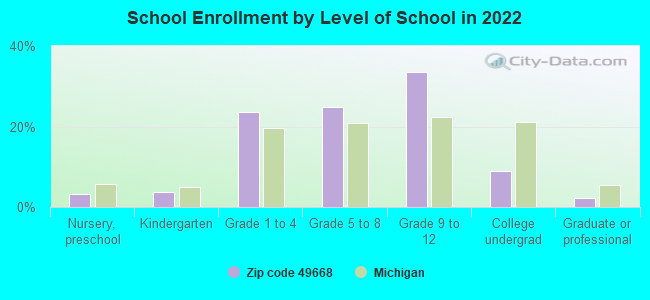
Private vs. public school enrollment:
Students in private schools in grades 1 to 8 (elementary and middle school): 85
Here:
28.7%
Michigan:
12.4%
Students in private schools in grades 9 to 12 (high school): 33
Here:
16.3%
Michigan:
9.8%
Students in private undergraduate colleges: 10
Here:
18.5%
Michigan:
14.9%
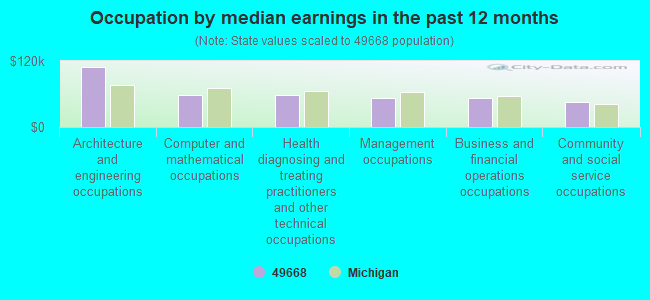
Occupation by median earnings in the past 12 months ($)
109,332Architecture and engineering occupations
57,453Computer and mathematical occupations
57,423Health diagnosing and treating practitioners and other technical occupations
53,161Management occupations
52,197Business and financial operations occupations
44,996Community and social service occupations
Companies with federal contracts located in this zip code:
MICROMET CORP (3800 N 13 RD in MESICK, MI; small business)
$30,000 with Navy for Radar Equipment, Except Airborne. Taking place in MD. Signed on 2004-11-30. Completion date: 2005-04-08.
Top industries in this zip code by the number of employees in 2005:
Health Care and Social Assistance: Ambulance Services (20-49 employees: 1 establishment)
2002 - 2018 National Fire Incident Reporting System (NFIRS) incidents
According to the data from the years 2002 - 2018 the average number of fires per year is 17. The highest number of reported fire incidents - 45 took place in 2018, and the least - 3 in 2005. The data has a growing trend.
When looking into fire subcategories, the most incidents belonged to: Structure Fires (60.6%), and Outside Fires (30.0%).
Fire incident types reported to NFIRS in Zip Code 49668


 Nearest zip codes: 49620, 49638, 49618, 49625, 49637, 49649.


 According to the data from the years 2002 - 2018 the average number of fires per year is 17. The highest number of reported fire incidents - 45 took place in 2018, and the least - 3 in 2005. The data has a growing trend.
 When looking into fire subcategories, the most incidents belonged to: Structure Fires (60.6%), and Outside Fires (30.0%).