Estimated zip code population in 2022: 2,066 Zip code population in 2010: 2,067 Zip code population in 2000: 2,047
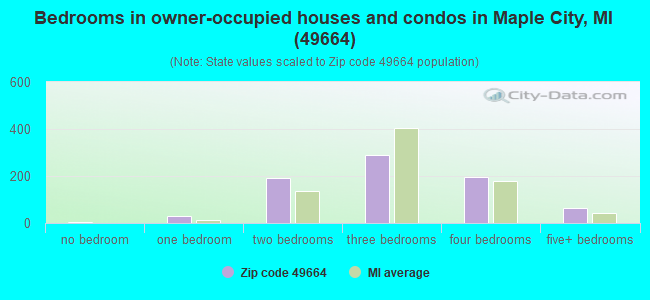
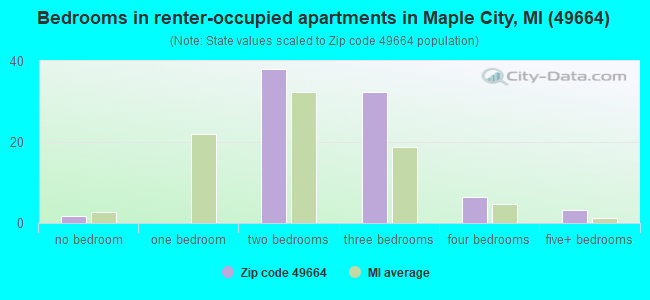
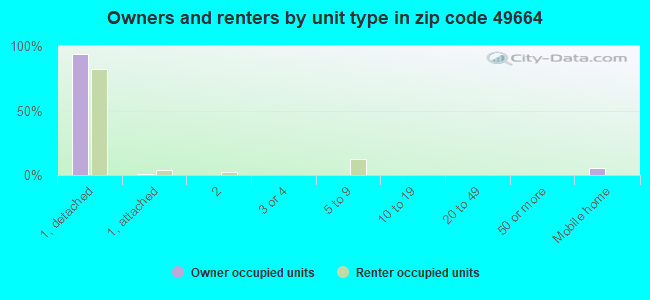
Houses and condos: 1,348 Renter-occupied apartments: 82
% of renters here:
10%
State:
27%
March 2022 cost of living index in zip code 49664: 85.0 (less than average, U.S. average is 100)
Land area: 57.8 sq. mi. Water area: 2.0 sq. mi.
Population density: 36 people per square mile
(very low).
OSM Map
General Map
Google Map
MSN Map
OSM Map
General Map
Google Map
MSN Map
OSM Map
General Map
Google Map
MSN Map
OSM Map
General Map
Google Map
MSN Map
Please wait while loading the map...
Real estate property taxes paid for housing units in 2022:
This zip code:
0.6% ($2,335)
Michigan:
1.2% ($2,746)
Median real estate property taxes paid for housing units with mortgages in 2022: $2,506 (0.6%) Median real estate property taxes paid for housing units with no mortgage in 2022: $1,934 (0.5%)
Business Search- 14 Million verified businesses
Males: 981
(47.5%)
Females: 1,085
(52.5%)
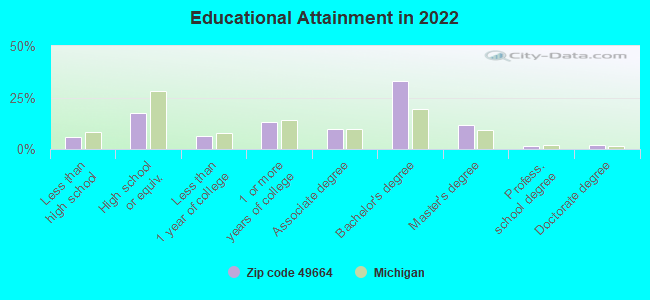
For population 25 years and over in 49664:
High school or higher: 94.6%
Bachelor's degree or higher: 48.3%
Graduate or professional degree: 15.3%
Unemployed: 3.5%
Mean travel time to work (commute): 22.4 minutes
For population 15 years and over in 49664:
Never married: 26.0%
Now married: 57.2%
Separated: 0.1%
Widowed: 5.9%
Divorced: 10.8%
Zip code 49664 compared to state average:
Median house value above state average.
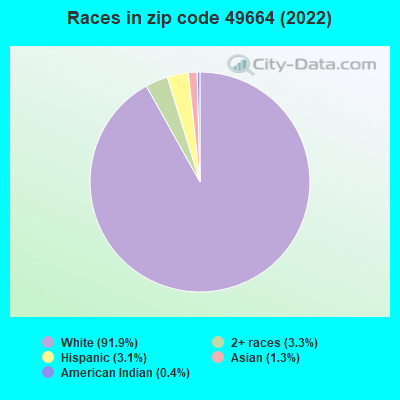
Black race population percentage significantly below state average.
Hispanic race population percentage below state average.
Median age significantly above state average.
Foreign-born population percentage significantly below state average.
Renting percentage significantly below state average.
Length of stay since moving in significantly above state average.
Percentage of population with a bachelor's degree or higher above state average.
Estimated median house/condo value in 2022: $408,852
49664:
$408,852
Michigan:
$224,400
According to our research of Michigan and other state lists, there were 7 registered sex offenders living in 49664 zip code as of May 25, 2024. The ratio of all residents to sex offenders in zip code 49664 is 281 to 1. The ratio of registered sex offenders to all residents in this zip code is near the state average.
Median resident age:
This zip code:
55.0 years
Michigan median age:
40.3 years
Average household size:
This zip code:
2.4 people
Michigan:
2.4 people
Averages for the 2020 tax year for zip code 49664, filed in 2021:
Average Adjusted Gross Income (AGI) in 2020: $87,329 (Individual Income Tax Returns)
Here:
$87,329
State:
$68,945
Salary/wage: $53,251 (reported on 70.5% of returns)
Here:
$53,251
State:
$57,142
(% of AGI for various income ranges: 1042.9% for AGIs below $25k, 3033.0% for AGIs $25k-50k, 5998.8% for AGIs $50k-75k, 8061.2% for AGIs $75k-100k, 10878.0% for AGIs $100k-200k)
Taxable interest for individuals: $2,339 (reported on 41.1% of returns)
This zip code:
$2,339
Michigan:
$1,630
(% of AGI for various income ranges: 33.8% for AGIs below $25k, 44.5% for AGIs $25k-50k, 163.8% for AGIs $50k-75k, 115.0% for AGIs $75k-100k, 306.0% for AGIs $100k-200k)
Ordinary dividends: $9,203 (reported on 30.4% of returns)
Here:
$9,203
State:
$6,972
(% of AGI for various income ranges: 39.0% for AGIs below $25k, 49.5% for AGIs $25k-50k, 200.0% for AGIs $50k-75k, 302.5% for AGIs $75k-100k, 923.0% for AGIs $100k-200k)
Net capital gain/loss in AGI: +$32,012 (reported on 29.5% of returns)
Here:
+$32,012
State:
+$20,064
(% of AGI for various income ranges: 29.0% for AGIs below $25k, 44.5% for AGIs $25k-50k, 270.0% for AGIs $50k-75k, 445.0% for AGIs $75k-100k, 2824.0% for AGIs $100k-200k)
Profit/loss from business: +$13,654 (reported on 23.2% of returns)
Here:
+$13,654
State:
+$11,172
(% of AGI for various income ranges: 171.4% for AGIs below $25k, 397.0% for AGIs $25k-50k, 320.0% for AGIs $50k-75k, 521.2% for AGIs $75k-100k, 708.0% for AGIs $100k-200k)
Taxable individual retirement arrangement distribution: $28,583 (reported on 16.1% of returns)
49664:
$28,583
Michigan:
$19,803
(% of AGI for various income ranges: 73.8% for AGIs below $25k, 162.5% for AGIs $25k-50k, 391.2% for AGIs $50k-75k, 665.0% for AGIs $75k-100k, 1836.0% for AGIs $100k-200k)
Total itemized deductions: $55,267 (reported on 8.0% of returns)
Here:
$55,267
State:
$34,117
(% of AGI for various income ranges: 283.5% for AGIs $25k-50k, 1126.0% for AGIs $100k-200k)
Charity contributions: $20,714 (reported on 6.2% of returns)
Here:
$20,714
State:
$13,548
(% of AGI for various income ranges: 288.0% for AGIs $100k-200k)
Taxes paid: $8,911 (reported on 8.0% of returns)
49664:
$8,911
State:
$7,972
(% of AGI for various income ranges: 55.0% for AGIs $25k-50k, 302.0% for AGIs $100k-200k)
Earned income credit: $1,855 (reported on 9.8% of returns)
Here:
$1,855
State:
$2,251
(% of AGI for various income ranges: 58.6% for AGIs below $25k, 40.5% for AGIs $25k-50k)
Percentage of individuals using paid preparers for their 2020 taxes: 92.9%
Here:
93%
State:
93%
(% for various income ranges: 88.2% for AGIs below $25k, 96.3% for AGIs $25k-50k, 92.3% for AGIs $50k-75k, 92.3% for AGIs $75k-100k, 100.0% for AGIs $100k-200k, 87.5% for AGIs over 200k)
Averages for the 2012 tax year for zip code 49664, filed in 2013:
Average Adjusted Gross Income (AGI) in 2012: $60,891 (Individual Income Tax Returns)
Here:
$60,891
State:
$55,609
Salary/wage: $37,697 (reported on 75.7% of returns)
Here:
$37,697
State:
$46,782
(% of AGI for various income ranges: 66.4% for AGIs below $25k, 72.0% for AGIs $25k-50k, 57.9% for AGIs $50k-75k, 55.1% for AGIs $75k-100k, 50.1% for AGIs $100k-200k, 20.8% for AGIs over 200k)
Taxable interest for individuals: $2,207 (reported on 42.7% of returns)
This zip code:
$2,207
Michigan:
$1,491
(% of AGI for various income ranges: 1.8% for AGIs below $25k, 0.8% for AGIs $25k-50k, 2.8% for AGIs $50k-75k, 0.6% for AGIs $75k-100k, 2.8% for AGIs $100k-200k, 0.9% for AGIs over 200k)
Ordinary dividends: $7,472 (reported on 31.1% of returns)
Here:
$7,472
State:
$6,225
(% of AGI for various income ranges: 3.4% for AGIs below $25k, 1.4% for AGIs $25k-50k, 3.5% for AGIs $50k-75k, 3.8% for AGIs $75k-100k, 3.7% for AGIs $100k-200k, 5.3% for AGIs over 200k)
Net capital gain/loss in AGI: +$13,092 (reported on 24.3% of returns)
Here:
+$13,092
State:
+$9,326
(% of AGI for various income ranges: 0.3% for AGIs $25k-50k, 1.3% for AGIs $50k-75k, 3.1% for AGIs $100k-200k, 14.3% for AGIs over 200k)
Profit/loss from business: +$9,912 (reported on 24.3% of returns)
Here:
+$9,912
State:
+$11,523
(% of AGI for various income ranges: 10.3% for AGIs below $25k, 5.6% for AGIs $25k-50k, 6.1% for AGIs $50k-75k, 5.7% for AGIs $75k-100k, 4.2% for AGIs $100k-200k)
Taxable individual retirement arrangement distribution: $24,941 (reported on 16.5% of returns)
49664:
$24,941
Michigan:
$15,298
(% of AGI for various income ranges: 5.3% for AGIs below $25k, 3.8% for AGIs $25k-50k, 4.8% for AGIs $50k-75k, 8.3% for AGIs $75k-100k, 18.6% for AGIs $100k-200k)
Total itemized deductions: $24,364 (19% of AGI, reported on 32.0% of returns)
Here:
$24,364
State:
$21,628
Here:
19.1% of AGI
State:
18.4% of AGI
(% of AGI for various income ranges: 15.1% for AGIs below $25k, 11.4% for AGIs $25k-50k, 10.8% for AGIs $50k-75k, 15.0% for AGIs $75k-100k, 16.9% for AGIs $100k-200k, 9.8% for AGIs over 200k)
Charity contributions: $4,533 (reported on 29.1% of returns)
Here:
$4,533
State:
$4,225
(% of AGI for various income ranges: 1.4% for AGIs below $25k, 1.0% for AGIs $25k-50k, 1.2% for AGIs $50k-75k, 2.5% for AGIs $75k-100k, 2.5% for AGIs $100k-200k, 2.9% for AGIs over 200k)
Taxes paid: $9,042 (reported on 32.0% of returns)
49664:
$9,042
State:
$8,327
(% of AGI for various income ranges: 3.6% for AGIs below $25k, 2.5% for AGIs $25k-50k, 3.1% for AGIs $50k-75k, 4.7% for AGIs $75k-100k, 6.4% for AGIs $100k-200k, 5.5% for AGIs over 200k)
Earned income credit: $1,681 (reported on 15.5% of returns)
Here:
$1,681
State:
$2,306
(% of AGI for various income ranges: 4.0% for AGIs below $25k, 0.8% for AGIs $25k-50k)
Percentage of individuals using paid preparers for their 2012 taxes: 56.3%
Here:
56%
State:
57%
(% for various income ranges: 44.4% for AGIs below $25k, 54.2% for AGIs $25k-50k, 72.7% for AGIs $50k-75k, 70.0% for AGIs $75k-100k, 70.0% for AGIs $100k-200k, 100.0% for AGIs over 200k)
Averages for the 2004 tax year for zip code 49664, filed in 2005:
Average Adjusted Gross Income (AGI) in 2004: $47,643 (Individual Income Tax Returns)
Here:
$47,643
State:
$48,204
Salary/wage: $34,623 (reported on 80.4% of returns)
Here:
$34,623
State:
$42,791
(% of AGI for various income ranges: 119.6% for AGIs below $10k, 65.4% for AGIs $10k-25k, 72.2% for AGIs $25k-50k, 67.9% for AGIs $50k-75k, 73.3% for AGIs $75k-100k, 41.7% for AGIs over 100k)
Taxable interest for individuals: $1,824 (reported on 53.7% of returns)
This zip code:
$1,824
Michigan:
$1,725
(% of AGI for various income ranges: 6.8% for AGIs below $10k, 2.3% for AGIs $10k-25k, 2.2% for AGIs $25k-50k, 2.5% for AGIs $50k-75k, 1.4% for AGIs $75k-100k, 1.8% for AGIs over 100k)
Taxable dividends: $5,802 (reported on 31.5% of returns)
Here:
$5,802
State:
$3,420
(% of AGI for various income ranges: 10.2% for AGIs below $10k, 2.1% for AGIs $10k-25k, 1.8% for AGIs $25k-50k, 2.6% for AGIs $50k-75k, 1.0% for AGIs $75k-100k, 6.0% for AGIs over 100k)
Net capital gain/loss: +$19,147 (reported on 27.1% of returns)
Here:
+$19,147
State:
+$8,532
(% of AGI for various income ranges: -2.6% for AGIs below $10k, 2.2% for AGIs $10k-25k, 1.2% for AGIs $25k-50k, 3.0% for AGIs $50k-75k, 2.3% for AGIs $75k-100k, 22.2% for AGIs over 100k)
Profit/loss from business: +$13,537 (reported on 23.8% of returns)
Here:
+$13,537
State:
+$9,547
(% of AGI for various income ranges: 12.7% for AGIs below $10k, 11.1% for AGIs $10k-25k, 5.0% for AGIs $25k-50k, 4.0% for AGIs $50k-75k, 1.2% for AGIs $75k-100k, 9.0% for AGIs over 100k)
IRA payment deduction: $3,711 (reported on 3.7% of returns)
49664:
$3,711
Michigan:
$2,875
Self-employed pension: $19,800 (reported on 1.0% of returns)
Here:
$19,800
Michigan:
$13,826
Total itemized deductions: $21,332 (23% of AGI, reported on 33.7% of returns)
Here:
$21,332
State:
$18,509
Here:
22.8% of AGI
State:
20.7% of AGI
(% of AGI for various income ranges: 25.2% for AGIs below $10k, 14.5% for AGIs $10k-25k, 12.0% for AGIs $25k-50k, 18.6% for AGIs $50k-75k, 14.2% for AGIs $75k-100k, 15.0% for AGIs over 100k)
Charity contributions deductions: $3,870 (4% of AGI, reported on 28.5% of returns)
Here:
$3,870
State:
$3,365
Here:
3.8% of AGI
State:
3.6% of AGI
(% of AGI for various income ranges: 0.9% for AGIs below $10k, 1.4% for AGIs $10k-25k, 1.3% for AGIs $25k-50k, 1.9% for AGIs $50k-75k, 1.7% for AGIs $75k-100k, 3.3% for AGIs over 100k)
Total tax: $7,996 (reported on 72.9% of returns)
49664:
$7,996
State:
$7,691
(% of AGI for various income ranges: 3.6% for AGIs below $10k, 5.2% for AGIs $10k-25k, 6.6% for AGIs $25k-50k, 8.6% for AGIs $50k-75k, 9.9% for AGIs $75k-100k, 18.1% for AGIs over 100k)
Earned income credit: $1,698 (reported on 11.3% of returns)
Here:
$1,698
State:
$1,737
Percentage of individuals using paid preparers for their 2004 taxes: 56.0%
Here:
56%
State:
60%
(% for various income ranges: 40.3% for AGIs below $10k, 50.9% for AGIs $10k-25k, 62.3% for AGIs $25k-50k, 63.8% for AGIs $50k-75k, 64.4% for AGIs $75k-100k, 81.4% for AGIs over 100k)
Household received Food Stamps/SNAP in the past 12 months: 22 Household did not receive Food Stamps/SNAP in the past 12 months: 816
Women who had a birth in the past 12 months: 26 (13 now married, 12 unmarried) Women who did not have a birth in the past 12 months: 351 (151 now married, 199 unmarried)
Housing units in zip code 49664 with a mortgage: 380 (64 second mortgage, 61 both second mortgage and home equity loan) Houses without a mortgage: 13
Median monthly owner costs for units with a mortgage: $1,729 Median monthly owner costs for units without a mortgage: $545
Residents with income below the poverty level in 2022:
This zip code:
7.9%
Whole state:
13.4%
Residents with income below 50% of the poverty level in 2022:
This zip code:
4.5%
Whole state:
6.9%
Median number of rooms in houses and condos:
Here:
6.3
State:
6.5
Median number of rooms in apartments:
Here:
4.8
State:
4.3
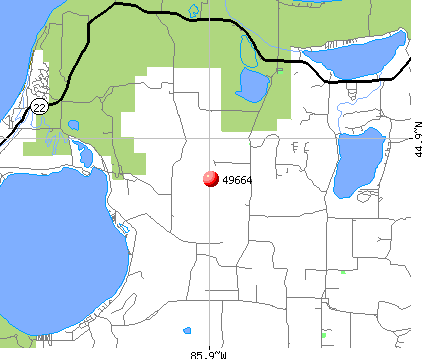
Notable locations in this zip code not listed on our city pages
Notable locations in zip code 49664: Innestree Camp (A), Miller Hill Lookout (B), Camp Kohahna (C), Shaldas Corner (D), North University (E), Kasson Townhall (F). Display/hide their locations on the map
Churches in zip code 49664 include: Saint Joseph Church (A), Saint Rita's Church (B), Maple City Community Church (C). Display/hide their locations on the map
Cemeteries: Cleveland Cemetery (1), Round Top Cemetery (2), East Kasson Cemetery (3), Nash-Pettengill Cemetery (4), Kasson Cemetery (5), Saint Joseph Cemetery (6), Saint Rita Cemetery (7). Display/hide their locations on the map
Lakes: Tucker Lake (A), Polack Lake (B), Little Traverse Lake (C), Narada Lake (D), Hidden Lake (E), Fisher Lake (F), Davis Lake (G), Cook Lake (H). Display/hide their locations on the map
185 married couples with children.
19 single-parent households (8 men, 11 women).
97.9% of residents of 49664 zip code speak English at home.
0.7% of residents speak Spanish at home (86% very well, 14% well).
1.9% of residents speak other Indo-European language at home (100% very well).
0.1% of residents speak Asian or Pacific Island language at home (100% very well).
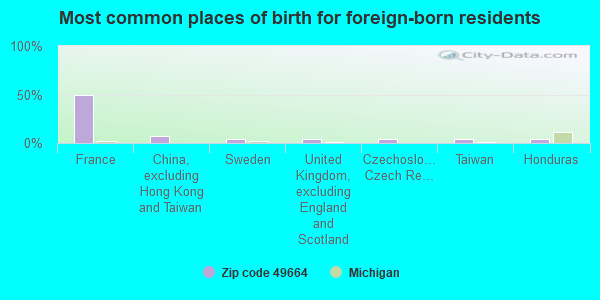
Foreign born population: 44 (2.2%) (78.2% of them are naturalized citizens)
This zip code:
2.2%
Whole state:
6.9%
50%France
7%China, excluding Hong Kong and Taiwan
5%Sweden
5%United Kingdom, excluding England and Scotland
5%Czechoslovakia (includes Czech Republic and Slovakia)
5%Taiwan
5%Honduras
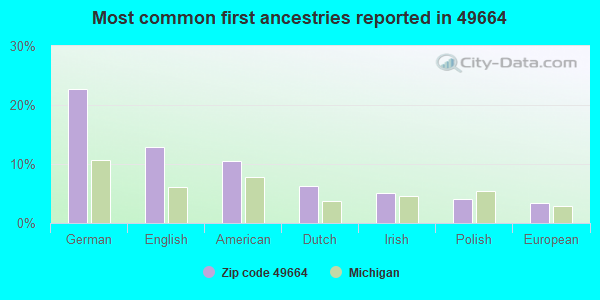
23%German
13%English
11%American
6%Dutch
5%Irish
4%Polish
3%European
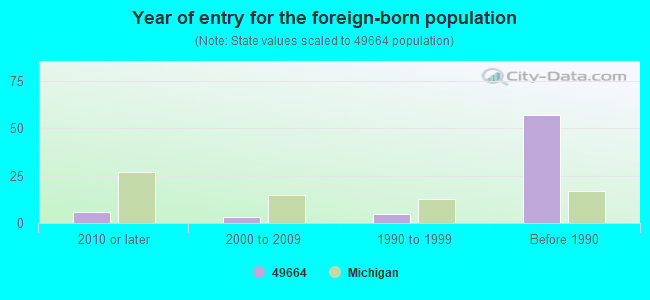
Year of entry for the foreign-born population
62010 or later
32000 to 2009
51990 to 1999
57Before 1990
Facilities with environmental interests located in this zip code:
ELMERS CRANE & DOZER INC (10212 S. COLEMAN RD. 54 INCH CEDAR RAPIDS in MAPLE CITY, MI)
AIR MINOR (AIRS/AFS) (Integrated Compliance Information System) - ICIS-05-1997-0420, FORMAL ENFORCEMENT ACTION CRITERIA AND HAZARDOUS AIR POLLUTANT INVENTORY (Inventory of air pollution sources) Business SIC classification: CONSTRUCTION SAND AND GRAVEL; CONCRETE WORK
GLEN LAKE ELEMENTARY SCHOOL (3375 W. BURDICKVILLE ROAD in MAPLE CITY, MI)
(National Center for Education Statistics) - STATE ID-05119 Organizations: GLEN LAKE COMMUNITY SCHOOLS (SCHOOL DISTRICT)
ELMER'S CRANE & DOZER, INC (M72 KASSON TWSP SEC 20 103 ISC VSI in MAPLE CITY, MI)
AIR MINOR (AIRS/AFS) CRITERIA AND HAZARDOUS AIR POLLUTANT INVENTORY (Inventory of air pollution sources) Business SIC classification: CONSTRUCTION SAND AND GRAVEL; ASPHALT PAVING MIXTURES AND BLOCKS Alternative names: ELMERS CRANE & DOZER INC
GLENS SLF, INCORPORATED (M-78 in MAPLE CITY, MI)
AIR MINOR (AIRS/AFS) Business SIC classification: REFUSE SYSTEMS
ELMERS LIPMAN-DUO KING PO (HULBERT PIT, KASSON CENTER RD. in MAPLE CITY, MI)
AIR MINOR (AIRS/AFS) Business SIC classification: CONSTRUCTION SAND AND GRAVEL
GLENS SANITARY LANDFILL (518 E TRAVERSE HWY in MAPLE CITY, MI)
AIR MAJOR (AIRS/AFS) CRITERIA AND HAZARDOUS AIR POLLUTANT INVENTORY (Inventory of air pollution sources) Business SIC classification: REFUSE SYSTEMS
ELMERS CRANE & DOZER INC (M 72 PIT, KASSON TWP., SEC. 20 NORDBERG HP 200 in MAPLE CITY, MI)
CRITERIA AND HAZARDOUS AIR POLLUTANT INVENTORY (Inventory of air pollution sources) Business SIC classification: CONSTRUCTION SAND AND GRAVEL
Housing units lacking complete plumbing facilities: 0.8% Housing units lacking complete kitchen facilities: 0.5%
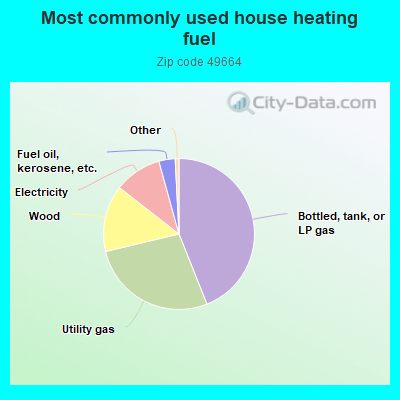
44.1%Bottled, tank, or LP gas
27.4%Utility gas
14.3%Wood
10.2%Electricity
3.5%Fuel oil, kerosene, etc.
Population in 1990: 1,917. Population change in the 1990s: +130 (+6.8%).
Place of birth for U.S.-born residents:
This state: 1,540
Northeast: 37
Midwest: 246
South: 89
West: 78
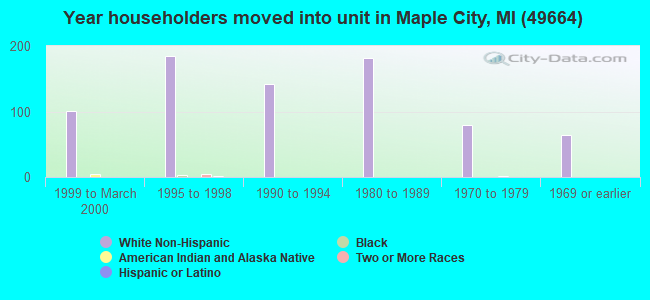
65% of the 49664 zip code residents lived in the same house 5 years ago. Out of people who lived in different houses, 41% lived in this county. Out of people who lived in different counties, 50% lived in Michigan.
94% of the 49664 zip code residents lived in the same house 1 year ago. Out of people who lived in different houses, 30% moved from this county. Out of people who lived in different houses, 43% moved from different county within same state. Out of people who lived in different houses, 26% moved from different state. Out of people who lived in different houses, 4% moved from abroad.
Private vs. public school enrollment:
Students in private schools in grades 1 to 8 (elementary and middle school): 9
Here:
10.2%
Michigan:
12.4%
Students in private schools in grades 9 to 12 (high school): 6
Here:
11.2%
Michigan:
9.8%
Students in private undergraduate colleges: 12
Here:
23.7%
Michigan:
14.9%
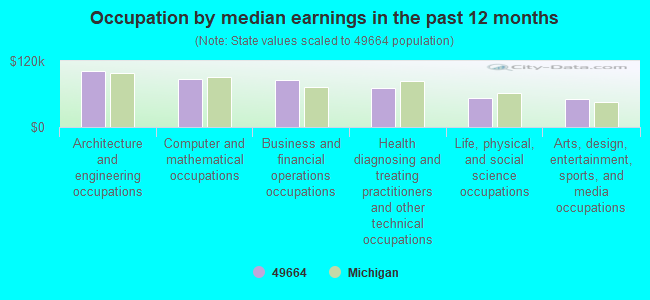
Occupation by median earnings in the past 12 months ($)
102,630Architecture and engineering occupations
87,925Computer and mathematical occupations
85,093Business and financial operations occupations
71,097Health diagnosing and treating practitioners and other technical occupations
53,610Life, physical, and social science occupations
51,321Arts, design, entertainment, sports, and media occupations
Companies with federal contracts located in this zip code:
BINSFELD ENGINEERING INC (4571 W MACFARLANE RD in MAPLE CITY, MI; small business) : $55,324 in 7 contractsfrom 2002 to 2006
Contracts for Miscellaneous Communication Equipment, Radar Equipment, Except Airborne, Radio and Television Communication Equipment, Airborne, Antennas, Waveguides, and Related Equipment, and moreby Army, Department of Defense, U.S. Special Operations Command, Navy, and others Signed by year:2000: $0; 2001: $0; 2002: $2,695; 2003: $28,450; 2004: $6,374; 2005: $10,325; 2006: $7,480.
Biggest contracts:
$22,960 with Army for Miscellaneous Communication Equipment. Signed on 2003-02-27. Completion date: 2003-03-15.
$10,325 with Department of Defense for Radar Equipment, Except Airborne. Signed on 2005-04-20. Completion date: 2005-05-05.
$7,480 with U.S. Special Operations Command for Miscellaneous Communication Equipment. Signed on 2006-03-10. Completion date: 2006-03-17.
$5,490 with Army for Radio and Television Communication Equipment, Airborne. Signed on 2003-04-21. Completion date: 2003-05-03.
SLEEPING BEAR LIGHTNING PROTEC (204 E SPRUCE LN in MAPLE CITY, MI; small business)
$14,915 with Air Force for Maintenance, Repair or Alteration of Real Property -- Other Educational Buildings. Taking place in TX. Signed on 2005-02-09. Completion date: 2005-03-23.
Top industries in this zip code by the number of employees in 2005:
Construction: New Single-Family Housing Construction (except Operative Builders) (20-49 employees: 1 establishment, 1-4 employees: 4 establishments)
Construction: Structural Steel and Precast Concrete Contractors (20-49: 1)
Health Care and Social Assistance: Nursing Care Facilities (20-49: 1)
Accommodation and Food Services: Full-Service Restaurants (10-19: 1, 1-4: 3)
Professional, Scientific, and Technical Services: Research and Development in the Physical, Engineering, and Life Sciences (10-19: 1)
Construction: Water and Sewer Line and Related Structures Construction (10-19: 1)
Accommodation and Food Services: Recreational and Vacation Camps (except Campgrounds) (10-19: 1)
Arts, Entertainment, and Recreation: Fitness and Recreational Sports Centers (10-19: 1)
People in group quarters in 2010:
23 people in nursing facilities/skilled-nursing facilities
6 people in workers' group living quarters and job corps centers
People in group quarters in 2000:
25 people in nursing homes
Fatal accident statistics in 2011:
Fatal accident count: 1
Vehicles involved in fatal accidents: 1
Fatal accidents caused by drunken drivers: 0
Fatalities: 1
Persons involved in fatal accidents: 2
Pedestrians involved in fatal accidents: 0
2002 - 2018 National Fire Incident Reporting System (NFIRS) incidents
According to the data from the years 2002 - 2018 the average number of fires per year is 7. The highest number of reported fire incidents - 20 took place in 2010, and the least - 0 in 2013. The data has a growing trend.
When looking into fire subcategories, the most incidents belonged to: Structure Fires (56.9%), and Outside Fires (31.9%).
Fire incident types reported to NFIRS in Zip Code 49664

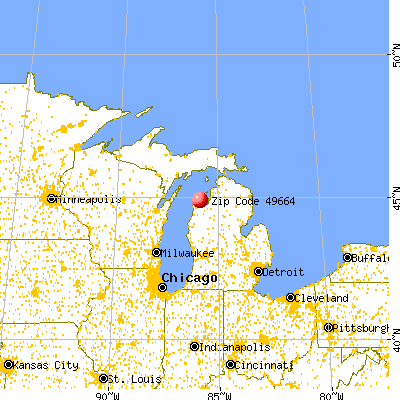


 Nearest zip codes: 49636, 49621, 49630, 49650, 49653, 49640.


 According to the data from the years 2002 - 2018 the average number of fires per year is 7. The highest number of reported fire incidents - 20 took place in 2010, and the least - 0 in 2013. The data has a growing trend.
 When looking into fire subcategories, the most incidents belonged to: Structure Fires (56.9%), and Outside Fires (31.9%).