Estimated zip code population in 2022: 3,200 Zip code population in 2010: 3,703 Zip code population in 2000: 3,490
Houses and condos: 2,701 Renter-occupied apartments: 126
% of renters here:
9%
State:
27%
March 2022 cost of living index in zip code 49633: 81.9 (low, U.S. average is 100)
Land area: 164.3 sq. mi. Water area: 2.8 sq. mi.
Population density: 19 people per square mile
(very low).
OSM Map
General Map
Google Map
MSN Map
OSM Map
General Map
Google Map
MSN Map
OSM Map
General Map
Google Map
MSN Map
OSM Map
General Map
Google Map
MSN Map
Please wait while loading the map...
Real estate property taxes paid for housing units in 2022:
This zip code:
0.8% ($1,479)
Michigan:
1.2% ($2,746)
Median real estate property taxes paid for housing units with mortgages in 2022: $1,688 (0.9%) Median real estate property taxes paid for housing units with no mortgage in 2022: $1,352 (1.0%)
Business Search- 14 Million verified businesses
Males: 1,677
(52.4%)
Females: 1,523
(47.6%)
For population 25 years and over in 49633:
High school or higher: 91.0%
Bachelor's degree or higher: 21.2%
Graduate or professional degree: 6.0%
Unemployed: 4.6%
Mean travel time to work (commute): 38.2 minutes
For population 15 years and over in 49633:
Never married: 18.4%
Now married: 59.1%
Separated: 1.6%
Widowed: 8.1%
Divorced: 12.8%
Zip code 49633 compared to state average:
Black race population percentage significantly below state average.
Hispanic race population percentage below state average.
Median age significantly above state average.
Foreign-born population percentage significantly below state average.
Renting percentage significantly below state average.
Length of stay since moving in above state average.
Averages for the 2020 tax year for zip code 49633, filed in 2021:
Average Adjusted Gross Income (AGI) in 2020: $48,192 (Individual Income Tax Returns)
Here:
$48,192
State:
$68,945
Salary/wage: $42,006 (reported on 75.5% of returns)
Here:
$42,006
State:
$57,142
(% of AGI for various income ranges: 897.3% for AGIs below $25k, 3216.2% for AGIs $25k-50k, 5649.6% for AGIs $50k-75k, 7770.0% for AGIs $75k-100k, 12332.5% for AGIs $100k-200k)
Taxable interest for individuals: $856 (reported on 28.1% of returns)
This zip code:
$856
Michigan:
$1,630
(% of AGI for various income ranges: 12.0% for AGIs below $25k, 19.2% for AGIs $25k-50k, 13.0% for AGIs $50k-75k, 37.3% for AGIs $75k-100k, 165.8% for AGIs $100k-200k)
Ordinary dividends: $3,273 (reported on 11.5% of returns)
Here:
$3,273
State:
$6,972
(% of AGI for various income ranges: 14.9% for AGIs below $25k, 31.9% for AGIs $25k-50k, 25.7% for AGIs $50k-75k, 52.7% for AGIs $75k-100k, 311.7% for AGIs $100k-200k)
Net capital gain/loss in AGI: +$8,145 (reported on 11.5% of returns)
Here:
+$8,145
State:
+$20,064
(% of AGI for various income ranges: 5.5% for AGIs below $25k, 16.2% for AGIs $25k-50k, 13.5% for AGIs $50k-75k, 243.6% for AGIs $75k-100k, 1155.8% for AGIs $100k-200k)
Profit/loss from business: +$9,088 (reported on 12.5% of returns)
Here:
+$9,088
State:
+$11,172
(% of AGI for various income ranges: 64.5% for AGIs below $25k, 128.8% for AGIs $25k-50k, 240.4% for AGIs $50k-75k, 282.7% for AGIs $75k-100k, 308.3% for AGIs $100k-200k)
Taxable individual retirement arrangement distribution: $17,505 (reported on 10.9% of returns)
49633:
$17,505
Michigan:
$19,803
(% of AGI for various income ranges: 82.5% for AGIs below $25k, 82.9% for AGIs $25k-50k, 215.2% for AGIs $50k-75k, 573.6% for AGIs $75k-100k, 1442.5% for AGIs $100k-200k)
Total itemized deductions: $28,800 (reported on 2.1% of returns)
Here:
$28,800
State:
$34,117
(% of AGI for various income ranges: 500.9% for AGIs $50k-75k)
Charity contributions: $12,467 (reported on 1.6% of returns)
Here:
$12,467
State:
$13,548
(% of AGI for various income ranges: 77.9% for AGIs $25k-50k)
Taxes paid: $6,100 (reported on 2.1% of returns)
49633:
$6,100
State:
$7,972
(% of AGI for various income ranges: 203.3% for AGIs $100k-200k)
Earned income credit: $2,148 (reported on 17.2% of returns)
Here:
$2,148
State:
$2,251
(% of AGI for various income ranges: 79.0% for AGIs below $25k, 63.7% for AGIs $25k-50k)
Percentage of individuals using paid preparers for their 2020 taxes: 93.8%
Here:
94%
State:
93%
(% for various income ranges: 91.3% for AGIs below $25k, 96.5% for AGIs $25k-50k, 93.3% for AGIs $50k-75k, 93.3% for AGIs $75k-100k, 94.4% for AGIs $100k-200k, 100.0% for AGIs over 200k)
Averages for the 2012 tax year for zip code 49633, filed in 2013:
Average Adjusted Gross Income (AGI) in 2012: $41,250 (Individual Income Tax Returns)
Here:
$41,250
State:
$55,609
Salary/wage: $33,050 (reported on 81.0% of returns)
Here:
$33,050
State:
$46,782
(% of AGI for various income ranges: 67.6% for AGIs below $25k, 67.7% for AGIs $25k-50k, 71.6% for AGIs $50k-75k, 70.8% for AGIs $75k-100k, 60.1% for AGIs $100k-200k, 46.2% for AGIs over 200k)
Taxable interest for individuals: $833 (reported on 33.1% of returns)
This zip code:
$833
Michigan:
$1,491
(% of AGI for various income ranges: 1.1% for AGIs below $25k, 1.0% for AGIs $25k-50k, 0.6% for AGIs $50k-75k, 0.4% for AGIs $75k-100k, 0.6% for AGIs $100k-200k)
Ordinary dividends: $1,782 (reported on 10.4% of returns)
Here:
$1,782
State:
$6,225
(% of AGI for various income ranges: 0.6% for AGIs below $25k, 0.9% for AGIs $25k-50k, 0.5% for AGIs $50k-75k, 0.4% for AGIs $100k-200k)
Net capital gain/loss in AGI: +$4,021 (reported on 8.6% of returns)
Here:
+$4,021
State:
+$9,326
(% of AGI for various income ranges: 0.2% for AGIs $50k-75k, 5.2% for AGIs $100k-200k)
Profit/loss from business: +$10,633 (reported on 14.7% of returns)
Here:
+$10,633
State:
+$11,523
(% of AGI for various income ranges: 8.6% for AGIs below $25k, 2.9% for AGIs $25k-50k, 2.3% for AGIs $50k-75k, 8.9% for AGIs $100k-200k)
Taxable individual retirement arrangement distribution: $12,295 (reported on 13.5% of returns)
49633:
$12,295
Michigan:
$15,298
(% of AGI for various income ranges: 2.9% for AGIs below $25k, 4.2% for AGIs $25k-50k, 4.0% for AGIs $50k-75k, 4.8% for AGIs $75k-100k, 7.1% for AGIs $100k-200k)
Total itemized deductions: $16,612 (20% of AGI, reported on 20.2% of returns)
Here:
$16,612
State:
$21,628
Here:
20.0% of AGI
State:
18.4% of AGI
(% of AGI for various income ranges: 5.7% for AGIs below $25k, 7.4% for AGIs $25k-50k, 8.9% for AGIs $50k-75k, 9.0% for AGIs $75k-100k, 9.5% for AGIs $100k-200k, 8.2% for AGIs over 200k)
Charity contributions: $2,686 (reported on 13.5% of returns)
Here:
$2,686
State:
$4,225
(% of AGI for various income ranges: 0.4% for AGIs below $25k, 0.5% for AGIs $25k-50k, 0.9% for AGIs $50k-75k, 1.2% for AGIs $75k-100k, 2.1% for AGIs $100k-200k)
Taxes paid: $5,576 (reported on 20.2% of returns)
49633:
$5,576
State:
$8,327
(% of AGI for various income ranges: 1.2% for AGIs below $25k, 1.8% for AGIs $25k-50k, 2.6% for AGIs $50k-75k, 2.8% for AGIs $75k-100k, 3.9% for AGIs $100k-200k, 4.9% for AGIs over 200k)
Earned income credit: $2,019 (reported on 22.7% of returns)
Here:
$2,019
State:
$2,306
(% of AGI for various income ranges: 6.1% for AGIs below $25k, 1.1% for AGIs $25k-50k)
Percentage of individuals using paid preparers for their 2012 taxes: 57.7%
Here:
58%
State:
57%
(% for various income ranges: 52.6% for AGIs below $25k, 59.1% for AGIs $25k-50k, 66.7% for AGIs $50k-75k, 54.5% for AGIs $75k-100k, 66.7% for AGIs $100k-200k, 100.0% for AGIs over 200k)
Averages for the 2004 tax year for zip code 49633, filed in 2005:
Average Adjusted Gross Income (AGI) in 2004: $34,085 (Individual Income Tax Returns)
Here:
$34,085
State:
$48,204
Salary/wage: $29,603 (reported on 82.7% of returns)
Here:
$29,603
State:
$42,791
(% of AGI for various income ranges: 92.6% for AGIs below $10k, 63.8% for AGIs $10k-25k, 76.3% for AGIs $25k-50k, 77.7% for AGIs $50k-75k, 76.7% for AGIs $75k-100k, 58.8% for AGIs over 100k)
Taxable interest for individuals: $1,109 (reported on 48.6% of returns)
This zip code:
$1,109
Michigan:
$1,725
(% of AGI for various income ranges: 4.6% for AGIs below $10k, 2.3% for AGIs $10k-25k, 1.1% for AGIs $25k-50k, 1.5% for AGIs $50k-75k, 1.1% for AGIs $75k-100k, 1.9% for AGIs over 100k)
Taxable dividends: $1,589 (reported on 16.0% of returns)
Here:
$1,589
State:
$3,420
(% of AGI for various income ranges: 2.8% for AGIs below $10k, 0.7% for AGIs $10k-25k, 0.6% for AGIs $25k-50k, 0.6% for AGIs $50k-75k, 0.2% for AGIs $75k-100k, 1.2% for AGIs over 100k)
Net capital gain/loss: +$2,876 (reported on 14.1% of returns)
Here:
+$2,876
State:
+$8,532
(% of AGI for various income ranges: -1.2% for AGIs below $10k, 1.6% for AGIs $10k-25k, 1.3% for AGIs $25k-50k, 0.1% for AGIs $50k-75k, 2.9% for AGIs over 100k)
Profit/loss from business: +$6,892 (reported on 17.4% of returns)
Here:
+$6,892
State:
+$9,547
(% of AGI for various income ranges: 1.4% for AGIs below $10k, 7.3% for AGIs $10k-25k, 2.6% for AGIs $25k-50k, 2.9% for AGIs $50k-75k, 0.4% for AGIs $75k-100k, 4.6% for AGIs over 100k)
IRA payment deduction: $3,283 (reported on 3.0% of returns)
49633:
$3,283
Michigan:
$2,875
Total itemized deductions: $14,796 (24% of AGI, reported on 25.9% of returns)
Here:
$14,796
State:
$18,509
Here:
24.3% of AGI
State:
20.7% of AGI
(% of AGI for various income ranges: 13.1% for AGIs below $10k, 8.5% for AGIs $10k-25k, 9.9% for AGIs $25k-50k, 13.5% for AGIs $50k-75k, 13.0% for AGIs $75k-100k, 11.6% for AGIs over 100k)
Charity contributions deductions: $1,851 (3% of AGI, reported on 19.5% of returns)
Here:
$1,851
State:
$3,365
Here:
2.8% of AGI
State:
3.6% of AGI
(% of AGI for various income ranges: 0.4% for AGIs below $10k, 0.8% for AGIs $10k-25k, 0.8% for AGIs $25k-50k, 1.0% for AGIs $50k-75k, 1.5% for AGIs $75k-100k, 1.8% for AGIs over 100k)
Total tax: $4,218 (reported on 71.3% of returns)
49633:
$4,218
State:
$7,691
(% of AGI for various income ranges: 3.4% for AGIs below $10k, 4.0% for AGIs $10k-25k, 6.1% for AGIs $25k-50k, 8.1% for AGIs $50k-75k, 11.0% for AGIs $75k-100k, 17.7% for AGIs over 100k)
Earned income credit: $1,750 (reported on 18.6% of returns)
Here:
$1,750
State:
$1,737
Percentage of individuals using paid preparers for their 2004 taxes: 59.7%
Here:
60%
State:
60%
(% for various income ranges: 49.8% for AGIs below $10k, 60.1% for AGIs $10k-25k, 61.6% for AGIs $25k-50k, 59.8% for AGIs $50k-75k, 77.6% for AGIs $75k-100k, 78.5% for AGIs over 100k)
Likely homosexual households (counted as self-reported same-sex unmarried-partner households)
Lesbian couples: 0.1% of all households
Gay men: 0.0% of all households
Household received Food Stamps/SNAP in the past 12 months: 148 Household did not receive Food Stamps/SNAP in the past 12 months: 1,309
Women who had a birth in the past 12 months: 10 (1 now married, 8 unmarried) Women who did not have a birth in the past 12 months: 521 (297 now married, 222 unmarried)
Housing units in zip code 49633 with a mortgage: 713 (44 second mortgage, 40 both second mortgage and home equity loan) Houses without a mortgage: 11
Median monthly owner costs for units with a mortgage: $1,143 Median monthly owner costs for units without a mortgage: $443
Residents with income below the poverty level in 2022:
This zip code:
11.1%
Whole state:
13.4%
Residents with income below 50% of the poverty level in 2022:
This zip code:
7.1%
Whole state:
6.9%
Median number of rooms in houses and condos:
Here:
5.4
State:
6.5
Median number of rooms in apartments:
Here:
5.5
State:
4.3
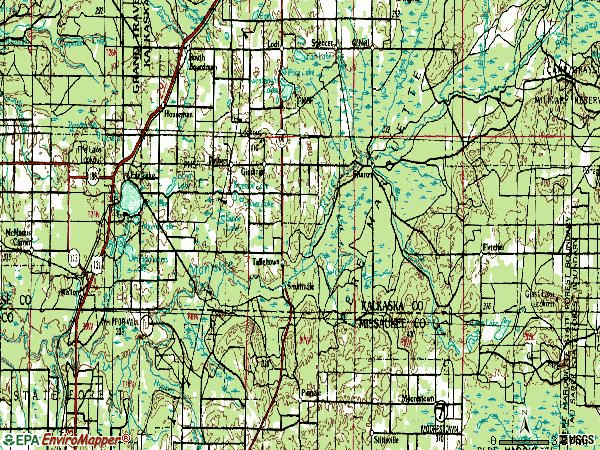
Notable locations in this zip code not listed on our city pages
Notable locations in zip code 49633: CCC Bridge State Forest Campground (A), Smithville Forest Campground (B), Walton Station (C), Fife Lake Station (D), Spring Lake Campground (E), Hopkins Creek Trail Campground (F), Fife Lake Area Historical Museum (G), Fife Lake Area Emergency Medical Services (H), Garfield Township Hall (I), Garfield Township Fire Department (J). Display/hide their locations on the map
Churches in zip code 49633 include: Fife Lake Baptist Church (A), Fife Lake United Methodist Church (B), Saint Aloysius Catholic Church (C), Garfield Country Church (D), Springfield Church (E). Display/hide their locations on the map
Cemeteries: Saint Aloysius Cemetery (1), Fife Lake Cemetery (2), Walton Cemetery (3), Clark Cemetery (4), Garfield Cemetery (5). Display/hide their locations on the map
Lakes and swamps: Long Lake (A), Pickerel Lake (B), Walton Marsh (C), Parsons Lake (D), Jones Lake (E), Ingersoll Lake (F), Holbrook Lake (G), Headquarters Lake (H). Display/hide their locations on the map
Streams, rivers, and creeks: Waterhole Creek (A), Pierson Creek (B), Fife Lake Outlet (C), Gould Creek (D), Big Cannon Creek (E), Big Devil Creek (F), Ham Creek (G), Filer Creek (H), Inlet Creek (I). Display/hide their locations on the map
Parks in zip code 49633 include: Fife Lake Area Park (1), Fife Lake City Park (2), Fife Lake Union District Number One Schoolhouse Historical Marker (3). Display/hide their locations on the map
In group quarters: 34 (-1 institutionalized population)
Size of family households: 664 2-persons, 98 3-persons, 135 4-persons, 70 5-persons, 5 6-persons, 3 7-or-more-persons
Size of nonfamily households: 404 1-person, 79 2-persons, 7 3-persons
335 married couples with children.
79 single-parent households (19 men, 60 women).
98.8% of residents of 49633 zip code speak English at home.
0.1% of residents speak Spanish at home (100% very well).
0.9% of residents speak other Indo-European language at home (93% very well, 7% well).
0.2% of residents speak Asian or Pacific Island language at home (40% very well, 60% well).
Foreign born population: 26 (0.8%) (89.0% of them are naturalized citizens)
This zip code:
0.8%
Whole state:
6.9%
27%China, excluding Hong Kong and Taiwan
15%France
12%Bhutan
8%Japan
4%Sweden
4%Malaysia
28%German
13%English
12%American
8%Irish
4%Scandinavian
4%Polish
3%Italian
Year of entry for the foreign-born population
72010 or later
92000 to 2009
101990 to 1999
16Before 1990
Facilities with environmental interests located in this zip code:
GORDIES PLACE (108 STATE STREET in FIFE LAKE, MI)
(Integrated Compliance Information System) - ICIS-05-2006-4834, ENFORCEMENT/COMPLIANCE ACTIVITY FORMAL ENFORCEMENT ACTION (Integrated Compliance Information System) - ICIS-05-2006-4834, ENFORCEMENT/COMPLIANCE ACTIVITY
FIFE LAKE ELEMENTARY SCHOOL (108 PIERCE STREET in FIFE LAKE, MI)
(National Center for Education Statistics) - STATE ID-05097 Organizations: FOREST AREA COMMUNITY SCHOOLS (SCHOOL DISTRICT)
FOREST AREA HIGH SCHOOL (7661 SHIPPY ROAD SW in FIFE LAKE, MI)
(National Center for Education Statistics) - STATE ID-06632 Organizations: FOREST AREA COMMUNITY SCHOOLS (SCHOOL DISTRICT)
FOREST AREA MIDDLE SCHOOL (7761 SHIPPY ROAD SW in FIFE LAKE, MI)
(National Center for Education Statistics) - STATE ID-07881 Organizations: FOREST AREA COMMUNITY SCHOOLS (SCHOOL DISTRICT)
FIFE LAKE SCHOOLS (100 SHIPPY RD in FIFE LAKE, MI)
(Resource Conservation and Recovery Act (tracking hazardous waste))
AMOCO PRODUCTION COMPANY (SECTION 11 UNION in FIFE LAKE, MI)
AIR MAJOR (AIRS/AFS) CRITERIA AND HAZARDOUS AIR POLLUTANT INVENTORY (Inventory of air pollution sources) Business SIC classification: CRUDE PETROLEUM AND NATURAL GAS; MIXED, MANUFACTURED, OR LIQUEFIED PETROLEUM GAS PRODUCTION AND/OR DISTRIBUTION Business NAICS classification: CRUDE PETROLEUM AND NATURAL GAS EXTRACTION.
BDD INC (11854 US 131 in FIFE LAKE, MI)
Small Quantity Generators, between 100 kg and 1000 kg of hazardous waste/month (Resource Conservation and Recovery Act (tracking hazardous waste)) Organizations: DOUBLE D INVESTMENT CO (CONTACT/OPERATOR)
Housing units lacking complete plumbing facilities: 6.4% Housing units lacking complete kitchen facilities: 5.3%
40.4%Bottled, tank, or LP gas
25.3%Wood
23.5%Utility gas
5.9%Fuel oil, kerosene, etc.
2.7%Electricity
2.4%Other fuel
Population in 1990: 2,566. Population change in the 1990s: +924 (+36.0%).
Place of birth for U.S.-born residents:
This state: 2,687
Northeast: 47
Midwest: 170
South: 150
West: 97
60% of the 49633 zip code residents lived in the same house 5 years ago. Out of people who lived in different houses, 30% lived in this county. Out of people who lived in different counties, 50% lived in Michigan.
94% of the 49633 zip code residents lived in the same house 1 year ago. Out of people who lived in different houses, 28% moved from this county. Out of people who lived in different houses, 61% moved from different county within same state. Out of people who lived in different houses, 12% moved from different state. Out of people who lived in different houses, 2% moved from abroad.
Private vs. public school enrollment:
Students in private schools in grades 1 to 8 (elementary and middle school): 28
Here:
14.5%
Michigan:
12.4%
Students in private schools in grades 9 to 12 (high school): 5
Here:
4.8%
Michigan:
9.8%
Students in private undergraduate colleges: 5
Here:
9.0%
Michigan:
14.9%
Occupation by median earnings in the past 12 months ($)
97,305Installation, maintenance, and repair occupations
93,956Computer and mathematical occupations
81,368Management occupations
73,170Health diagnosing and treating practitioners and other technical occupations
60,424Community and social service occupations
52,779Business and financial operations occupations
Top industries in this zip code by the number of employees in 2005:
Finance and Insurance: Credit Unions (20-49 employees: 1 establishment)
Construction: All Other Specialty Trade Contractors (10-19: 1)
Accommodation and Food Services: Bed-and-Breakfast Inns (10-19: 1)
Health Care and Social Assistance: All Other Miscellaneous Ambulatory Health Care Services (10-19: 1)
Finance and Insurance: Investment Advice (10-19: 1)
Health Care and Social Assistance: Offices of Dentists (10-19: 1)
People in group quarters in 2010:
20 people in group homes intended for adults
People in group quarters in 2000:
5 people in other group homes
3 people in homes or halfway houses for drug/alcohol abuse
3 people in homes for the mentally retarded
Fatal accident statistics in 2013:
Fatal accident count: 1
Vehicles involved in fatal accidents: 1
Fatal accidents caused by drunken drivers: 1
Fatalities: 1
Persons involved in fatal accidents: 1
Pedestrians involved in fatal accidents: 0
Fatal accident statistics in 2011:
Fatal accident count: 1
Vehicles involved in fatal accidents: 1
Fatal accidents caused by drunken drivers: 1
Fatalities: 1
Persons involved in fatal accidents: 1
Pedestrians involved in fatal accidents: 0
2002 - 2018 National Fire Incident Reporting System (NFIRS) incidents
According to the data from the years 2002 - 2018 the average number of fires per year is 34. The highest number of reported fires - 54 took place in 2003, and the least - 5 in 2014. The data has a dropping trend.
When looking into fire subcategories, the most incidents belonged to: Structure Fires (46.2%), and Outside Fires (38.5%).
Fire incident types reported to NFIRS in Zip Code 49633

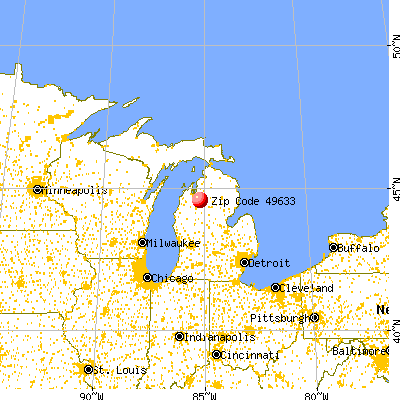


 Nearest zip codes: 49680, 49651, 49663, 49646, 49676, 49690.


 According to the data from the years 2002 - 2018 the average number of fires per year is 34. The highest number of reported fires - 54 took place in 2003, and the least - 5 in 2014. The data has a dropping trend.
 When looking into fire subcategories, the most incidents belonged to: Structure Fires (46.2%), and Outside Fires (38.5%).