Estimated zip code population in 2022: 11,092
Zip code population in 2010: 10,565
Zip code population in 2000: 9,587
Houses and condos: 4,947
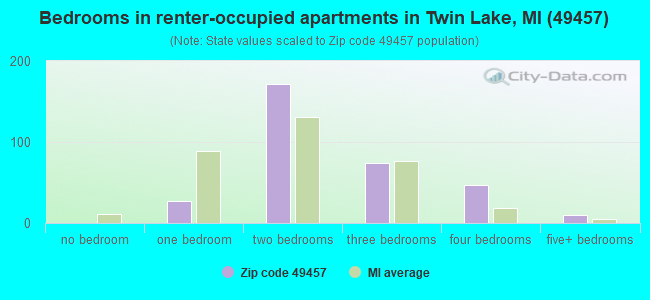
Renter-occupied apartments: 327
% of renters here:
8%State:
27%
March 2022 cost of living index in zip code 49457: 81.4
(low, U.S. average is 100)
Land area: 76.7
sq. mi.
Water area: 4.5
sq. mi.
Population density: 145 people per square mile (very low).
OSM Map
General Map
Google Map
MSN Map
OSM Map
General Map
Google Map
MSN Map
OSM Map
General Map
Google Map
MSN Map
OSM Map
General Map
Google Map
MSN Map
Please wait while loading the map...
Real estate property taxes paid for housing units in 2022:
This zip code:
1.2% ($2,337)Michigan:
1.2% ($2,746)
Median real estate property taxes paid for housing units with mortgages in 2022: $2,422 (1.2%)
Median real estate property taxes paid for housing units with no mortgage in 2022: $2,200 (1.2%)
Business Search - 14 Million verified businesses
Males: 5,590 Females: 5,501
For population 25 years and over in 49457:
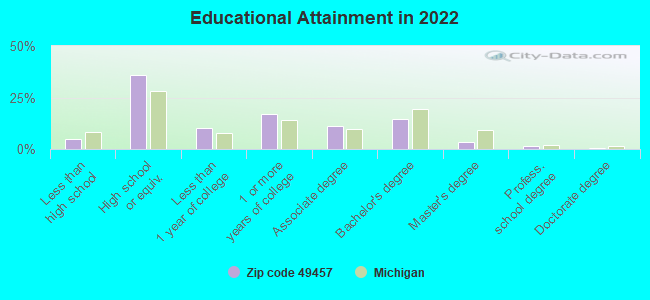
High school or higher: 94.4%Bachelor's degree or higher: 20.1%Graduate or professional degree: 5.5%Unemployed: 6.6%Mean travel time to work (commute): 24.8 minutes
For population 15 years and over in 49457:
Never married: 25.3%Now married: 56.7%Separated: 0.9%Widowed: 5.5%Divorced: 11.6%
Zip code 49457 compared to state average:
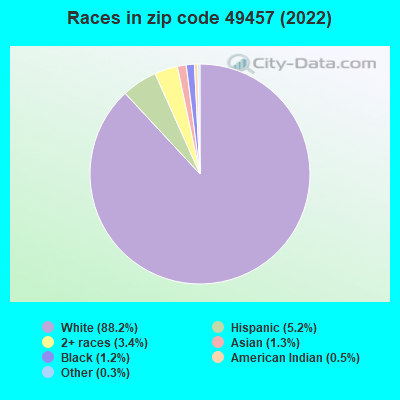
Black race population percentage significantly below state average. Foreign-born population percentage significantly below state average. Renting percentage significantly below state average. Length of stay since moving in significantly above state average. House age below state average. Percentage of population with a bachelor's degree or higher below state average. 9,782 88.2% White 582 5.2% Hispanic or Latino 372 3.4% Two or more races 139 1.3% Asian 134 1.2% Black 51 0.5% American Indian 28 0.3% Some other race
Data:
Median household income ($)
Median household income (% change since 2000)
Household income diversity
Ratio of average income to average house value (%)
Ratio of average income to average rent
Median household income ($) - White
Median household income ($) - Black or African American
Median household income ($) - Asian
Median household income ($) - Hispanic or Latino
Median household income ($) - American Indian and Alaska Native
Median household income ($) - Multirace
Median household income ($) - Other Race
Median household income for houses/condos with a mortgage ($)
Median household income for apartments without a mortgage ($)
Races - White alone (%)
Races - White alone (% change since 2000)
Races - Black alone (%)
Races - Black alone (% change since 2000)
Races - American Indian alone (%)
Races - American Indian alone (% change since 2000)
Races - Asian alone (%)
Races - Asian alone (% change since 2000)
Races - Hispanic (%)
Races - Hispanic (% change since 2000)
Races - Native Hawaiian and Other Pacific Islander alone (%)
Races - Native Hawaiian and Other Pacific Islander alone (% change since 2000)
Races - Two or more races (%)
Races - Two or more races (% change since 2000)
Races - Other race alone (%)
Races - Other race alone (% change since 2000)
Racial diversity
Unemployment (%)
Unemployment (% change since 2000)
Unemployment (%) - White
Unemployment (%) - Black or African American
Unemployment (%) - Asian
Unemployment (%) - Hispanic or Latino
Unemployment (%) - American Indian and Alaska Native
Unemployment (%) - Multirace
Unemployment (%) - Other Race
Population density (people per square mile)
Population - Males (%)
Population - Females (%)
Population - Males (%) - White
Population - Males (%) - Black or African American
Population - Males (%) - Asian
Population - Males (%) - Hispanic or Latino
Population - Males (%) - American Indian and Alaska Native
Population - Males (%) - Multirace
Population - Males (%) - Other Race
Population - Females (%) - White
Population - Females (%) - Black or African American
Population - Females (%) - Asian
Population - Females (%) - Hispanic or Latino
Population - Females (%) - American Indian and Alaska Native
Population - Females (%) - Multirace
Population - Females (%) - Other Race
Coronavirus confirmed cases (May 23, 2024)
Deaths caused by coronavirus (May 23, 2024)
Coronavirus confirmed cases (per 100k population) (May 23, 2024)
Deaths caused by coronavirus (per 100k population) (May 23, 2024)
Daily increase in number of cases (May 23, 2024)
Weekly increase in number of cases (May 23, 2024)
Cases doubled (in days) (May 23, 2024)
Hospitalized patients (Apr 18, 2022)
Negative test results (Apr 18, 2022)
Total test results (Apr 18, 2022)
COVID Vaccine doses distributed (per 100k population) (Sep 19, 2023)
COVID Vaccine doses administered (per 100k population) (Sep 19, 2023)
COVID Vaccine doses distributed (Sep 19, 2023)
COVID Vaccine doses administered (Sep 19, 2023)
Likely homosexual households (%)
Likely homosexual households (% change since 2000)
Likely homosexual households - Lesbian couples (%)
Likely homosexual households - Lesbian couples (% change since 2000)
Likely homosexual households - Gay men (%)
Likely homosexual households - Gay men (% change since 2000)
Cost of living index
Median gross rent ($)
Median contract rent ($)
Median monthly housing costs ($)
Median house or condo value ($)
Median house or condo value ($ change since 2000)
Mean house or condo value by units in structure - 1, detached ($)
Mean house or condo value by units in structure - 1, attached ($)
Mean house or condo value by units in structure - 2 ($)
Mean house or condo value by units in structure by units in structure - 3 or 4 ($)
Mean house or condo value by units in structure - 5 or more ($)
Mean house or condo value by units in structure - Boat, RV, van, etc. ($)
Mean house or condo value by units in structure - Mobile home ($)
Median house or condo value ($) - White
Median house or condo value ($) - Black or African American
Median house or condo value ($) - Asian
Median house or condo value ($) - Hispanic or Latino
Median house or condo value ($) - American Indian and Alaska Native
Median house or condo value ($) - Multirace
Median house or condo value ($) - Other Race
Median resident age
Resident age diversity
Median resident age - Males
Median resident age - Females
Median resident age - White
Median resident age - Black or African American
Median resident age - Asian
Median resident age - Hispanic or Latino
Median resident age - American Indian and Alaska Native
Median resident age - Multirace
Median resident age - Other Race
Median resident age - Males - White
Median resident age - Males - Black or African American
Median resident age - Males - Asian
Median resident age - Males - Hispanic or Latino
Median resident age - Males - American Indian and Alaska Native
Median resident age - Males - Multirace
Median resident age - Males - Other Race
Median resident age - Females - White
Median resident age - Females - Black or African American
Median resident age - Females - Asian
Median resident age - Females - Hispanic or Latino
Median resident age - Females - American Indian and Alaska Native
Median resident age - Females - Multirace
Median resident age - Females - Other Race
Commute - mean travel time to work (minutes)
Travel time to work - Less than 5 minutes (%)
Travel time to work - Less than 5 minutes (% change since 2000)
Travel time to work - 5 to 9 minutes (%)
Travel time to work - 5 to 9 minutes (% change since 2000)
Travel time to work - 10 to 19 minutes (%)
Travel time to work - 10 to 19 minutes (% change since 2000)
Travel time to work - 20 to 29 minutes (%)
Travel time to work - 20 to 29 minutes (% change since 2000)
Travel time to work - 30 to 39 minutes (%)
Travel time to work - 30 to 39 minutes (% change since 2000)
Travel time to work - 40 to 59 minutes (%)
Travel time to work - 40 to 59 minutes (% change since 2000)
Travel time to work - 60 to 89 minutes (%)
Travel time to work - 60 to 89 minutes (% change since 2000)
Travel time to work - 90 or more minutes (%)
Travel time to work - 90 or more minutes (% change since 2000)
Marital status - Never married (%)
Marital status - Now married (%)
Marital status - Separated (%)
Marital status - Widowed (%)
Marital status - Divorced (%)
Median family income ($)
Median family income (% change since 2000)
Median non-family income ($)
Median non-family income (% change since 2000)
Median per capita income ($)
Median per capita income (% change since 2000)
Median family income ($) - White
Median family income ($) - Black or African American
Median family income ($) - Asian
Median family income ($) - Hispanic or Latino
Median family income ($) - American Indian and Alaska Native
Median family income ($) - Multirace
Median family income ($) - Other Race
Median year house/condo built
Median year apartment built
Year house built - Built 2005 or later (%)
Year house built - Built 2000 to 2004 (%)
Year house built - Built 1990 to 1999 (%)
Year house built - Built 1980 to 1989 (%)
Year house built - Built 1970 to 1979 (%)
Year house built - Built 1960 to 1969 (%)
Year house built - Built 1950 to 1959 (%)
Year house built - Built 1940 to 1949 (%)
Year house built - Built 1939 or earlier (%)
Average household size
Household density (households per square mile)
Average household size - White
Average household size - Black or African American
Average household size - Asian
Average household size - Hispanic or Latino
Average household size - American Indian and Alaska Native
Average household size - Multirace
Average household size - Other Race
Occupied housing units (%)
Vacant housing units (%)
Owner occupied housing units (%)
Renter occupied housing units (%)
Vacancy status - For rent (%)
Vacancy status - For sale only (%)
Vacancy status - Rented or sold, not occupied (%)
Vacancy status - For seasonal, recreational, or occasional use (%)
Vacancy status - For migrant workers (%)
Vacancy status - Other vacant (%)
Residents with income below the poverty level (%)
Residents with income below 50% of the poverty level (%)
Children below poverty level (%)
Poor families by family type - Married-couple family (%)
Poor families by family type - Male, no wife present (%)
Poor families by family type - Female, no husband present (%)
Poverty status for native-born residents (%)
Poverty status for foreign-born residents (%)
Poverty among high school graduates not in families (%)
Poverty among people who did not graduate high school not in families (%)
Residents with income below the poverty level (%) - White
Residents with income below the poverty level (%) - Black or African American
Residents with income below the poverty level (%) - Asian
Residents with income below the poverty level (%) - Hispanic or Latino
Residents with income below the poverty level (%) - American Indian and Alaska Native
Residents with income below the poverty level (%) - Multirace
Residents with income below the poverty level (%) - Other Race
Air pollution - Air Quality Index (AQI)
Air pollution - CO
Air pollution - NO2
Air pollution - SO2
Air pollution - Ozone
Air pollution - PM10
Air pollution - PM25
Air pollution - Pb
Crime - Murders per 100,000 population
Crime - Rapes per 100,000 population
Crime - Robberies per 100,000 population
Crime - Assaults per 100,000 population
Crime - Burglaries per 100,000 population
Crime - Thefts per 100,000 population
Crime - Auto thefts per 100,000 population
Crime - Arson per 100,000 population
Crime - City-data.com crime index
Crime - Violent crime index
Crime - Property crime index
Crime - Murders per 100,000 population (5 year average)
Crime - Rapes per 100,000 population (5 year average)
Crime - Robberies per 100,000 population (5 year average)
Crime - Assaults per 100,000 population (5 year average)
Crime - Burglaries per 100,000 population (5 year average)
Crime - Thefts per 100,000 population (5 year average)
Crime - Auto thefts per 100,000 population (5 year average)
Crime - Arson per 100,000 population (5 year average)
Crime - City-data.com crime index (5 year average)
Crime - Violent crime index (5 year average)
Crime - Property crime index (5 year average)
1996 Presidential Elections Results (%) - Democratic Party (Clinton)
1996 Presidential Elections Results (%) - Republican Party (Dole)
1996 Presidential Elections Results (%) - Other
2000 Presidential Elections Results (%) - Democratic Party (Gore)
2000 Presidential Elections Results (%) - Republican Party (Bush)
2000 Presidential Elections Results (%) - Other
2004 Presidential Elections Results (%) - Democratic Party (Kerry)
2004 Presidential Elections Results (%) - Republican Party (Bush)
2004 Presidential Elections Results (%) - Other
2008 Presidential Elections Results (%) - Democratic Party (Obama)
2008 Presidential Elections Results (%) - Republican Party (McCain)
2008 Presidential Elections Results (%) - Other
2012 Presidential Elections Results (%) - Democratic Party (Obama)
2012 Presidential Elections Results (%) - Republican Party (Romney)
2012 Presidential Elections Results (%) - Other
2016 Presidential Elections Results (%) - Democratic Party (Clinton)
2016 Presidential Elections Results (%) - Republican Party (Trump)
2016 Presidential Elections Results (%) - Other
2020 Presidential Elections Results (%) - Democratic Party (Biden)
2020 Presidential Elections Results (%) - Republican Party (Trump)
2020 Presidential Elections Results (%) - Other
Ancestries Reported - Arab (%)
Ancestries Reported - Czech (%)
Ancestries Reported - Danish (%)
Ancestries Reported - Dutch (%)
Ancestries Reported - English (%)
Ancestries Reported - French (%)
Ancestries Reported - French Canadian (%)
Ancestries Reported - German (%)
Ancestries Reported - Greek (%)
Ancestries Reported - Hungarian (%)
Ancestries Reported - Irish (%)
Ancestries Reported - Italian (%)
Ancestries Reported - Lithuanian (%)
Ancestries Reported - Norwegian (%)
Ancestries Reported - Polish (%)
Ancestries Reported - Portuguese (%)
Ancestries Reported - Russian (%)
Ancestries Reported - Scotch-Irish (%)
Ancestries Reported - Scottish (%)
Ancestries Reported - Slovak (%)
Ancestries Reported - Subsaharan African (%)
Ancestries Reported - Swedish (%)
Ancestries Reported - Swiss (%)
Ancestries Reported - Ukrainian (%)
Ancestries Reported - United States (%)
Ancestries Reported - Welsh (%)
Ancestries Reported - West Indian (%)
Ancestries Reported - Other (%)
Educational Attainment - No schooling completed (%)
Educational Attainment - Less than high school (%)
Educational Attainment - High school or equivalent (%)
Educational Attainment - Less than 1 year of college (%)
Educational Attainment - 1 or more years of college (%)
Educational Attainment - Associate degree (%)
Educational Attainment - Bachelor's degree (%)
Educational Attainment - Master's degree (%)
Educational Attainment - Professional school degree (%)
Educational Attainment - Doctorate degree (%)
School Enrollment - Nursery, preschool (%)
School Enrollment - Kindergarten (%)
School Enrollment - Grade 1 to 4 (%)
School Enrollment - Grade 5 to 8 (%)
School Enrollment - Grade 9 to 12 (%)
School Enrollment - College undergrad (%)
School Enrollment - Graduate or professional (%)
School Enrollment - Not enrolled in school (%)
School enrollment - Public schools (%)
School enrollment - Private schools (%)
School enrollment - Not enrolled (%)
Median number of rooms in houses and condos
Median number of rooms in apartments
Housing units lacking complete plumbing facilities (%)
Housing units lacking complete kitchen facilities (%)
Density of houses
Urban houses (%)
Rural houses (%)
Households with people 60 years and over (%)
Households with people 65 years and over (%)
Households with people 75 years and over (%)
Households with one or more nonrelatives (%)
Households with no nonrelatives (%)
Population in households (%)
Family households (%)
Nonfamily households (%)
Population in families (%)
Family households with own children (%)
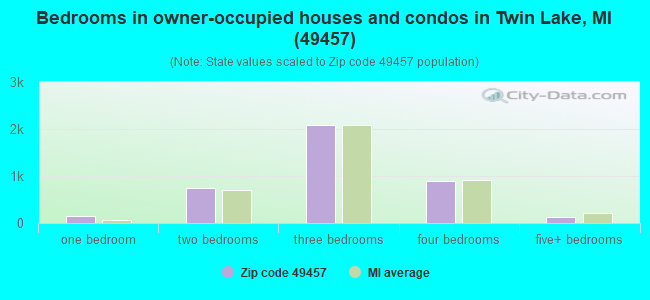
Median number of bedrooms in owner occupied houses
Mean number of bedrooms in owner occupied houses
Median number of bedrooms in renter occupied houses
Mean number of bedrooms in renter occupied houses
Median number of vehichles in owner occupied houses
Mean number of vehichles in owner occupied houses
Median number of vehichles in renter occupied houses
Mean number of vehichles in renter occupied houses
Mortgage status - with mortgage (%)
Mortgage status - with second mortgage (%)
Mortgage status - with home equity loan (%)
Mortgage status - with both second mortgage and home equity loan (%)
Mortgage status - without a mortgage (%)
Average family size
Average family size - White
Average family size - Black or African American
Average family size - Asian
Average family size - Hispanic or Latino
Average family size - American Indian and Alaska Native
Average family size - Multirace
Average family size - Other Race
Geographical mobility - Same house 1 year ago (%)
Geographical mobility - Moved within same county (%)
Geographical mobility - Moved from different county within same state (%)
Geographical mobility - Moved from different state (%)
Geographical mobility - Moved from abroad (%)
Place of birth - Born in state of residence (%)
Place of birth - Born in other state (%)
Place of birth - Native, outside of US (%)
Place of birth - Foreign born (%)
Housing units in structures - 1, detached (%)
Housing units in structures - 1, attached (%)
Housing units in structures - 2 (%)
Housing units in structures - 3 or 4 (%)
Housing units in structures - 5 to 9 (%)
Housing units in structures - 10 to 19 (%)
Housing units in structures - 20 to 49 (%)
Housing units in structures - 50 or more (%)
Housing units in structures - Mobile home (%)
Housing units in structures - Boat, RV, van, etc. (%)
House/condo owner moved in on average (years ago)
Renter moved in on average (years ago)
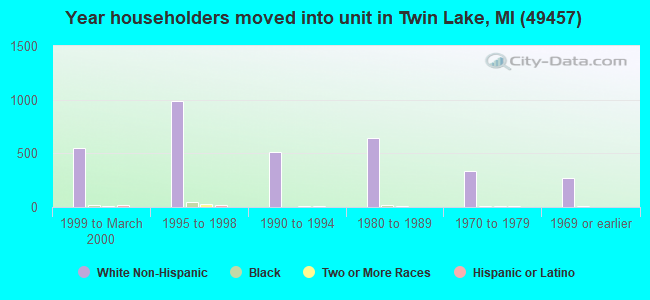
Year householder moved into unit - Moved in 1999 to March 2000 (%)
Year householder moved into unit - Moved in 1995 to 1998 (%)
Year householder moved into unit - Moved in 1990 to 1994 (%)
Year householder moved into unit - Moved in 1980 to 1989 (%)
Year householder moved into unit - Moved in 1970 to 1979 (%)
Year householder moved into unit - Moved in 1969 or earlier (%)
Means of transportation to work - Drove car alone (%)
Means of transportation to work - Carpooled (%)
Means of transportation to work - Public transportation (%)
Means of transportation to work - Bus or trolley bus (%)
Means of transportation to work - Streetcar or trolley car (%)
Means of transportation to work - Subway or elevated (%)
Means of transportation to work - Railroad (%)
Means of transportation to work - Ferryboat (%)
Means of transportation to work - Taxicab (%)
Means of transportation to work - Motorcycle (%)
Means of transportation to work - Bicycle (%)
Means of transportation to work - Walked (%)
Means of transportation to work - Other means (%)
Working at home (%)
Industry diversity
Most Common Industries - Agriculture, forestry, fishing and hunting, and mining (%)
Most Common Industries - Agriculture, forestry, fishing and hunting (%)
Most Common Industries - Mining, quarrying, and oil and gas extraction (%)
Most Common Industries - Construction (%)
Most Common Industries - Manufacturing (%)
Most Common Industries - Wholesale trade (%)
Most Common Industries - Retail trade (%)
Most Common Industries - Transportation and warehousing, and utilities (%)
Most Common Industries - Transportation and warehousing (%)
Most Common Industries - Utilities (%)
Most Common Industries - Information (%)
Most Common Industries - Finance and insurance, and real estate and rental and leasing (%)
Most Common Industries - Finance and insurance (%)
Most Common Industries - Real estate and rental and leasing (%)
Most Common Industries - Professional, scientific, and management, and administrative and waste management services (%)
Most Common Industries - Professional, scientific, and technical services (%)
Most Common Industries - Management of companies and enterprises (%)
Most Common Industries - Administrative and support and waste management services (%)
Most Common Industries - Educational services, and health care and social assistance (%)
Most Common Industries - Educational services (%)
Most Common Industries - Health care and social assistance (%)
Most Common Industries - Arts, entertainment, and recreation, and accommodation and food services (%)
Most Common Industries - Arts, entertainment, and recreation (%)
Most Common Industries - Accommodation and food services (%)
Most Common Industries - Other services, except public administration (%)
Most Common Industries - Public administration (%)
Occupation diversity
Most Common Occupations - Management, business, science, and arts occupations (%)
Most Common Occupations - Management, business, and financial occupations (%)
Most Common Occupations - Management occupations (%)
Most Common Occupations - Business and financial operations occupations (%)
Most Common Occupations - Computer, engineering, and science occupations (%)
Most Common Occupations - Computer and mathematical occupations (%)
Most Common Occupations - Architecture and engineering occupations (%)
Most Common Occupations - Life, physical, and social science occupations (%)
Most Common Occupations - Education, legal, community service, arts, and media occupations (%)
Most Common Occupations - Community and social service occupations (%)
Most Common Occupations - Legal occupations (%)
Most Common Occupations - Education, training, and library occupations (%)
Most Common Occupations - Arts, design, entertainment, sports, and media occupations (%)
Most Common Occupations - Healthcare practitioners and technical occupations (%)
Most Common Occupations - Health diagnosing and treating practitioners and other technical occupations (%)
Most Common Occupations - Health technologists and technicians (%)
Most Common Occupations - Service occupations (%)
Most Common Occupations - Healthcare support occupations (%)
Most Common Occupations - Protective service occupations (%)
Most Common Occupations - Fire fighting and prevention, and other protective service workers including supervisors (%)
Most Common Occupations - Law enforcement workers including supervisors (%)
Most Common Occupations - Food preparation and serving related occupations (%)
Most Common Occupations - Building and grounds cleaning and maintenance occupations (%)
Most Common Occupations - Personal care and service occupations (%)
Most Common Occupations - Sales and office occupations (%)
Most Common Occupations - Sales and related occupations (%)
Most Common Occupations - Office and administrative support occupations (%)
Most Common Occupations - Natural resources, construction, and maintenance occupations (%)
Most Common Occupations - Farming, fishing, and forestry occupations (%)
Most Common Occupations - Construction and extraction occupations (%)
Most Common Occupations - Installation, maintenance, and repair occupations (%)
Most Common Occupations - Production, transportation, and material moving occupations (%)
Most Common Occupations - Production occupations (%)
Most Common Occupations - Transportation occupations (%)
Most Common Occupations - Material moving occupations (%)
People in Group quarters - Institutionalized population (%)
People in Group quarters - Correctional institutions (%)
People in Group quarters - Federal prisons and detention centers (%)
People in Group quarters - Halfway houses (%)
People in Group quarters - Local jails and other confinement facilities (including police lockups) (%)
People in Group quarters - Military disciplinary barracks (%)
People in Group quarters - State prisons (%)
People in Group quarters - Other types of correctional institutions (%)
People in Group quarters - Nursing homes (%)
People in Group quarters - Hospitals/wards, hospices, and schools for the handicapped (%)
People in Group quarters - Hospitals/wards and hospices for chronically ill (%)
People in Group quarters - Hospices or homes for chronically ill (%)
People in Group quarters - Military hospitals or wards for chronically ill (%)
People in Group quarters - Other hospitals or wards for chronically ill (%)
People in Group quarters - Hospitals or wards for drug/alcohol abuse (%)
People in Group quarters - Mental (Psychiatric) hospitals or wards (%)
People in Group quarters - Schools, hospitals, or wards for the mentally retarded (%)
People in Group quarters - Schools, hospitals, or wards for the physically handicapped (%)
People in Group quarters - Institutions for the deaf (%)
People in Group quarters - Institutions for the blind (%)
People in Group quarters - Orthopedic wards and institutions for the physically handicapped (%)
People in Group quarters - Wards in general hospitals for patients who have no usual home elsewhere (%)
People in Group quarters - Wards in military hospitals for patients who have no usual home elsewhere (%)
People in Group quarters - Juvenile institutions (%)
People in Group quarters - Long-term care (%)
People in Group quarters - Homes for abused, dependent, and neglected children (%)
People in Group quarters - Residential treatment centers for emotionally disturbed children (%)
People in Group quarters - Training schools for juvenile delinquents (%)
People in Group quarters - Short-term care, detention or diagnostic centers for delinquent children (%)
People in Group quarters - Type of juvenile institution unknown (%)
People in Group quarters - Noninstitutionalized population (%)
People in Group quarters - College dormitories (includes college quarters off campus) (%)
People in Group quarters - Military quarters (%)
People in Group quarters - On base (%)
People in Group quarters - Barracks, unaccompanied personnel housing (UPH), (Enlisted/Officer), ;and similar group living quarters for military personnel (%)
People in Group quarters - Transient quarters for temporary residents (%)
People in Group quarters - Military ships (%)
People in Group quarters - Group homes (%)
People in Group quarters - Homes or halfway houses for drug/alcohol abuse (%)
People in Group quarters - Homes for the mentally ill (%)
People in Group quarters - Homes for the mentally retarded (%)
People in Group quarters - Homes for the physically handicapped (%)
People in Group quarters - Other group homes (%)
People in Group quarters - Religious group quarters (%)
People in Group quarters - Dormitories (%)
People in Group quarters - Agriculture workers' dormitories on farms (%)
People in Group quarters - Job Corps and vocational training facilities (%)
People in Group quarters - Other workers' dormitories (%)
People in Group quarters - Crews of maritime vessels (%)
People in Group quarters - Other nonhousehold living situations (%)
People in Group quarters - Other noninstitutional group quarters (%)
Residents speaking English at home (%)
Residents speaking English at home - Born in the United States (%)
Residents speaking English at home - Native, born elsewhere (%)
Residents speaking English at home - Foreign born (%)
Residents speaking Spanish at home (%)
Residents speaking Spanish at home - Born in the United States (%)
Residents speaking Spanish at home - Native, born elsewhere (%)
Residents speaking Spanish at home - Foreign born (%)
Residents speaking other language at home (%)
Residents speaking other language at home - Born in the United States (%)
Residents speaking other language at home - Native, born elsewhere (%)
Residents speaking other language at home - Foreign born (%)
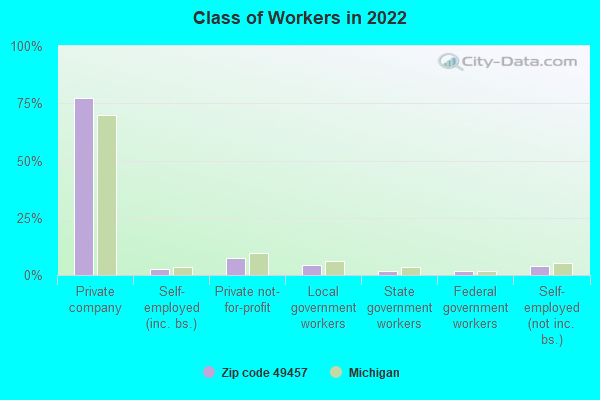
Class of Workers - Employee of private company (%)
Class of Workers - Self-employed in own incorporated business (%)
Class of Workers - Private not-for-profit wage and salary workers (%)
Class of Workers - Local government workers (%)
Class of Workers - State government workers (%)
Class of Workers - Federal government workers (%)
Class of Workers - Self-employed workers in own not incorporated business and Unpaid family workers (%)
House heating fuel used in houses and condos - Utility gas (%)
House heating fuel used in houses and condos - Bottled, tank, or LP gas (%)
House heating fuel used in houses and condos - Electricity (%)
House heating fuel used in houses and condos - Fuel oil, kerosene, etc. (%)
House heating fuel used in houses and condos - Coal or coke (%)
House heating fuel used in houses and condos - Wood (%)
House heating fuel used in houses and condos - Solar energy (%)
House heating fuel used in houses and condos - Other fuel (%)
House heating fuel used in houses and condos - No fuel used (%)
House heating fuel used in apartments - Utility gas (%)
House heating fuel used in apartments - Bottled, tank, or LP gas (%)
House heating fuel used in apartments - Electricity (%)
House heating fuel used in apartments - Fuel oil, kerosene, etc. (%)
House heating fuel used in apartments - Coal or coke (%)
House heating fuel used in apartments - Wood (%)
House heating fuel used in apartments - Solar energy (%)
House heating fuel used in apartments - Other fuel (%)
House heating fuel used in apartments - No fuel used (%)
Armed forces status - In Armed Forces (%)
Armed forces status - Civilian (%)
Armed forces status - Civilian - Veteran (%)
Armed forces status - Civilian - Nonveteran (%)
Fatal accidents locations in years 2005-2021
Fatal accidents locations in 2005
Fatal accidents locations in 2006
Fatal accidents locations in 2007
Fatal accidents locations in 2008
Fatal accidents locations in 2009
Fatal accidents locations in 2010
Fatal accidents locations in 2011
Fatal accidents locations in 2012
Fatal accidents locations in 2013
Fatal accidents locations in 2014
Fatal accidents locations in 2015
Fatal accidents locations in 2016
Fatal accidents locations in 2017
Fatal accidents locations in 2018
Fatal accidents locations in 2019
Fatal accidents locations in 2020
Fatal accidents locations in 2021
Alcohol use - People drinking some alcohol every month (%)
Alcohol use - People not drinking at all (%)
Alcohol use - Average days/month drinking alcohol
Alcohol use - Average drinks/week
Alcohol use - Average days/year people drink much
Audiometry - Average condition of hearing (%)
Audiometry - People that can hear a whisper from across a quiet room (%)
Audiometry - People that can hear normal voice from across a quiet room (%)
Audiometry - Ears ringing, roaring, buzzing (%)
Audiometry - Had a job exposure to loud noise (%)
Audiometry - Had off-work exposure to loud noise (%)
Blood Pressure & Cholesterol - Has high blood pressure (%)
Blood Pressure & Cholesterol - Checking blood pressure at home (%)
Blood Pressure & Cholesterol - Frequently checking blood cholesterol (%)
Blood Pressure & Cholesterol - Has high cholesterol level (%)
Consumer Behavior - Money monthly spent on food at supermarket/grocery store
Consumer Behavior - Money monthly spent on food at other stores
Consumer Behavior - Money monthly spent on eating out
Consumer Behavior - Money monthly spent on carryout/delivered foods
Consumer Behavior - Income spent on food at supermarket/grocery store (%)
Consumer Behavior - Income spent on food at other stores (%)
Consumer Behavior - Income spent on eating out (%)
Consumer Behavior - Income spent on carryout/delivered foods (%)
Current Health Status - General health condition (%)
Current Health Status - Blood donors (%)
Current Health Status - Has blood ever tested for HIV virus (%)
Current Health Status - Left-handed people (%)
Dermatology - People using sunscreen (%)
Diabetes - Diabetics (%)
Diabetes - Had a blood test for high blood sugar (%)
Diabetes - People taking insulin (%)
Diet Behavior & Nutrition - Diet health (%)
Diet Behavior & Nutrition - Milk product consumption (# of products/month)
Diet Behavior & Nutrition - Meals not home prepared (#/week)
Diet Behavior & Nutrition - Meals from fast food or pizza place (#/week)
Diet Behavior & Nutrition - Ready-to-eat foods (#/month)
Diet Behavior & Nutrition - Frozen meals/pizza (#/month)
Drug Use - People that ever used marijuana or hashish (%)
Drug Use - Ever used hard drugs (%)
Drug Use - Ever used any form of cocaine (%)
Drug Use - Ever used heroin (%)
Drug Use - Ever used methamphetamine (%)
Health Insurance - People covered by health insurance (%)
Kidney Conditions-Urology - Avg. # of times urinating at night
Medical Conditions - People with asthma (%)
Medical Conditions - People with anemia (%)
Medical Conditions - People with psoriasis (%)
Medical Conditions - People with overweight (%)
Medical Conditions - Elderly people having difficulties in thinking or remembering (%)
Medical Conditions - People who ever received blood transfusion (%)
Medical Conditions - People having trouble seeing even with glass/contacts (%)
Medical Conditions - People with arthritis (%)
Medical Conditions - People with gout (%)
Medical Conditions - People with congestive heart failure (%)
Medical Conditions - People with coronary heart disease (%)
Medical Conditions - People with angina pectoris (%)
Medical Conditions - People who ever had heart attack (%)
Medical Conditions - People who ever had stroke (%)
Medical Conditions - People with emphysema (%)
Medical Conditions - People with thyroid problem (%)
Medical Conditions - People with chronic bronchitis (%)
Medical Conditions - People with any liver condition (%)
Medical Conditions - People who ever had cancer or malignancy (%)
Mental Health - People who have little interest in doing things (%)
Mental Health - People feeling down, depressed, or hopeless (%)
Mental Health - People who have trouble sleeping or sleeping too much (%)
Mental Health - People feeling tired or having little energy (%)
Mental Health - People with poor appetite or overeating (%)
Mental Health - People feeling bad about themself (%)
Mental Health - People who have trouble concentrating on things (%)
Mental Health - People moving or speaking slowly or too fast (%)
Mental Health - People having thoughts they would be better off dead (%)
Oral Health - Average years since last visit a dentist
Oral Health - People embarrassed because of mouth (%)
Oral Health - People with gum disease (%)
Oral Health - General health of teeth and gums (%)
Oral Health - Average days a week using dental floss/device
Oral Health - Average days a week using mouthwash for dental problem
Oral Health - Average number of teeth
Pesticide Use - Households using pesticides to control insects (%)
Pesticide Use - Households using pesticides to kill weeds (%)
Physical Activity - People doing vigorous-intensity work activities (%)
Physical Activity - People doing moderate-intensity work activities (%)
Physical Activity - People walking or bicycling (%)
Physical Activity - People doing vigorous-intensity recreational activities (%)
Physical Activity - People doing moderate-intensity recreational activities (%)
Physical Activity - Average hours a day doing sedentary activities
Physical Activity - Average hours a day watching TV or videos
Physical Activity - Average hours a day using computer
Physical Functioning - People having limitations keeping them from working (%)
Physical Functioning - People limited in amount of work they can do (%)
Physical Functioning - People that need special equipment to walk (%)
Physical Functioning - People experiencing confusion/memory problems (%)
Physical Functioning - People requiring special healthcare equipment (%)
Prescription Medications - Average number of prescription medicines taking
Preventive Aspirin Use - Adults 40+ taking low-dose aspirin (%)
Reproductive Health - Vaginal deliveries (%)
Reproductive Health - Cesarean deliveries (%)
Reproductive Health - Deliveries resulted in a live birth (%)
Reproductive Health - Pregnancies resulted in a delivery (%)
Reproductive Health - Women breastfeeding newborns (%)
Reproductive Health - Women that had a hysterectomy (%)
Reproductive Health - Women that had both ovaries removed (%)
Reproductive Health - Women that have ever taken birth control pills (%)
Reproductive Health - Women taking birth control pills (%)
Reproductive Health - Women that have ever used Depo-Provera or injectables (%)
Reproductive Health - Women that have ever used female hormones (%)
Sexual Behavior - People 18+ that ever had sex (vaginal, anal, or oral) (%)
Sexual Behavior - Males 18+ that ever had vaginal sex with a woman (%)
Sexual Behavior - Males 18+ that ever performed oral sex on a woman (%)
Sexual Behavior - Males 18+ that ever had anal sex with a woman (%)
Sexual Behavior - Males 18+ that ever had any sex with a man (%)
Sexual Behavior - Females 18+ that ever had vaginal sex with a man (%)
Sexual Behavior - Females 18+ that ever performed oral sex on a man (%)
Sexual Behavior - Females 18+ that ever had anal sex with a man (%)
Sexual Behavior - Females 18+ that ever had any kind of sex with a woman (%)
Sexual Behavior - Average age people first had sex
Sexual Behavior - Average number of female sex partners in lifetime (males 18+)
Sexual Behavior - Average number of female vaginal sex partners in lifetime (males 18+)
Sexual Behavior - Average age people first performed oral sex on a woman (18+)
Sexual Behavior - Average number of woman performed oral sex on in lifetime (18+)
Sexual Behavior - Average number of male sex partners in lifetime (males 18+)
Sexual Behavior - Average number of male anal sex partners in lifetime (males 18+)
Sexual Behavior - Average age people first performed oral sex on a man (18+)
Sexual Behavior - Average number of male oral sex partners in lifetime (18+)
Sexual Behavior - People using protection when performing oral sex (%)
Sexual Behavior - Average number of times people have vaginal or anal sex a year
Sexual Behavior - People having sex without condom (%)
Sexual Behavior - Average number of male sex partners in lifetime (females 18+)
Sexual Behavior - Average number of male vaginal sex partners in lifetime (females 18+)
Sexual Behavior - Average number of female sex partners in lifetime (females 18+)
Sexual Behavior - Circumcised males 18+ (%)
Sleep Disorders - Average hours sleeping at night
Sleep Disorders - People that has trouble sleeping (%)
Smoking-Cigarette Use - People smoking cigarettes (%)
Taste & Smell - People 40+ having problems with smell (%)
Taste & Smell - People 40+ having problems with taste (%)
Taste & Smell - People 40+ that ever had wisdom teeth removed (%)
Taste & Smell - People 40+ that ever had tonsils teeth removed (%)
Taste & Smell - People 40+ that ever had a loss of consciousness because of a head injury (%)
Taste & Smell - People 40+ that ever had a broken nose or other serious injury to face or skull (%)
Taste & Smell - People 40+ that ever had two or more sinus infections (%)
Weight - Average height (inches)
Weight - Average weight (pounds)
Weight - Average BMI
Weight - People that are obese (%)
Weight - People that ever were obese (%)
Weight - People trying to lose weight (%)
Urban population: 1,369
Rural population: 9,722
Estimated median house/condo value in 2022: $194,830
49457:
$194,830Michigan:
$224,400
Median resident age: This zip code:
41.8 yearsMichigan median age:
40.3 years
Average household size: This zip code:
2.6 peopleMichigan:
2.4 people
Averages for the 2020 tax year for zip code 49457, filed in 2021:
Average Adjusted Gross Income (AGI) in 2020: $55,572 (Individual Income Tax Returns) Here:
$55,572State:
$68,945
Salary/wage: $47,384 (reported on 81.3% of returns )Here:
$47,384State:
$57,142
(% of AGI for various income ranges: 988.9% for AGIs below $25k , 3044.2% for AGIs $25k-50k , 5600.8% for AGIs $50k-75k , 9254.6% for AGIs $75k-100k , 15615.6% for AGIs $100k-200k , 40416.7% for AGIs over 200k ) Taxable interest for individuals: $882 (reported on 25.7% of returns )This zip code:
$882Michigan:
$1,630
(% of AGI for various income ranges: 10.2% for AGIs below $25k , 12.9% for AGIs $25k-50k , 19.0% for AGIs $50k-75k , 34.6% for AGIs $75k-100k , 45.6% for AGIs $100k-200k , 1480.0% for AGIs over 200k ) Ordinary dividends: $4,532 (reported on 11.5% of returns )(% of AGI for various income ranges: 16.9% for AGIs below $25k , 32.4% for AGIs $25k-50k , 37.6% for AGIs $50k-75k , 59.3% for AGIs $75k-100k , 84.9% for AGIs $100k-200k , 4233.3% for AGIs over 200k ) Net capital gain/loss in AGI: +$7,780 (reported on 11.5% of returns )Here:
+$7,780State:
+$20,064
(% of AGI for various income ranges: 14.3% for AGIs below $25k , 20.4% for AGIs $25k-50k , 68.4% for AGIs $50k-75k , 74.9% for AGIs $75k-100k , 256.0% for AGIs $100k-200k , 7853.3% for AGIs over 200k ) Profit/loss from business: +$8,205 (reported on 12.5% of returns )Here:
+$8,205State:
+$11,172
(% of AGI for various income ranges: 94.1% for AGIs below $25k , 96.8% for AGIs $25k-50k , 153.2% for AGIs $50k-75k , 157.8% for AGIs $75k-100k , 254.2% for AGIs $100k-200k , 1233.3% for AGIs over 200k ) Taxable individual retirement arrangement distribution: $17,798 (reported on 10.1% of returns )49457:
$17,798Michigan:
$19,803
(% of AGI for various income ranges: 90.8% for AGIs below $25k , 128.1% for AGIs $25k-50k , 245.4% for AGIs $50k-75k , 413.7% for AGIs $75k-100k , 819.8% for AGIs $100k-200k ) Total itemized deductions: $33,321 (reported on 2.7% of returns )Here:
$33,321State:
$34,117
(% of AGI for various income ranges: 71.2% for AGIs $25k-50k , 164.6% for AGIs $50k-75k , 310.9% for AGIs $100k-200k , 4976.7% for AGIs over 200k ) Charity contributions: $10,944 (reported on 1.8% of returns )Here:
$10,944State:
$13,548
(% of AGI for various income ranges: 39.2% for AGIs $50k-75k , 80.2% for AGIs $100k-200k , 1310.0% for AGIs over 200k ) Taxes paid: $7,179 (reported on 2.7% of returns )(% of AGI for various income ranges: 12.4% for AGIs $25k-50k , 37.0% for AGIs $50k-75k , 89.3% for AGIs $100k-200k , 830.0% for AGIs over 200k ) Earned income credit: $2,161 (reported on 15.4% of returns )(% of AGI for various income ranges: 80.0% for AGIs below $25k , 69.6% for AGIs $25k-50k ) Percentage of individuals using paid preparers for their 2020 taxes: 94.4%(% for various income ranges: 92.3% for AGIs below $25k , 94.7% for AGIs $25k-50k , 96.2% for AGIs $50k-75k , 94.8% for AGIs $75k-100k , 95.5% for AGIs $100k-200k , 100.0% for AGIs over 200k )
Averages for the 2012 tax year for zip code 49457, filed in 2013:
Average Adjusted Gross Income (AGI) in 2012: $44,130 (Individual Income Tax Returns) Here:
$44,130State:
$55,609
Salary/wage: $40,109 (reported on 84.7% of returns )Here:
$40,109State:
$46,782
(% of AGI for various income ranges: 70.4% for AGIs below $25k , 81.3% for AGIs $25k-50k , 82.1% for AGIs $50k-75k , 80.8% for AGIs $75k-100k , 79.1% for AGIs $100k-200k , 43.9% for AGIs over 200k ) Taxable interest for individuals: $714 (reported on 28.0% of returns )This zip code:
$714Michigan:
$1,491
(% of AGI for various income ranges: 1.1% for AGIs below $25k , 0.4% for AGIs $25k-50k , 0.4% for AGIs $50k-75k , 0.3% for AGIs $75k-100k , 0.4% for AGIs $100k-200k , 0.3% for AGIs over 200k ) Ordinary dividends: $3,369 (reported on 13.1% of returns )(% of AGI for various income ranges: 1.2% for AGIs below $25k , 0.4% for AGIs $25k-50k , 0.5% for AGIs $50k-75k , 0.5% for AGIs $75k-100k , 2.8% for AGIs $100k-200k ) Net capital gain/loss in AGI: +$2,891 (reported on 10.1% of returns )Here:
+$2,891State:
+$9,326
(% of AGI for various income ranges: 0.1% for AGIs $50k-75k , 0.3% for AGIs $75k-100k , 2.9% for AGIs $100k-200k ) Profit/loss from business: +$6,592 (reported on 13.5% of returns )Here:
+$6,592State:
+$11,523
(% of AGI for various income ranges: 6.1% for AGIs below $25k , 1.8% for AGIs $25k-50k , 1.3% for AGIs $50k-75k , 1.3% for AGIs $75k-100k , 2.2% for AGIs $100k-200k ) Taxable individual retirement arrangement distribution: $13,702 (reported on 9.5% of returns )49457:
$13,702Michigan:
$15,298
(% of AGI for various income ranges: 3.9% for AGIs below $25k , 2.8% for AGIs $25k-50k , 2.4% for AGIs $50k-75k , 3.5% for AGIs $75k-100k , 3.6% for AGIs $100k-200k ) Total itemized deductions: $16,497 (21% of AGI, reported on 26.7% of returns )Here:
$16,497State:
$21,628
Here:
20.5% of AGIState:
18.4% of AGI
(% of AGI for various income ranges: 7.2% for AGIs below $25k , 8.4% for AGIs $25k-50k , 10.3% for AGIs $50k-75k , 10.3% for AGIs $75k-100k , 12.6% for AGIs $100k-200k , 8.7% for AGIs over 200k ) Charity contributions: $2,874 (reported on 20.9% of returns )(% of AGI for various income ranges: 0.5% for AGIs below $25k , 0.9% for AGIs $25k-50k , 1.2% for AGIs $50k-75k , 1.4% for AGIs $75k-100k , 2.3% for AGIs $100k-200k , 1.5% for AGIs over 200k ) Taxes paid: $5,835 (reported on 26.7% of returns )(% of AGI for various income ranges: 1.5% for AGIs below $25k , 2.4% for AGIs $25k-50k , 3.2% for AGIs $50k-75k , 3.8% for AGIs $75k-100k , 5.1% for AGIs $100k-200k , 5.5% for AGIs over 200k ) Earned income credit: $2,252 (reported on 21.5% of returns )(% of AGI for various income ranges: 7.2% for AGIs below $25k , 1.5% for AGIs $25k-50k ) Percentage of individuals using paid preparers for their 2012 taxes: 53.5%(% for various income ranges: 47.5% for AGIs below $25k , 55.9% for AGIs $25k-50k , 56.8% for AGIs $50k-75k , 61.4% for AGIs $75k-100k , 62.9% for AGIs $100k-200k , 66.7% for AGIs over 200k )
Averages for the 2004 tax year for zip code 49457, filed in 2005:
Average Adjusted Gross Income (AGI) in 2004: $38,324 (Individual Income Tax Returns) Here:
$38,324State:
$48,204
Salary/wage: $36,370 (reported on 89.4% of returns )Here:
$36,370State:
$42,791
(% of AGI for various income ranges: 91.9% for AGIs below $10k , 77.4% for AGIs $10k-25k , 86.4% for AGIs $25k-50k , 90.1% for AGIs $50k-75k , 87.9% for AGIs $75k-100k , 74.0% for AGIs over 100k ) Taxable interest for individuals: $806 (reported on 37.3% of returns )This zip code:
$806Michigan:
$1,725
(% of AGI for various income ranges: 3.0% for AGIs below $10k , 1.3% for AGIs $10k-25k , 0.5% for AGIs $25k-50k , 0.6% for AGIs $50k-75k , 0.6% for AGIs $75k-100k , 1.1% for AGIs over 100k ) Taxable dividends: $1,251 (reported on 15.9% of returns )(% of AGI for various income ranges: 1.1% for AGIs below $10k , 0.7% for AGIs $10k-25k , 0.5% for AGIs $25k-50k , 0.4% for AGIs $50k-75k , 0.4% for AGIs $75k-100k , 0.7% for AGIs over 100k ) Net capital gain/loss: +$6,047 (reported on 12.1% of returns )Here:
+$6,047State:
+$8,532
(% of AGI for various income ranges: -1.1% for AGIs below $10k , 0.3% for AGIs $10k-25k , 0.6% for AGIs $25k-50k , 0.8% for AGIs $50k-75k , 0.9% for AGIs $75k-100k , 8.4% for AGIs over 100k ) Profit/loss from business: +$4,598 (reported on 13.2% of returns )Here:
+$4,598State:
+$9,547
(% of AGI for various income ranges: -3.2% for AGIs below $10k , 4.3% for AGIs $10k-25k , 1.7% for AGIs $25k-50k , 0.1% for AGIs $50k-75k , 1.1% for AGIs $75k-100k , 3.5% for AGIs over 100k ) IRA payment deduction: $2,616 (reported on 2.2% of returns )49457:
$2,616Michigan:
$2,875
(% of AGI for various income ranges: 0.1% for AGIs $10k-25k , 0.2% for AGIs $25k-50k , 0.2% for AGIs $50k-75k , 0.2% for AGIs $75k-100k ) Total itemized deductions: $14,208 (22% of AGI, reported on 33.1% of returns )Here:
$14,208State:
$18,509
Here:
22.0% of AGIState:
20.7% of AGI
(% of AGI for various income ranges: 8.0% for AGIs below $10k , 7.6% for AGIs $10k-25k , 12.2% for AGIs $25k-50k , 12.8% for AGIs $50k-75k , 14.2% for AGIs $75k-100k , 12.8% for AGIs over 100k ) Charity contributions deductions: $2,114 (3% of AGI, reported on 27.4% of returns )Here:
3.1% of AGIState:
3.6% of AGI
(% of AGI for various income ranges: 0.4% for AGIs below $10k , 0.7% for AGIs $10k-25k , 1.2% for AGIs $25k-50k , 1.4% for AGIs $50k-75k , 1.9% for AGIs $75k-100k , 2.5% for AGIs over 100k ) Total tax: $4,595 (reported on 71.6% of returns )(% of AGI for various income ranges: 2.3% for AGIs below $10k , 3.6% for AGIs $10k-25k , 6.1% for AGIs $25k-50k , 7.7% for AGIs $50k-75k , 9.9% for AGIs $75k-100k , 16.3% for AGIs over 100k ) Earned income credit: $1,660 (reported on 17.9% of returns )Percentage of individuals using paid preparers for their 2004 taxes: 56.9%(% for various income ranges: 48.0% for AGIs below $10k , 57.3% for AGIs $10k-25k , 60.6% for AGIs $25k-50k , 55.9% for AGIs $50k-75k , 64.9% for AGIs $75k-100k , 64.9% for AGIs over 100k )
Estimated median household income in 2022: This zip code:
$70,060Michigan:
$66,986
Nearest zip codes: 49425 ,
49442 ,
49440 ,
49445 ,
49461 ,
49444 .
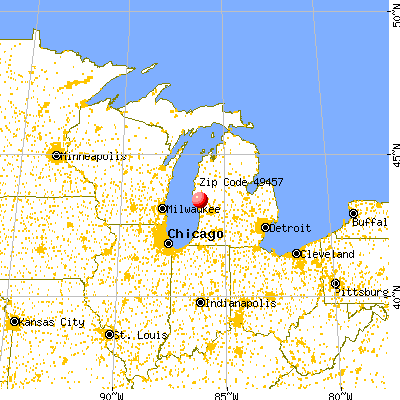
Lakewood Club Zip Code Map
Percentage of family households: This zip code:
54.6%Michigan:
43.3%
Percentage of households with unmarried partners: This zip code:
7.0%Michigan:
45.7%
Likely homosexual households (counted as self-reported same-sex unmarried-partner households)
Lesbian couples: 0.0% of all households Gay men: 0.0% of all households
Household received Food Stamps/SNAP in the past 12 months: 581Household did not receive Food Stamps/SNAP in the past 12 months: 3,719
Women who had a birth in the past 12 months: 97 (91 now married , 8 unmarried) Women who did not have a birth in the past 12 months: 2,251 (1,081 now married , 1,165 unmarried)
Housing units in zip code 49457 with a mortgage: 2,418 (169
second mortgage , 4
home equity loan , 146
both second mortgage and home equity loan )
Houses without a mortgage: 75
Median monthly owner costs for units with a mortgage: $1,233
Median monthly owner costs for units without a mortgage: $520
Residents with income below the poverty level in 2022:
This zip code:
12.2%Whole state:
13.4%
Residents with income below 50% of the poverty level in 2022:
This zip code:
5.9%Whole state:
6.9%
Median number of rooms in houses and condos: Median number of rooms in apartments: Notable locations in this zip code not listed on our city pages
Click to draw/clear zip code borders Notable locations in zip code 49457: (A) , Camp Pinewood (B) , Camp Lor-Ray (C) , Camp Tocanja (D) , Camp Hardy (E) , Stonegate Golf Club (F) , Twin Lake Station (G) , Johnson Campground (H) , Blue Lake Township Fire Department Station 2 (I) , Blue Lake Township Fire Department (J) , Michigan Department of Natural Resources Muskegon Field Office (K) , Dalton Township Public Library (L) . Display/hide their locations on the map
Churches in zip code 49457 include: (A) , Cedar Creek Church (B) , Emmanuel Congregational Church (C) , Cedar Creek Evangelical Church (D) , Twin Lake United Methodist Church (E) , Saint Mary's of the Woods Parish (F) . Display/hide their locations on the map
Cemeteries: (1) , Johnson Cemetery (2) , Twin Lake Cemetery (3) , Saint Anthonys Cemetery (4) , Blue Lake Cemetery (5) . Display/hide their locations on the map
Lakes and swamps: (A) , Burns Lake (B) , Clear Lake (C) , Cleveland Lake (D) , West Lake (E) , Crocker Lake (F) , Duck Lake (G) , Echo Lake (H) . Display/hide their locations on the map
Rivers and creeks: (A) , Sweeter Creek (B) , Cow Creek (C) , Cedar Creek (D) , Maple River (E) . Display/hide their locations on the map
Parks in zip code 49457 include: (1) , Browns Field Park (2) , Twin Lakes Park (3) . Display/hide their locations on the map
Year house built (houses)
10 2020 or later176 2010 to 20191,175 2000 to 20091,205 1990 to 1999557 1980 to 1989540 1970 to 1979117 1960 to 1969408 1950 to 1959229 1940 to 1949483 1939 or earlier
Zip code 49457 household income distribution in 2022 177 Less than $10,000104 $10,000 to $14,999140 $15,000 to $19,99989 $20,000 to $24,999157 $25,000 to $29,999195 $30,000 to $34,999190 $35,000 to $39,999224 $40,000 to $44,99996 $45,000 to $49,999284 $50,000 to $59,999693 $60,000 to $74,999524 $75,000 to $99,999478 $100,000 to $124,999420 $125,000 to $149,999339 $150,000 to $199,999199 $200,000 or moreEstimate of home value of owner-occupied houses/condos in 2022 in zip code 49457 114 Less than $10,00014 $10,000 to $14,99981 $15,000 to $19,99957 $20,000 to $24,9992 $25,000 to $29,99941 $30,000 to $34,9994 $35,000 to $39,99928 $40,000 to $49,99978 $50,000 to $59,999110 $60,000 to $69,99938 $70,000 to $79,999160 $80,000 to $89,99932 $90,000 to $99,999227 $100,000 to $124,999358 $125,000 to $149,999427 $150,000 to $174,999466 $175,000 to $199,999437 $200,000 to $249,999301 $250,000 to $299,999461 $300,000 to $399,999202 $400,000 to $499,999144 $500,000 to $749,99958 $750,000 to $999,9996 $1,000,000 to $1,499,999Rent paid by renters in 2022 in zip code 49457 4 $100 to $14921 $150 to $1999 $350 to $3996 $450 to $49933 $500 to $54927 $550 to $59918 $600 to $64918 $650 to $69929 $700 to $74952 $900 to $99928 $1,250 to $1,49976 No cash rent
Median gross rent in 2022: $926.
Median price asked for vacant for-sale houses and condos in 2022: $239,657.
Estimated median house (or condo) value in 2022 for: White Non-Hispanic householders: $213,048Black or African American householders: $211,762American Indian or Alaska Native householders: $124,956Some other race householders: $183,898Two or more races householders: $124,528Hispanic or Latino householders: $188,399Estimated median house or condo value in 2022: $194,830
49457:
$194,830Michigan:
$224,400
Lower value quartile - upper value quartile: $128,483 - $279,227
Mean price in 2022: Detached houses: $234,447Here:
$234,447State:
$280,038
Townhouses or other attached units: $726,593Here:
$726,593State:
$239,520
Mobile homes: $45,098Here:
$45,098State:
$72,868
Housing units in structures:
One, detached: 4,157One, attached: 62Two: 103 or 4: 29Mobile homes: 679Unemployment : 6.6%
Means of transportation to work in zip code 49457 78.8% 4,250 Drove a car alone10.1% 542 Carpooled0.0% 2 Bus or trolley bus0.2% 13 Bicycle0.2% 11 Walked0.1% 3 Other means9.2% 496 Worked at homeTravel time to work (commute) in zip code 49457 74 Less than 5 minutes221 5 to 9 minutes402 10 to 14 minutes850 15 to 19 minutes1,285 20 to 24 minutes461 25 to 29 minutes843 30 to 34 minutes130 35 to 39 minutes97 40 to 44 minutes144 45 to 59 minutes239 60 to 89 minutes76 90 or more minutes
Percentage of zip code residents living and working in this county: 81.6%
Household type by relationship:
Households: 11,092
Male householders: 2,274 (418 living alone ), Female householders: 2,022 (349 living alone )2,490 spouses (2,490 opposite-sex spouses ), 485 unmarried partners , (464 opposite-sex unmarried partners ), 3,039 children (2,867 natural , 28 adopted , 145 stepchildren ), 242 grandchildren , 81 brothers or sisters , 89 parents , 0 foster children , 180 other relatives , 156 non-relatives In group quarters: 47 (-1 institutionalized population )
Size of family households: 1,575 2-persons , 703 3-persons , 541 4-persons , 262 5-persons , 128 6-persons , 17 7-or-more-persons
Size of nonfamily households: 766 1-person , 281 2-persons , 3 3-persons , 8 4-persons
1,528 married couples with children. single-parent households (141 men , 403 women ).
97.9% of residents of 49457 zip code speak English at home. of residents speak Spanish at home (71% very well, 2% well, 27% not well ).of residents speak other Indo-European language at home (43% very well, 57% well ).
Foreign born population: 224 (2.0%)
(55.5%
of them are naturalized citizens )
This zip code:
2.0%Whole state:
6.9%
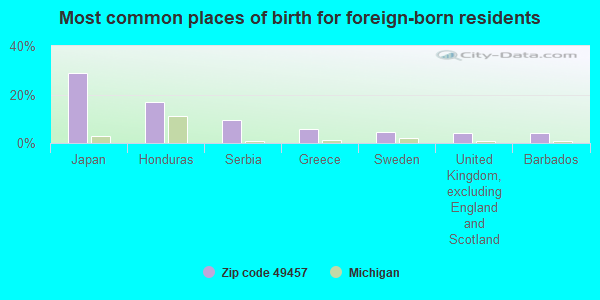
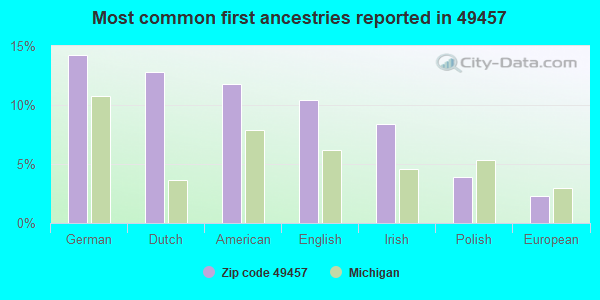
29% Japan 17% Honduras 9% Serbia 6% Greece 4% Sweden 4% United Kingdom, excluding England and Scotland 4% Barbados 14% German 13% Dutch 12% American 10% English 8% Irish 4% Polish 2% European
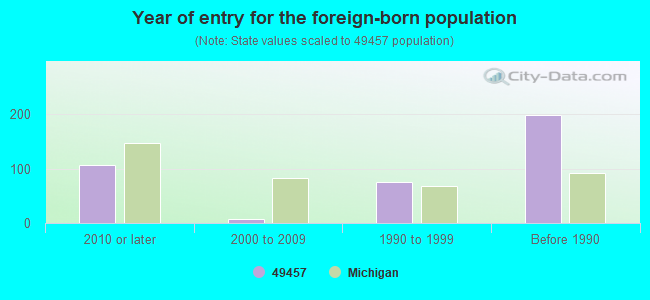
Year of entry for the foreign-born population
107 2010 or later 8 2000 to 2009 75 1990 to 1999 199 Before 1990
Facilities with environmental interests located in this zip code:
MAPLE ISLAND GROCERY SERVICE STATION (3456 MAPLE ISLAND RD in TWIN LAKE, MI)
(Resource Conservation and Recovery Act (tracking hazardous waste))
MAPLE ISLAND GROCERY (3465 MAPLE ISLAND RD in TWIN LAKE, MI)
(Resource Conservation and Recovery Act (tracking hazardous waste))
DALE & SONS TOWING (3350 EWING in TWIN LAKE, MI)
(Resource Conservation and Recovery Act (tracking hazardous waste))
MARKS AUTO REPAIR (4836 HOLTON RD in TWIN LAKE, MI)
Conditionally Exempt Small Quantity Generators, less than 100 kg/month of hazardous waste (Resource Conservation and Recovery Act (tracking hazardous waste)) Business NAICS classification: GENERAL AUTOMOTIVE REPAIR.Organizations: MARK ZIELINSKI (CONTACT/OPERATOR)
Housing units lacking complete plumbing facilities: 1.3%
Housing units lacking complete kitchen facilities: 0.8%
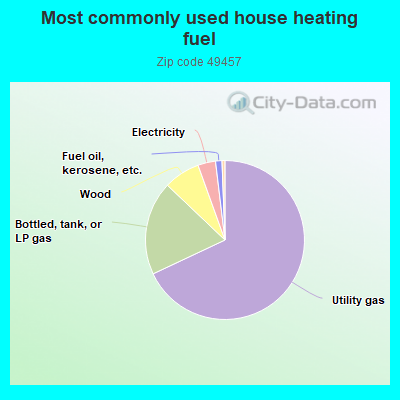
68.0% Utility gas 19.1% Bottled, tank, or LP gas 7.4% Wood 3.6% Electricity 1.3% Fuel oil, kerosene, etc.
Population in 1990: 7,212. Population change in the 1990s: +2,375 (+32.9%).
Place of birth for U.S.-born residents:
This state: 9,736Northeast: 139Midwest: 371South: 127West: 309
59% of the 49457 zip code residents lived in the same house 5 years ago.
Out of people who lived in different houses, 74% lived in this county.
Out of people who lived in different counties, 50% lived in Michigan.
93% of the 49457 zip code residents lived in the same house 1 year ago.
Out of people who lived in different houses, 42% moved from this county.
Out of people who lived in different houses, 56% moved from different county within same state.
Out of people who lived in different houses, 1% moved from different state.
Private vs. public school enrollment:
Students in private schools in grades 1 to 8 (elementary and middle school): 167
Students in private schools in grades 9 to 12 (high school): 6
Students in private undergraduate colleges: 31
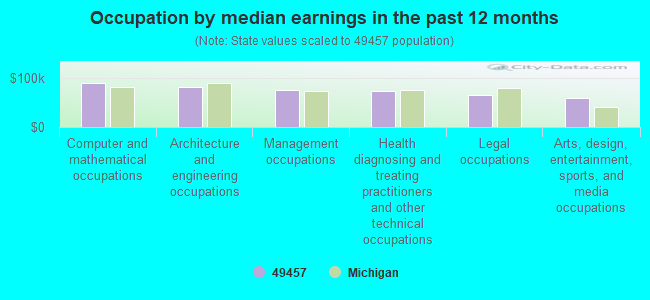
Occupation by median earnings in the past 12 months ($)
89,035 Computer and mathematical occupations 82,635 Architecture and engineering occupations 75,266 Management occupations 73,289 Health diagnosing and treating practitioners and other technical occupations 64,853 Legal occupations 58,473 Arts, design, entertainment, sports, and media occupations
Top industries in this zip code by the number of employees in 2005:
Accommodation and Food Services: Recreational and Vacation Camps (except Campgrounds) (20-49 employees: 1 establishment, 10-19 employees: 1 establishment, 1-4 employees: 2 establishments)Accommodation and Food Services: Full-Service Restaurants (10-19: 2, 5-9: 1)Construction: Electrical Contractors (10-19: 1, 1-4: 4)Construction: New Single-Family Housing Construction (except Operative Builders) (5-9: 1, 1-4: 7)Construction: Plumbing, Heating, and Air-Conditioning Contractors (5-9: 2, 1-4: 2)Health Care and Social Assistance: Child Day Care Services (10-19: 1, 1-4: 1)Health Care and Social Assistance: Services for the Elderly and Persons with Disabilities (10-19: 1)Construction: Other Building Finishing Contractors (10-19: 1)
People in group quarters in 2010:
31 people in group homes intended for adults
12 people in workers' group living quarters and job corps centers
People in group quarters in 2000:
22 people in nursing homes
6 people in homes for the mentally retarded
3 people in other group homes
Fatal accident statistics in 2014:
Fatal accident count: 2Vehicles involved in fatal accidents: 3Fatal accidents caused by drunken drivers: 0Fatalities: 2Persons involved in fatal accidents: 6Pedestrians involved in fatal accidents: 0
Fatal accident statistics in 2013:
Fatal accident count: 1Vehicles involved in fatal accidents: 2Fatal accidents caused by drunken drivers: 1Fatalities: 1Persons involved in fatal accidents: 4Pedestrians involved in fatal accidents: 0
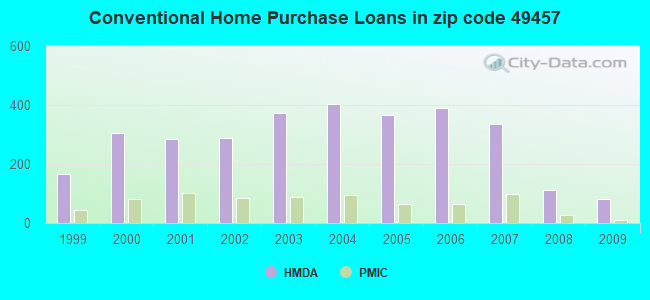
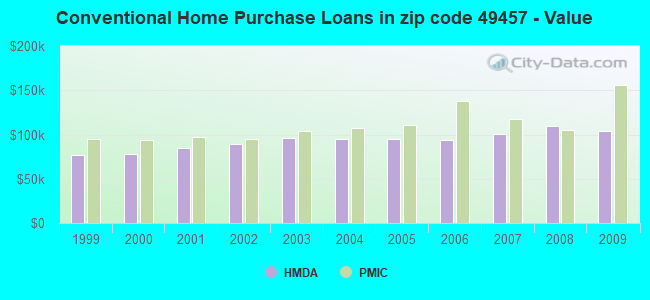
Home Mortgage Disclosure Act Aggregated Statistics For Year 2009(Based on 12 partial tracts) A) FHA, FSA/RHS & VA B) Conventional C) Refinancings D) Home Improvement Loans F) Non-occupant Loans on G) Loans On Manufactured Number Average Value Number Average Value Number Average Value Number Average Value Number Average Value Number Average Value
LOANS ORIGINATED 102 $93,906 83 $103,990 488 $121,316 22 $45,343 46 $91,294 34 $55,601 APPLICATIONS APPROVED, NOT ACCEPTED 11 $61,816 5 $139,408 65 $108,386 7 $86,079 3 $74,783 8 $69,859 APPLICATIONS DENIED 36 $90,801 25 $118,648 234 $125,548 29 $23,945 11 $86,846 26 $69,967 APPLICATIONS WITHDRAWN 10 $78,555 7 $80,679 103 $134,664 4 $11,795 1 $76,380 5 $58,698 FILES CLOSED FOR INCOMPLETENESS 4 $71,750 0 $0 42 $118,530 2 $13,145 0 $0 2 $101,965
Aggregated Statistics For Year 2008(Based on 12 partial tracts) A) FHA, FSA/RHS & VA B) Conventional C) Refinancings D) Home Improvement Loans F) Non-occupant Loans on G) Loans On Manufactured Number Average Value Number Average Value Number Average Value Number Average Value Number Average Value Number Average Value
LOANS ORIGINATED 102 $98,564 111 $109,720 378 $105,361 27 $41,288 45 $83,265 47 $60,190 APPLICATIONS APPROVED, NOT ACCEPTED 8 $88,548 10 $125,391 71 $128,252 7 $50,477 4 $50,572 8 $71,722 APPLICATIONS DENIED 37 $101,135 37 $114,019 265 $123,777 46 $49,840 7 $93,387 30 $67,291 APPLICATIONS WITHDRAWN 21 $81,131 12 $120,038 90 $119,389 7 $42,940 5 $106,702 10 $62,931 FILES CLOSED FOR INCOMPLETENESS 0 $0 5 $61,770 29 $132,503 1 $30,820 0 $0 0 $0
Aggregated Statistics For Year 2007(Based on 12 partial tracts) A) FHA, FSA/RHS & VA B) Conventional C) Refinancings D) Home Improvement Loans F) Non-occupant Loans on G) Loans On Manufactured Number Average Value Number Average Value Number Average Value Number Average Value Number Average Value Number Average Value
LOANS ORIGINATED 64 $100,535 334 $100,400 461 $94,755 74 $51,744 66 $135,841 66 $60,664 APPLICATIONS APPROVED, NOT ACCEPTED 4 $62,490 28 $82,289 146 $103,699 11 $48,206 14 $83,234 18 $62,847 APPLICATIONS DENIED 29 $89,003 102 $77,281 513 $106,522 124 $52,665 25 $94,305 79 $60,149 APPLICATIONS WITHDRAWN 10 $96,799 23 $99,638 213 $107,385 6 $67,600 8 $74,744 7 $74,284 FILES CLOSED FOR INCOMPLETENESS 2 $114,980 10 $102,116 30 $105,791 0 $0 1 $64,740 1 $76,630
Aggregated Statistics For Year 2006(Based on 12 partial tracts) A) FHA, FSA/RHS & VA B) Conventional C) Refinancings D) Home Improvement Loans F) Non-occupant Loans on G) Loans On Manufactured Number Average Value Number Average Value Number Average Value Number Average Value Number Average Value Number Average Value
LOANS ORIGINATED 52 $94,703 390 $93,618 560 $92,059 98 $39,682 59 $107,203 75 $63,139 APPLICATIONS APPROVED, NOT ACCEPTED 4 $90,160 49 $89,959 111 $94,514 12 $45,915 4 $248,592 6 $45,297 APPLICATIONS DENIED 18 $89,088 107 $79,487 517 $102,394 67 $46,094 17 $95,579 81 $59,565 APPLICATIONS WITHDRAWN 9 $67,103 37 $98,158 268 $111,448 22 $59,635 7 $93,166 14 $59,204 FILES CLOSED FOR INCOMPLETENESS 5 $86,590 12 $97,956 103 $121,244 2 $92,320 3 $89,077 2 $97,200
Aggregated Statistics For Year 2005(Based on 12 partial tracts) A) FHA, FSA/RHS & VA B) Conventional C) Refinancings D) Home Improvement Loans F) Non-occupant Loans on G) Loans On Manufactured Number Average Value Number Average Value Number Average Value Number Average Value Number Average Value Number Average Value
LOANS ORIGINATED 51 $100,675 365 $95,480 700 $98,038 97 $45,890 63 $111,150 98 $64,934 APPLICATIONS APPROVED, NOT ACCEPTED 5 $130,826 54 $72,806 104 $95,199 13 $31,105 1 $86,600 21 $66,390 APPLICATIONS DENIED 21 $91,238 110 $73,308 573 $98,021 103 $31,189 18 $70,032 99 $64,055 APPLICATIONS WITHDRAWN 12 $85,742 36 $85,505 330 $112,736 16 $78,169 6 $99,482 17 $73,683 FILES CLOSED FOR INCOMPLETENESS 4 $67,038 11 $73,323 119 $110,072 5 $56,670 2 $43,815 3 $86,897
Aggregated Statistics For Year 2004(Based on 12 partial tracts) A) FHA, FSA/RHS & VA B) Conventional C) Refinancings D) Home Improvement Loans F) Non-occupant Loans on G) Loans On Manufactured Number Average Value Number Average Value Number Average Value Number Average Value Number Average Value Number Average Value
LOANS ORIGINATED 84 $92,441 403 $94,456 790 $96,297 111 $48,264 62 $91,210 106 $72,574 APPLICATIONS APPROVED, NOT ACCEPTED 2 $125,845 60 $87,509 190 $91,192 7 $30,853 16 $84,049 27 $56,217 APPLICATIONS DENIED 29 $94,206 147 $75,464 490 $95,720 106 $34,864 29 $81,047 106 $57,428 APPLICATIONS WITHDRAWN 6 $125,453 29 $87,227 259 $102,043 15 $48,779 6 $80,330 20 $74,004 FILES CLOSED FOR INCOMPLETENESS 5 $68,300 16 $87,618 107 $107,841 8 $48,779 0 $0 9 $78,454
Aggregated Statistics For Year 2003(Based on 12 partial tracts) A) FHA, FSA/RHS & VA B) Conventional C) Refinancings D) Home Improvement Loans F) Non-occupant Loans on Number Average Value Number Average Value Number Average Value Number Average Value Number Average Value
LOANS ORIGINATED 64 $97,215 372 $95,540 1,475 $95,269 111 $30,727 80 $77,398 APPLICATIONS APPROVED, NOT ACCEPTED 2 $94,960 43 $94,364 236 $97,039 11 $22,208 10 $97,837 APPLICATIONS DENIED 22 $88,970 92 $71,102 543 $85,870 66 $31,633 11 $71,989 APPLICATIONS WITHDRAWN 9 $93,763 29 $85,745 268 $100,796 12 $36,751 9 $74,524 FILES CLOSED FOR INCOMPLETENESS 7 $78,821 14 $80,534 72 $102,391 0 $0 1 $117,610
Aggregated Statistics For Year 2002(Based on 12 partial tracts) A) FHA, FSA/RHS & VA B) Conventional C) Refinancings D) Home Improvement Loans F) Non-occupant Loans on Number Average Value Number Average Value Number Average Value Number Average Value Number Average Value
LOANS ORIGINATED 61 $94,173 287 $89,465 1,150 $92,761 111 $26,035 61 $83,398 APPLICATIONS APPROVED, NOT ACCEPTED 3 $85,137 36 $74,025 188 $88,764 17 $32,126 11 $56,005 APPLICATIONS DENIED 13 $89,178 101 $54,626 445 $83,526 68 $17,150 10 $43,638 APPLICATIONS WITHDRAWN 9 $91,639 31 $78,031 200 $87,349 7 $36,250 6 $68,528 FILES CLOSED FOR INCOMPLETENESS 2 $77,995 9 $90,527 65 $105,921 0 $0 3 $75,160
Aggregated Statistics For Year 2001(Based on 12 partial tracts) A) FHA, FSA/RHS & VA B) Conventional C) Refinancings D) Home Improvement Loans F) Non-occupant Loans on Number Average Value Number Average Value Number Average Value Number Average Value Number Average Value
LOANS ORIGINATED 52 $89,331 286 $84,981 973 $84,808 150 $28,571 43 $81,742 APPLICATIONS APPROVED, NOT ACCEPTED 4 $118,582 53 $57,037 132 $72,358 45 $17,515 5 $59,938 APPLICATIONS DENIED 14 $83,016 136 $44,938 443 $67,782 119 $15,454 16 $53,698 APPLICATIONS WITHDRAWN 4 $85,525 19 $84,383 192 $79,939 17 $20,978 3 $69,837 FILES CLOSED FOR INCOMPLETENESS 1 $83,090 10 $86,052 52 $86,301 3 $44,500 1 $41,480
Aggregated Statistics For Year 2000(Based on 12 partial tracts) A) FHA, FSA/RHS & VA B) Conventional C) Refinancings D) Home Improvement Loans F) Non-occupant Loans on Number Average Value Number Average Value Number Average Value Number Average Value Number Average Value
LOANS ORIGINATED 69 $75,881 304 $77,477 401 $66,949 157 $25,404 33 $59,265 APPLICATIONS APPROVED, NOT ACCEPTED 2 $80,830 63 $58,180 133 $64,875 46 $24,212 13 $46,618 APPLICATIONS DENIED 21 $81,169 273 $43,319 344 $61,807 113 $17,550 17 $57,585 APPLICATIONS WITHDRAWN 12 $73,768 28 $63,117 124 $64,422 15 $39,568 2 $43,325 FILES CLOSED FOR INCOMPLETENESS 2 $77,410 10 $63,132 32 $73,864 0 $0 2 $27,165
Aggregated Statistics For Year 1999(Based on 6 partial tracts) A) FHA, FSA/RHS & VA B) Conventional C) Refinancings D) Home Improvement Loans F) Non-occupant Loans on Number Average Value Number Average Value Number Average Value Number Average Value Number Average Value
LOANS ORIGINATED 36 $76,984 167 $76,592 297 $67,631 65 $25,522 16 $54,608 APPLICATIONS APPROVED, NOT ACCEPTED 5 $71,368 50 $56,905 57 $60,630 17 $16,716 10 $64,964 APPLICATIONS DENIED 7 $54,713 167 $49,465 131 $60,336 43 $14,760 16 $67,638 APPLICATIONS WITHDRAWN 3 $60,927 16 $71,766 80 $59,481 10 $40,106 2 $23,585 FILES CLOSED FOR INCOMPLETENESS 0 $0 6 $54,633 24 $69,623 0 $0 0 $0
Private Mortgage Insurance Companies Aggregated Statistics For Year 2009(Based on 12 partial tracts) A) Conventional B) Refinancings C) Non-occupant Loans on D) Loans On Manufactured Number Average Value Number Average Value Number Average Value Number Average Value
LOANS ORIGINATED 9 $156,231 6 $149,033 2 $205,055 0 $0 APPLICATIONS APPROVED, NOT ACCEPTED 6 $128,190 4 $203,428 0 $0 1 $27,790 APPLICATIONS DENIED 5 $110,722 11 $277,783 1 $116,320 0 $0 APPLICATIONS WITHDRAWN 0 $0 1 $63,230 0 $0 0 $0 FILES CLOSED FOR INCOMPLETENESS 0 $0 0 $0 0 $0 0 $0
Aggregated Statistics For Year 2008(Based on 12 partial tracts) A) Conventional B) Refinancings C) Non-occupant Loans on D) Loans On Manufactured Number Average Value Number Average Value Number Average Value Number Average Value
LOANS ORIGINATED 28 $105,131 41 $165,530 4 $90,360 2 $26,290 APPLICATIONS APPROVED, NOT ACCEPTED 22 $95,453 31 $184,813 4 $74,538 5 $72,908 APPLICATIONS DENIED 1 $40,740 8 $130,640 2 $85,000 0 $0 APPLICATIONS WITHDRAWN 3 $84,733 2 $146,550 0 $0 0 $0 FILES CLOSED FOR INCOMPLETENESS 0 $0 2 $364,540 0 $0 0 $0
Aggregated Statistics For Year 2007(Based on 12 partial tracts) A) Conventional B) Refinancings C) Non-occupant Loans on D) Loans On Manufactured Number Average Value Number Average Value Number Average Value Number Average Value
LOANS ORIGINATED 100 $117,147 56 $115,607 10 $132,629 5 $74,886 APPLICATIONS APPROVED, NOT ACCEPTED 13 $160,969 19 $137,575 4 $223,458 2 $67,475 APPLICATIONS DENIED 2 $93,790 1 $218,820 0 $0 0 $0 APPLICATIONS WITHDRAWN 4 $106,888 8 $113,435 0 $0 0 $0 FILES CLOSED FOR INCOMPLETENESS 0 $0 0 $0 0 $0 0 $0
Aggregated Statistics For Year 2006(Based on 12 partial tracts) A) Conventional B) Refinancings C) Non-occupant Loans on D) Loans On Manufactured Number Average Value Number Average Value Number Average Value Number Average Value
LOANS ORIGINATED 64 $137,557 34 $131,635 3 $60,123 2 $68,350 APPLICATIONS APPROVED, NOT ACCEPTED 10 $126,107 12 $139,331 0 $0 0 $0 APPLICATIONS DENIED 1 $166,840 1 $68,530 0 $0 0 $0 APPLICATIONS WITHDRAWN 1 $66,040 2 $158,395 0 $0 0 $0 FILES CLOSED FOR INCOMPLETENESS 0 $0 0 $0 0 $0 0 $0
Aggregated Statistics For Year 2005(Based on 12 partial tracts) A) Conventional B) Refinancings C) Non-occupant Loans on D) Loans On Manufactured Number Average Value Number Average Value Number Average Value Number Average Value
LOANS ORIGINATED 65 $110,752 46 $129,785 8 $120,381 7 $57,084 APPLICATIONS APPROVED, NOT ACCEPTED 14 $113,594 24 $133,417 0 $0 0 $0 APPLICATIONS DENIED 1 $61,710 0 $0 0 $0 1 $61,710 APPLICATIONS WITHDRAWN 6 $97,363 8 $107,818 0 $0 3 $77,500 FILES CLOSED FOR INCOMPLETENESS 2 $74,140 0 $0 1 $101,550 0 $0
Aggregated Statistics For Year 2004(Based on 12 partial tracts) A) Conventional B) Refinancings C) Non-occupant Loans on D) Loans On Manufactured Number Average Value Number Average Value Number Average Value Number Average Value
LOANS ORIGINATED 95 $107,273 67 $119,751 2 $64,525 1 $47,350 APPLICATIONS APPROVED, NOT ACCEPTED 21 $102,258 33 $127,140 1 $51,830 1 $68,500 APPLICATIONS DENIED 0 $0 1 $268,170 0 $0 0 $0 APPLICATIONS WITHDRAWN 3 $69,143 4 $144,338 0 $0 0 $0 FILES CLOSED FOR INCOMPLETENESS 2 $70,105 4 $127,995 0 $0 2 $68,350
Aggregated Statistics For Year 2003(Based on 12 partial tracts) A) Conventional B) Refinancings C) Non-occupant Loans on Number Average Value Number Average Value Number Average Value
LOANS ORIGINATED 87 $103,995 153 $107,408 8 $75,170 APPLICATIONS APPROVED, NOT ACCEPTED 23 $100,620 45 $111,986 0 $0 APPLICATIONS DENIED 1 $37,430 2 $120,485 2 $100,775 APPLICATIONS WITHDRAWN 5 $95,616 8 $99,320 1 $127,970 FILES CLOSED FOR INCOMPLETENESS 0 $0 0 $0 0 $0
Aggregated Statistics For Year 2002(Based on 12 partial tracts) A) Conventional B) Refinancings C) Non-occupant Loans on Number Average Value Number Average Value Number Average Value
LOANS ORIGINATED 86 $94,788 116 $104,036 8 $76,146 APPLICATIONS APPROVED, NOT ACCEPTED 18 $101,246 44 $109,663 1 $60,930 APPLICATIONS DENIED 1 $79,120 1 $202,230 0 $0 APPLICATIONS WITHDRAWN 2 $100,035 23 $90,777 4 $56,082 FILES CLOSED FOR INCOMPLETENESS 0 $0 1 $52,950 0 $0
Aggregated Statistics For Year 2001(Based on 12 partial tracts) A) Conventional B) Refinancings C) Non-occupant Loans on Number Average Value Number Average Value Number Average Value
LOANS ORIGINATED 101 $96,883 113 $105,941 3 $39,783 APPLICATIONS APPROVED, NOT ACCEPTED 21 $102,466 28 $112,694 1 $89,180 APPLICATIONS DENIED 1 $95,640 5 $140,622 0 $0 APPLICATIONS WITHDRAWN 2 $86,090 3 $131,093 0 $0 FILES CLOSED FOR INCOMPLETENESS 1 $29,340 0 $0 0 $0
Aggregated Statistics For Year 2000(Based on 12 partial tracts) A) Conventional B) Refinancings C) Non-occupant Loans on Number Average Value Number Average Value Number Average Value
LOANS ORIGINATED 80 $94,267 28 $99,509 2 $57,485 APPLICATIONS APPROVED, NOT ACCEPTED 18 $93,181 8 $105,111 1 $16,190 APPLICATIONS DENIED 7 $65,847 3 $64,070 1 $28,320 APPLICATIONS WITHDRAWN 2 $61,340 4 $79,305 0 $0 FILES CLOSED FOR INCOMPLETENESS 2 $53,455 0 $0 0 $0
Aggregated Statistics For Year 1999(Based on 6 partial tracts) A) Conventional B) Refinancings C) Non-occupant Loans on Number Average Value Number Average Value Number Average Value
LOANS ORIGINATED 43 $95,262 22 $88,211 1 $108,030 APPLICATIONS APPROVED, NOT ACCEPTED 6 $101,993 5 $110,772 0 $0 APPLICATIONS DENIED 1 $57,160 2 $102,215 0 $0 APPLICATIONS WITHDRAWN 1 $85,980 1 $106,150 0 $0 FILES CLOSED FOR INCOMPLETENESS 0 $0 0 $0 0 $0
2002 - 2018 National Fire Incident Reporting System (NFIRS) incidents See full 2006 National Fire Incident Reporting System statistics for zip code 49457, Michigan
Most common first names in zip code 49457 among deceased individuals Name Count Lived (average)
John 42 73.5 years William 36 73.0 years Mary 21 77.7 years Frank 21 76.8 years Paul 20 74.6 years George 19 72.4 years Donald 18 68.6 years Edward 18 74.5 years James 18 66.9 years Charles 17 70.5 years
Most common last names in zip code 49457 among deceased individuals Last name Count Lived (average)
Smith 16 76.1 years Johnson 14 73.4 years Taylor 10 70.4 years Crawford 10 65.8 years Bean 9 64.4 years Miller 8 75.5 years Williams 7 77.1 years Chester 7 62.9 years Young 6 71.0 years Brown 6 75.2 years
Businesses in zip code 49457


 Nearest zip codes: 49425, 49442, 49440, 49445, 49461, 49444.
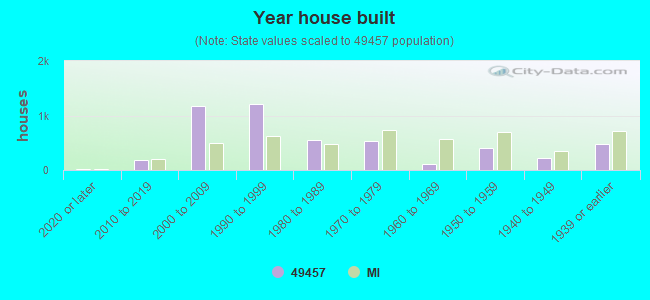


 According to the data from the years 2002 - 2018 the average number of fire incidents per year is 71. The highest number of reported fire incidents - 113 took place in 2012, and the least - 15 in 2005. The data has a rising trend.
 When looking into fire subcategories, the most incidents belonged to: Structure Fires (48.4%), and Outside Fires (35.3%).