Estimated zip code population in 2022: 4,771 Zip code population in 2010: 4,574 Zip code population in 2000: 4,610
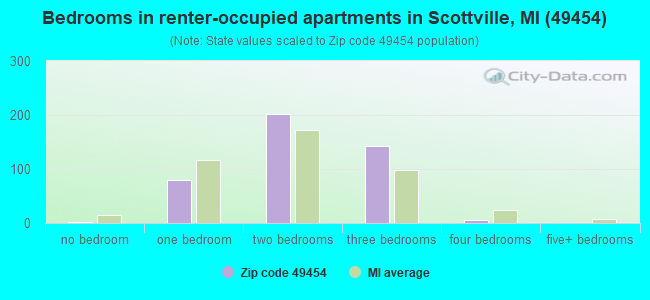
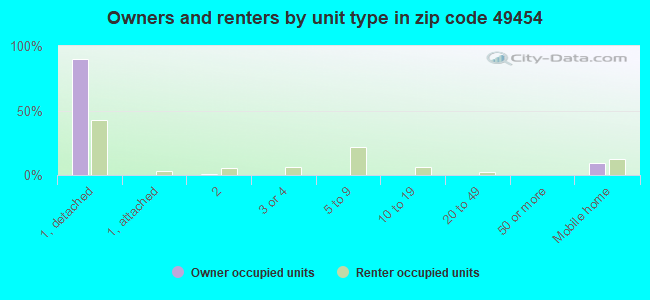
Houses and condos: 2,119 Renter-occupied apartments: 436
% of renters here:
24%
State:
27%
March 2022 cost of living index in zip code 49454: 81.1 (low, U.S. average is 100)
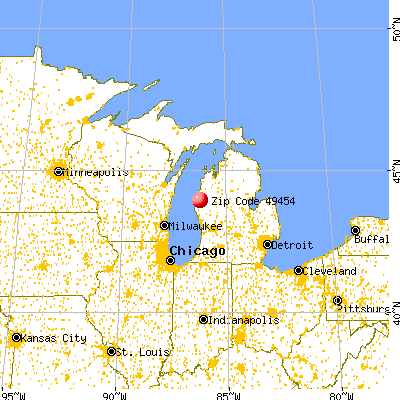
Land area: 73.1 sq. mi. Water area: 0.4 sq. mi.
Population density: 65 people per square mile
(very low).
OSM Map
General Map
Google Map
MSN Map
OSM Map
General Map
Google Map
MSN Map
OSM Map
General Map
Google Map
MSN Map
OSM Map
General Map
Google Map
MSN Map
Please wait while loading the map...
Real estate property taxes paid for housing units in 2022:
This zip code:
1.1% ($1,850)
Michigan:
1.2% ($2,746)
Median real estate property taxes paid for housing units with mortgages in 2022: $1,923 (1.1%) Median real estate property taxes paid for housing units with no mortgage in 2022: $1,754 (1.1%)
Business Search- 14 Million verified businesses
Males: 2,319
(48.6%)
Females: 2,452
(51.4%)
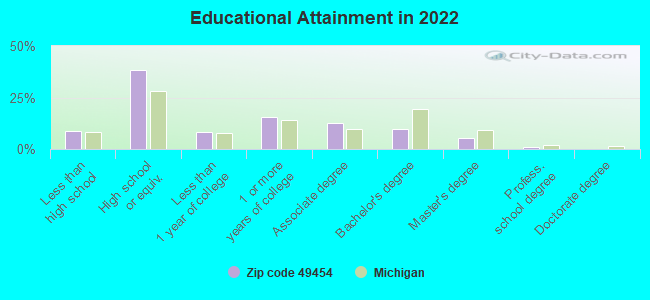
For population 25 years and over in 49454:
High school or higher: 90.1%
Bachelor's degree or higher: 16.1%
Graduate or professional degree: 6.5%
Unemployed: 5.8%
Mean travel time to work (commute): 18.1 minutes
For population 15 years and over in 49454:
Never married: 31.6%
Now married: 46.5%
Separated: 0.8%
Widowed: 6.6%
Divorced: 14.4%
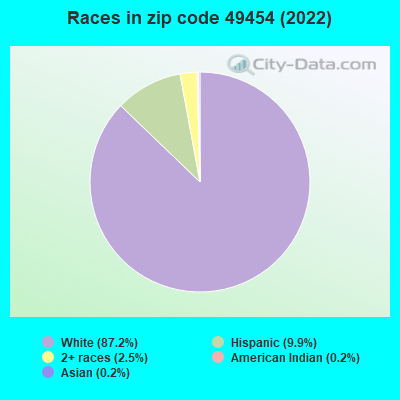
Zip code 49454 compared to state average:
Black race population percentage significantly below state average.
Hispanic race population percentage above state average.
Foreign-born population percentage below state average.
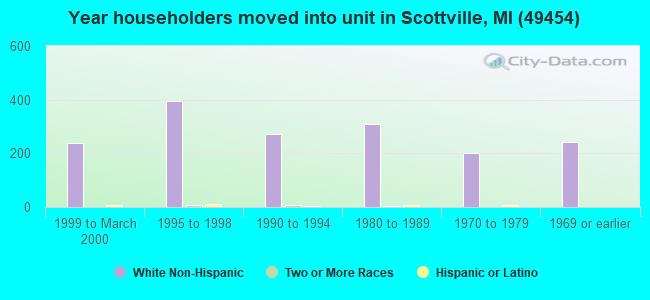
Length of stay since moving in above state average.
Number of college students below state average.
Percentage of population with a bachelor's degree or higher below state average.
Averages for the 2020 tax year for zip code 49454, filed in 2021:
Average Adjusted Gross Income (AGI) in 2020: $48,066 (Individual Income Tax Returns)
Here:
$48,066
State:
$68,945
Salary/wage: $41,264 (reported on 79.7% of returns)
Here:
$41,264
State:
$57,142
(% of AGI for various income ranges: 1160.2% for AGIs below $25k, 3364.7% for AGIs $25k-50k, 6265.0% for AGIs $50k-75k, 9094.3% for AGIs $75k-100k, 14471.7% for AGIs $100k-200k)
Taxable interest for individuals: $567 (reported on 27.0% of returns)
This zip code:
$567
Michigan:
$1,630
(% of AGI for various income ranges: 9.8% for AGIs below $25k, 21.2% for AGIs $25k-50k, 30.5% for AGIs $50k-75k, 15.0% for AGIs $75k-100k, 75.0% for AGIs $100k-200k)
Ordinary dividends: $2,789 (reported on 15.8% of returns)
Here:
$2,789
State:
$6,972
(% of AGI for various income ranges: 13.8% for AGIs below $25k, 18.0% for AGIs $25k-50k, 108.2% for AGIs $50k-75k, 50.0% for AGIs $75k-100k, 416.7% for AGIs $100k-200k)
Net capital gain/loss in AGI: +$5,963 (reported on 13.5% of returns)
Here:
+$5,963
State:
+$20,064
(% of AGI for various income ranges: 6.9% for AGIs below $25k, 19.2% for AGIs $25k-50k, 93.6% for AGIs $50k-75k, 137.1% for AGIs $75k-100k, 1045.8% for AGIs $100k-200k)
Profit/loss from business: +$10,138 (reported on 13.1% of returns)
Here:
+$10,138
State:
+$11,172
(% of AGI for various income ranges: 74.2% for AGIs below $25k, 138.0% for AGIs $25k-50k, 170.5% for AGIs $50k-75k, 553.6% for AGIs $75k-100k, 565.0% for AGIs $100k-200k)
Taxable individual retirement arrangement distribution: $11,170 (reported on 10.4% of returns)
49454:
$11,170
Michigan:
$19,803
(% of AGI for various income ranges: 71.6% for AGIs below $25k, 121.2% for AGIs $25k-50k, 302.3% for AGIs $50k-75k, 743.3% for AGIs $100k-200k)
Total itemized deductions: $33,575 (reported on 1.8% of returns)
Here:
$33,575
State:
$34,117
(% of AGI for various income ranges: 107.5% for AGIs $25k-50k, 662.5% for AGIs $100k-200k)
Charity contributions: $6,300 (reported on 1.4% of returns)
Here:
$6,300
State:
$13,548
(% of AGI for various income ranges: 135.0% for AGIs $75k-100k)
Taxes paid: $8,525 (reported on 1.8% of returns)
49454:
$8,525
State:
$7,972
(% of AGI for various income ranges: 23.3% for AGIs $25k-50k, 185.0% for AGIs $100k-200k)
Earned income credit: $2,176 (reported on 16.7% of returns)
Here:
$2,176
State:
$2,251
(% of AGI for various income ranges: 82.0% for AGIs below $25k, 69.4% for AGIs $25k-50k)
Percentage of individuals using paid preparers for their 2020 taxes: 94.6%
Here:
95%
State:
93%
(% for various income ranges: 95.1% for AGIs below $25k, 92.4% for AGIs $25k-50k, 96.8% for AGIs $50k-75k, 95.0% for AGIs $75k-100k, 95.0% for AGIs $100k-200k, 100.0% for AGIs over 200k)
Averages for the 2012 tax year for zip code 49454, filed in 2013:
Average Adjusted Gross Income (AGI) in 2012: $38,008 (Individual Income Tax Returns)
Here:
$38,008
State:
$55,609
Salary/wage: $33,010 (reported on 82.1% of returns)
Here:
$33,010
State:
$46,782
(% of AGI for various income ranges: 72.0% for AGIs below $25k, 74.4% for AGIs $25k-50k, 74.8% for AGIs $50k-75k, 74.4% for AGIs $75k-100k, 62.9% for AGIs $100k-200k)
Taxable interest for individuals: $685 (reported on 33.5% of returns)
This zip code:
$685
Michigan:
$1,491
(% of AGI for various income ranges: 1.2% for AGIs below $25k, 0.6% for AGIs $25k-50k, 0.2% for AGIs $50k-75k, 0.5% for AGIs $75k-100k, 0.7% for AGIs $100k-200k)
Ordinary dividends: $1,835 (reported on 16.0% of returns)
Here:
$1,835
State:
$6,225
(% of AGI for various income ranges: 1.2% for AGIs below $25k, 0.7% for AGIs $25k-50k, 0.6% for AGIs $50k-75k, 0.5% for AGIs $75k-100k, 1.0% for AGIs $100k-200k)
Net capital gain/loss in AGI: +$3,425 (reported on 11.3% of returns)
Here:
+$3,425
State:
+$9,326
(% of AGI for various income ranges: 0.4% for AGIs $25k-50k, 0.5% for AGIs $50k-75k, 0.3% for AGIs $75k-100k, 3.4% for AGIs $100k-200k)
Profit/loss from business: +$8,134 (reported on 15.1% of returns)
Here:
+$8,134
State:
+$11,523
(% of AGI for various income ranges: 4.2% for AGIs below $25k, 3.3% for AGIs $25k-50k, 3.6% for AGIs $50k-75k, 6.6% for AGIs $75k-100k)
Taxable individual retirement arrangement distribution: $9,659 (reported on 10.4% of returns)
49454:
$9,659
Michigan:
$15,298
(% of AGI for various income ranges: 3.3% for AGIs below $25k, 2.3% for AGIs $25k-50k, 3.2% for AGIs $50k-75k, 5.6% for AGIs $75k-100k)
Total itemized deductions: $17,385 (22% of AGI, reported on 18.4% of returns)
Here:
$17,385
State:
$21,628
Here:
22.1% of AGI
State:
18.4% of AGI
(% of AGI for various income ranges: 6.1% for AGIs below $25k, 6.2% for AGIs $25k-50k, 8.7% for AGIs $50k-75k, 9.8% for AGIs $75k-100k, 10.7% for AGIs $100k-200k)
Charity contributions: $3,142 (reported on 14.6% of returns)
Here:
$3,142
State:
$4,225
(% of AGI for various income ranges: 0.6% for AGIs below $25k, 0.7% for AGIs $25k-50k, 1.2% for AGIs $50k-75k, 1.3% for AGIs $75k-100k, 1.9% for AGIs $100k-200k)
Taxes paid: $5,413 (reported on 18.4% of returns)
49454:
$5,413
State:
$8,327
(% of AGI for various income ranges: 1.2% for AGIs below $25k, 1.6% for AGIs $25k-50k, 2.4% for AGIs $50k-75k, 3.2% for AGIs $75k-100k, 4.2% for AGIs $100k-200k)
Earned income credit: $2,202 (reported on 22.2% of returns)
Here:
$2,202
State:
$2,306
(% of AGI for various income ranges: 6.3% for AGIs below $25k, 1.4% for AGIs $25k-50k)
Percentage of individuals using paid preparers for their 2012 taxes: 57.5%
Here:
58%
State:
57%
(% for various income ranges: 53.8% for AGIs below $25k, 56.0% for AGIs $25k-50k, 67.9% for AGIs $50k-75k, 60.0% for AGIs $75k-100k, 69.2% for AGIs $100k-200k)
Averages for the 2004 tax year for zip code 49454, filed in 2005:
Average Adjusted Gross Income (AGI) in 2004: $31,752 (Individual Income Tax Returns)
Here:
$31,752
State:
$48,204
Salary/wage: $28,889 (reported on 83.7% of returns)
Here:
$28,889
State:
$42,791
(% of AGI for various income ranges: 95.2% for AGIs below $10k, 72.3% for AGIs $10k-25k, 80.2% for AGIs $25k-50k, 82.8% for AGIs $50k-75k, 72.8% for AGIs $75k-100k, 58.5% for AGIs over 100k)
Taxable interest for individuals: $1,076 (reported on 42.6% of returns)
This zip code:
$1,076
Michigan:
$1,725
(% of AGI for various income ranges: 5.0% for AGIs below $10k, 2.3% for AGIs $10k-25k, 1.1% for AGIs $25k-50k, 0.9% for AGIs $50k-75k, 1.5% for AGIs $75k-100k, 1.5% for AGIs over 100k)
Taxable dividends: $2,302 (reported on 20.0% of returns)
Here:
$2,302
State:
$3,420
(% of AGI for various income ranges: 2.4% for AGIs below $10k, 2.0% for AGIs $10k-25k, 0.7% for AGIs $25k-50k, 0.5% for AGIs $50k-75k, 0.6% for AGIs $75k-100k, 5.2% for AGIs over 100k)
Net capital gain/loss: +$5,037 (reported on 15.5% of returns)
Here:
+$5,037
State:
+$8,532
(% of AGI for various income ranges: -1.9% for AGIs below $10k, 0.2% for AGIs $10k-25k, 1.3% for AGIs $25k-50k, 0.4% for AGIs $50k-75k, 5.2% for AGIs $75k-100k, 8.8% for AGIs over 100k)
Profit/loss from business: +$6,503 (reported on 14.9% of returns)
Here:
+$6,503
State:
+$9,547
(% of AGI for various income ranges: -2.5% for AGIs below $10k, 4.4% for AGIs $10k-25k, 3.0% for AGIs $25k-50k, 2.6% for AGIs $50k-75k, 1.7% for AGIs $75k-100k, 5.6% for AGIs over 100k)
IRA payment deduction: $2,745 (reported on 2.4% of returns)
49454:
$2,745
Michigan:
$2,875
Total itemized deductions: $14,671 (24% of AGI, reported on 21.3% of returns)
Here:
$14,671
State:
$18,509
Here:
24.4% of AGI
State:
20.7% of AGI
(% of AGI for various income ranges: 7.1% for AGIs below $10k, 7.4% for AGIs $10k-25k, 9.0% for AGIs $25k-50k, 11.0% for AGIs $50k-75k, 11.8% for AGIs $75k-100k, 10.2% for AGIs over 100k)
Charity contributions deductions: $2,294 (4% of AGI, reported on 17.8% of returns)
Here:
$2,294
State:
$3,365
Here:
3.6% of AGI
State:
3.6% of AGI
(% of AGI for various income ranges: 0.7% for AGIs below $10k, 1.1% for AGIs $10k-25k, 0.9% for AGIs $25k-50k, 1.3% for AGIs $50k-75k, 1.7% for AGIs $75k-100k, 2.0% for AGIs over 100k)
Total tax: $3,737 (reported on 66.4% of returns)
49454:
$3,737
State:
$7,691
(% of AGI for various income ranges: 1.9% for AGIs below $10k, 3.7% for AGIs $10k-25k, 5.3% for AGIs $25k-50k, 8.1% for AGIs $50k-75k, 10.2% for AGIs $75k-100k, 15.5% for AGIs over 100k)
Earned income credit: $1,565 (reported on 19.1% of returns)
Here:
$1,565
State:
$1,737
Percentage of individuals using paid preparers for their 2004 taxes: 59.4%
Here:
59%
State:
60%
(% for various income ranges: 52.7% for AGIs below $10k, 59.1% for AGIs $10k-25k, 59.8% for AGIs $25k-50k, 65.5% for AGIs $50k-75k, 64.3% for AGIs $75k-100k, 80.6% for AGIs over 100k)
Likely homosexual households (counted as self-reported same-sex unmarried-partner households)
Lesbian couples: 0.3% of all households
Gay men: 0.2% of all households
Household received Food Stamps/SNAP in the past 12 months: 324 Household did not receive Food Stamps/SNAP in the past 12 months: 1,531
Women who had a birth in the past 12 months: 51 (46 now married, 6 unmarried) Women who did not have a birth in the past 12 months: 1,009 (377 now married, 632 unmarried)
Housing units in zip code 49454 with a mortgage: 751 (69 second mortgage, 59 both second mortgage and home equity loan) Houses without a mortgage: 23
Median monthly owner costs for units with a mortgage: $1,173 Median monthly owner costs for units without a mortgage: $488
Residents with income below the poverty level in 2022:
This zip code:
16.0%
Whole state:
13.4%
Residents with income below 50% of the poverty level in 2022:
This zip code:
8.3%
Whole state:
6.9%
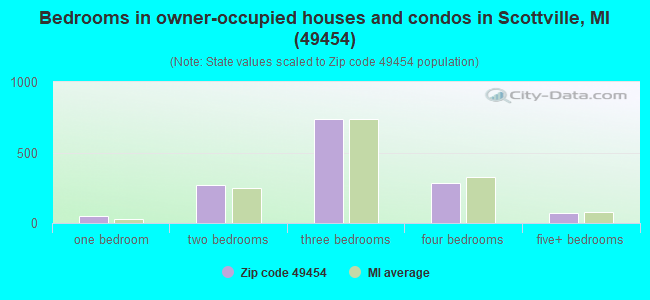
Median number of rooms in houses and condos:
Here:
6.3
State:
6.5
Median number of rooms in apartments:
Here:
4.2
State:
4.3
Notable locations in this zip code not listed on our city pages
Notable locations in zip code 49454: Amber Station (A), Scottville Station (B), Crystal Lake Campground (C), Elm Flats School (D), Riverton Fire Department (E), Mason County Library (F), Scottville Police Department (G), Scottville Fire Department (H). Display/hide their locations on the map
Churches in zip code 49454 include: Reformed Church (A), Victory Baptist Church (B), Crossroads Church (C), Scottville Church of Christ (D), Saint Jerome's Catholic Church (E), United Methodist Church (F), Our Saviour's Lutheran Church (G), Redeemer Lutheran Church (H), Saint Paul Church (I). Display/hide their locations on the map
Cemeteries: North Amber Cemetery (1), Center Riverton Cemetery (2), Sugar Grove Cemetery (3), Riverton Cemetery (4), Riverside Cemetery (5), Brookside Cemetery (6). Display/hide their locations on the map
In group quarters: 93 (-1 institutionalized population)
Size of family households: 483 2-persons, 325 3-persons, 237 4-persons, 121 5-persons, 35 6-persons, 32 7-or-more-persons
Size of nonfamily households: 520 1-person, 77 2-persons, 8 3-persons
535 married couples with children.
393 single-parent households (77 men, 316 women).
93.2% of residents of 49454 zip code speak English at home.
3.7% of residents speak Spanish at home (49% very well, 39% well, 13% not well).
2.1% of residents speak other Indo-European language at home (85% very well, 13% well, 2% not well).
0.6% of residents speak Asian or Pacific Island language at home (89% very well, 11% not well).
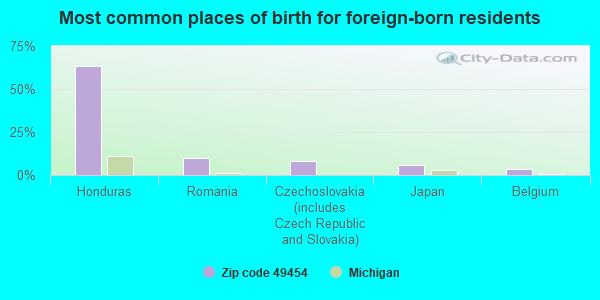
Foreign born population: 148 (3.1%) (45.6% of them are naturalized citizens)
This zip code:
3.1%
Whole state:
6.9%
63%Honduras
10%Romania
8%Czechoslovakia (includes Czech Republic and Slovakia)
6%Japan
3%Belgium
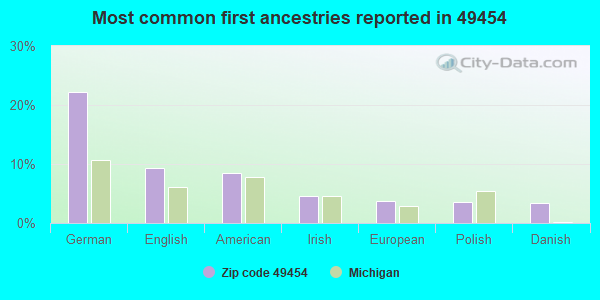
22%German
9%English
8%American
5%Irish
4%European
4%Polish
3%Danish
Year of entry for the foreign-born population
732010 or later
162000 to 2009
291990 to 1999
56Before 1990
Facilities with environmental interests located in this zip code:
BLARNEY CASTLE OIL CO (578 W US 10 in SCOTTVILLE, MI)
(Resource Conservation and Recovery Act (tracking hazardous waste))
DITTMER GARY FARM (2682 W CHAUVEZ RD in SCOTTVILLE, MI)
(Resource Conservation and Recovery Act (tracking hazardous waste))
14 AVENUE CARTAGE (T04 S R19 W SEC 12 BENTON TWP in SCOTTVILLE, MI)
(Resource Conservation and Recovery Act (tracking hazardous waste))
DIVERSIFIED NATURAL PRODUCTS (506 E STATE ST in SCOTTVILLE, MI)
Small Quantity Generators, between 100 kg and 1000 kg of hazardous waste/month (Resource Conservation and Recovery Act (tracking hazardous waste)) Business NAICS classification: OTHER VEGETABLE (EXCEPT POTATO) AND MELON FARMING.; FRUIT AND VEGETABLE CANNING. Organizations: CHIQUITA BRANDS INTERNATIONAL (CONTACT/OPERATOR)
Alternative names: STOKELY USA
ADMIRAL PETROLEUM CO (130 STATE ST in SCOTTVILLE, MI)
Conditionally Exempt Small Quantity Generators, less than 100 kg/month of hazardous waste (Resource Conservation and Recovery Act (tracking hazardous waste)) - notification Organizations: SPEEDWAY/SUPERAMERICA LLC (CONTACT/OPERATOR)
Alternative names: SPEEDWAY 6292
Housing units lacking complete plumbing facilities: 3.0% Housing units lacking complete kitchen facilities: 2.0%
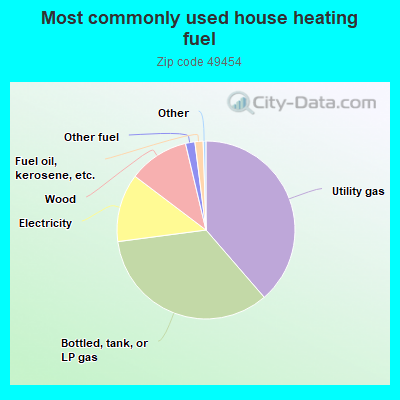
38.7%Utility gas
34.3%Bottled, tank, or LP gas
12.4%Electricity
11.0%Wood
1.7%Other fuel
1.5%Fuel oil, kerosene, etc.
Population in 1990: 4,229. Population change in the 1990s: +381 (+9.0%).
Place of birth for U.S.-born residents:
This state: 3,899
Northeast: 29
Midwest: 238
South: 184
West: 249
62% of the 49454 zip code residents lived in the same house 5 years ago. Out of people who lived in different houses, 69% lived in this county. Out of people who lived in different counties, 50% lived in Michigan.
88% of the 49454 zip code residents lived in the same house 1 year ago. Out of people who lived in different houses, 31% moved from this county. Out of people who lived in different houses, 45% moved from different county within same state. Out of people who lived in different houses, 7% moved from different state. Out of people who lived in different houses, 18% moved from abroad.
Private vs. public school enrollment:
Students in private schools in grades 1 to 8 (elementary and middle school): 39
Here:
8.0%
Michigan:
12.4%
Students in private schools in grades 9 to 12 (high school): 7
Here:
2.6%
Michigan:
9.8%
Students in private undergraduate colleges: 14
Here:
14.4%
Michigan:
14.9%
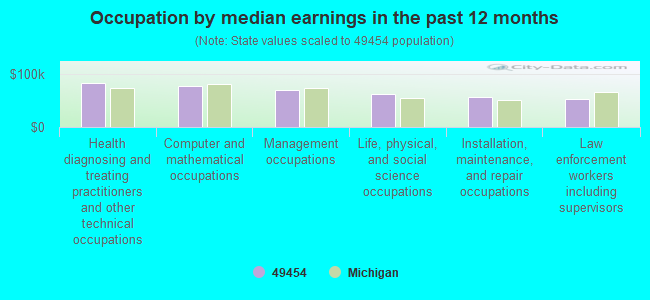
Occupation by median earnings in the past 12 months ($)
83,075Health diagnosing and treating practitioners and other technical occupations
76,498Computer and mathematical occupations
70,319Management occupations
61,418Life, physical, and social science occupations
57,409Installation, maintenance, and repair occupations
52,857Law enforcement workers including supervisors
Top industries in this zip code by the number of employees in 2005:
Health Care and Social Assistance: Other Individual and Family Services (50-99 employees: 1 establishment)
Accommodation and Food Services: Full-Service Restaurants (20-49: 1, 1-4: 2)
Other Services (except Public Administration): Religious Organizations (5-9: 2, 1-4: 5)
Health Care and Social Assistance: Child Day Care Services (10-19: 1, 1-4: 1)
Utilities: Electric Power Distribution (10-19: 1)
People in group quarters in 2010:
40 people in group homes intended for adults
10 people in nursing facilities/skilled-nursing facilities
People in group quarters in 2000:
16 people in other group homes
10 people in homes for the mentally ill
10 people in other noninstitutional group quarters
5 people in homes for the mentally retarded
Fatal accident statistics in 2013:
Fatal accident count: 1
Vehicles involved in fatal accidents: 2
Fatal accidents caused by drunken drivers: 0
Fatalities: 1
Persons involved in fatal accidents: 2
Pedestrians involved in fatal accidents: 0
Fatal accident statistics in 2012:
Fatal accident count: 1
Vehicles involved in fatal accidents: 2
Fatal accidents caused by drunken drivers: 0
Fatalities: 2
Persons involved in fatal accidents: 3
Pedestrians involved in fatal accidents: 0
2002 - 2018 National Fire Incident Reporting System (NFIRS) incidents
According to the data from the years 2002 - 2018 the average number of fire incidents per year is 28. The highest number of reported fire incidents - 46 took place in 2012, and the least - 12 in 2018. The data has a declining trend.
When looking into fire subcategories, the most incidents belonged to: Structure Fires (51.3%), and Outside Fires (28.3%).
Fire incident types reported to NFIRS in Zip Code 49454


 Nearest zip codes: 49405, 49431, 49411, 49410, 49449, 49458.


 According to the data from the years 2002 - 2018 the average number of fire incidents per year is 28. The highest number of reported fire incidents - 46 took place in 2012, and the least - 12 in 2018. The data has a declining trend.
 When looking into fire subcategories, the most incidents belonged to: Structure Fires (51.3%), and Outside Fires (28.3%).