Estimated zip code population in 2022: 2,475 Zip code population in 2010: 1,909 Zip code population in 2000: 1,642
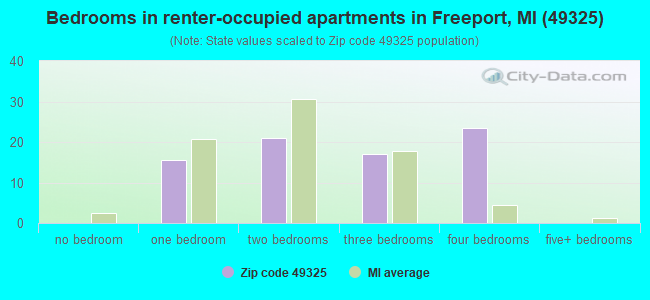
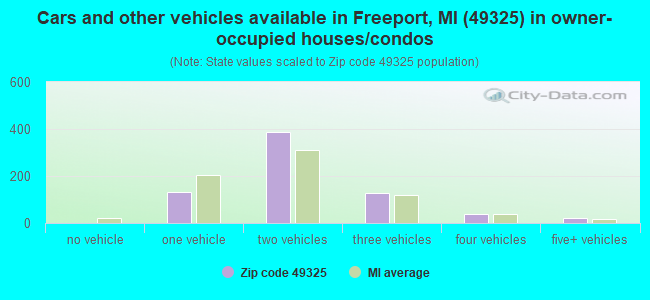
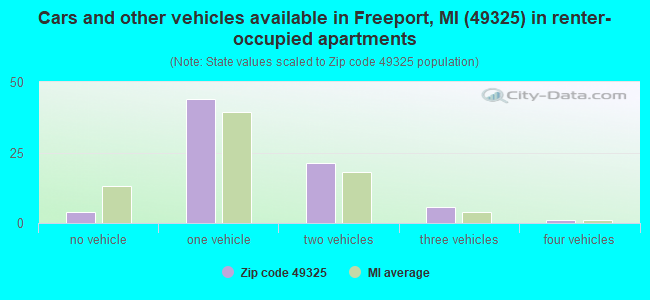
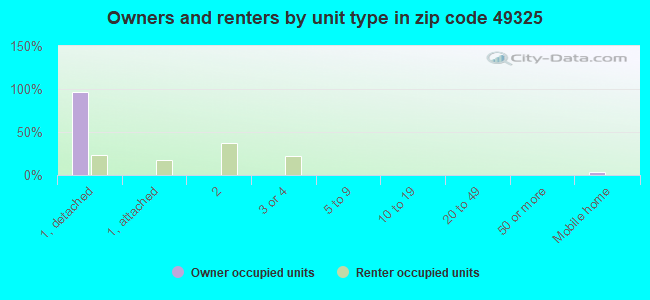
Houses and condos: 787 Renter-occupied apartments: 75
% of renters here:
10%
State:
27%
March 2022 cost of living index in zip code 49325: 81.3 (low, U.S. average is 100)
Land area: 27.9 sq. mi. Water area: 0.2 sq. mi.
Population density: 89 people per square mile
(very low).
OSM Map
General Map
Google Map
MSN Map
OSM Map
General Map
Google Map
MSN Map
OSM Map
General Map
Google Map
MSN Map
OSM Map
General Map
Google Map
MSN Map
Please wait while loading the map...
Real estate property taxes paid for housing units in 2022:
This zip code:
1.0% ($2,494)
Michigan:
1.2% ($2,746)
Median real estate property taxes paid for housing units with mortgages in 2022: $2,225 (1.1%) Median real estate property taxes paid for housing units with no mortgage in 2022: $2,621 (0.9%)
Business Search- 14 Million verified businesses
Males: 1,214
(49.1%)
Females: 1,260
(50.9%)
For population 25 years and over in 49325:
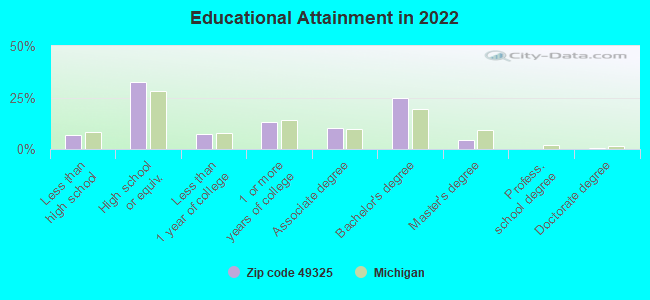
High school or higher: 93.2%
Bachelor's degree or higher: 30.2%
Graduate or professional degree: 5.3%
Unemployed: 2.0%
Mean travel time to work (commute): 28.9 minutes
For population 15 years and over in 49325:
Never married: 24.9%
Now married: 59.8%
Separated: 0.6%
Widowed: 3.5%
Divorced: 11.1%
Zip code 49325 compared to state average:
Unemployed percentage below state average.
Black race population percentage significantly below state average.
Hispanic race population percentage below state average.
Median age below state average.
Foreign-born population percentage significantly below state average.
Renting percentage significantly below state average.
Length of stay since moving in above state average.
Averages for the 2020 tax year for zip code 49325, filed in 2021:
Average Adjusted Gross Income (AGI) in 2020: $63,784 (Individual Income Tax Returns)
Here:
$63,784
State:
$68,945
Salary/wage: $56,154 (reported on 84.5% of returns)
Here:
$56,154
State:
$57,142
(% of AGI for various income ranges: 1214.4% for AGIs below $25k, 3306.8% for AGIs $25k-50k, 5850.0% for AGIs $50k-75k, 9491.0% for AGIs $75k-100k, 16428.9% for AGIs $100k-200k)
Taxable interest for individuals: $553 (reported on 39.2% of returns)
This zip code:
$553
Michigan:
$1,630
(% of AGI for various income ranges: 43.1% for AGIs below $25k, 16.8% for AGIs $25k-50k, 10.0% for AGIs $50k-75k, 23.0% for AGIs $75k-100k, 80.0% for AGIs $100k-200k)
Ordinary dividends: $2,379 (reported on 14.4% of returns)
Here:
$2,379
State:
$6,972
(% of AGI for various income ranges: 31.2% for AGIs below $25k, 37.9% for AGIs $25k-50k, 39.0% for AGIs $75k-100k, 191.1% for AGIs $100k-200k)
Net capital gain/loss in AGI: +$6,323 (reported on 13.4% of returns)
Here:
+$6,323
State:
+$20,064
(% of AGI for various income ranges: 25.6% for AGIs below $25k, 62.6% for AGIs $25k-50k, 110.0% for AGIs $75k-100k, 613.3% for AGIs $100k-200k)
Profit/loss from business: +$9,654 (reported on 13.4% of returns)
Here:
+$9,654
State:
+$11,172
(% of AGI for various income ranges: 80.0% for AGIs below $25k, 135.8% for AGIs $25k-50k, 309.3% for AGIs $50k-75k, 484.4% for AGIs $100k-200k)
Taxable individual retirement arrangement distribution: $14,267 (reported on 9.3% of returns)
49325:
$14,267
Michigan:
$19,803
(% of AGI for various income ranges: 91.9% for AGIs below $25k, 260.0% for AGIs $25k-50k, 643.0% for AGIs $75k-100k)
Total itemized deductions: $35,350 (reported on 2.1% of returns)
Here:
$35,350
State:
$34,117
(% of AGI for various income ranges: 707.0% for AGIs $75k-100k)
Taxes paid: $10,000 (reported on 2.1% of returns)
49325:
$10,000
State:
$7,972
(% of AGI for various income ranges: 200.0% for AGIs $75k-100k)
Earned income credit: $2,080 (reported on 10.3% of returns)
Here:
$2,080
State:
$2,251
(% of AGI for various income ranges: 61.9% for AGIs below $25k, 57.4% for AGIs $25k-50k)
Percentage of individuals using paid preparers for their 2020 taxes: 95.9%
Here:
96%
State:
93%
(% for various income ranges: 92.6% for AGIs below $25k, 95.7% for AGIs $25k-50k, 100.0% for AGIs $50k-75k, 92.9% for AGIs $75k-100k, 100.0% for AGIs $100k-200k, 100.0% for AGIs over 200k)
Averages for the 2012 tax year for zip code 49325, filed in 2013:
Average Adjusted Gross Income (AGI) in 2012: $48,799 (Individual Income Tax Returns)
Here:
$48,799
State:
$55,609
Salary/wage: $44,965 (reported on 81.6% of returns)
Here:
$44,965
State:
$46,782
(% of AGI for various income ranges: 66.8% for AGIs below $25k, 79.5% for AGIs $25k-50k, 78.8% for AGIs $50k-75k, 79.2% for AGIs $75k-100k, 69.6% for AGIs $100k-200k)
Taxable interest for individuals: $559 (reported on 33.3% of returns)
This zip code:
$559
Michigan:
$1,491
(% of AGI for various income ranges: 2.0% for AGIs below $25k, 0.4% for AGIs $25k-50k, 0.2% for AGIs $50k-75k, 0.4% for AGIs $75k-100k)
Ordinary dividends: $1,846 (reported on 14.9% of returns)
Here:
$1,846
State:
$6,225
(% of AGI for various income ranges: 1.3% for AGIs below $25k, 1.3% for AGIs $25k-50k, 0.3% for AGIs $50k-75k, 0.5% for AGIs $75k-100k, 0.1% for AGIs $100k-200k)
Net capital gain/loss in AGI: +$1,878 (reported on 10.3% of returns)
Here:
+$1,878
State:
+$9,326
(% of AGI for various income ranges: 0.5% for AGIs $50k-75k, 0.9% for AGIs $100k-200k)
Profit/loss from business: +$5,855 (reported on 12.6% of returns)
Here:
+$5,855
State:
+$11,523
(% of AGI for various income ranges: 3.4% for AGIs below $25k, 4.3% for AGIs $25k-50k, 2.3% for AGIs $50k-75k)
Taxable individual retirement arrangement distribution: $13,550 (reported on 11.5% of returns)
49325:
$13,550
Michigan:
$15,298
(% of AGI for various income ranges: 6.8% for AGIs below $25k, 4.5% for AGIs $25k-50k, 8.8% for AGIs $75k-100k)
Total itemized deductions: $16,308 (20% of AGI, reported on 27.6% of returns)
Here:
$16,308
State:
$21,628
Here:
19.6% of AGI
State:
18.4% of AGI
(% of AGI for various income ranges: 8.6% for AGIs $25k-50k, 8.9% for AGIs $50k-75k, 11.3% for AGIs $75k-100k, 10.9% for AGIs $100k-200k)
Charity contributions: $3,253 (reported on 19.5% of returns)
Here:
$3,253
State:
$4,225
(% of AGI for various income ranges: 0.4% for AGIs $25k-50k, 1.2% for AGIs $50k-75k, 1.8% for AGIs $75k-100k, 1.9% for AGIs $100k-200k)
Taxes paid: $5,775 (reported on 27.6% of returns)
49325:
$5,775
State:
$8,327
(% of AGI for various income ranges: 2.3% for AGIs $25k-50k, 2.7% for AGIs $50k-75k, 3.9% for AGIs $75k-100k, 4.7% for AGIs $100k-200k)
Earned income credit: $2,069 (reported on 14.9% of returns)
Here:
$2,069
State:
$2,306
(% of AGI for various income ranges: 5.0% for AGIs below $25k, 1.2% for AGIs $25k-50k)
Percentage of individuals using paid preparers for their 2012 taxes: 58.6%
Here:
59%
State:
57%
(% for various income ranges: 53.1% for AGIs below $25k, 57.1% for AGIs $25k-50k, 66.7% for AGIs $50k-75k, 60.0% for AGIs $75k-100k, 66.7% for AGIs $100k-200k)
Averages for the 2004 tax year for zip code 49325, filed in 2005:
Average Adjusted Gross Income (AGI) in 2004: $43,104 (Individual Income Tax Returns)
Here:
$43,104
State:
$48,204
Salary/wage: $40,796 (reported on 87.3% of returns)
Here:
$40,796
State:
$42,791
(% of AGI for various income ranges: 102.3% for AGIs below $10k, 72.2% for AGIs $10k-25k, 83.3% for AGIs $25k-50k, 87.6% for AGIs $50k-75k, 88.2% for AGIs $75k-100k, 70.7% for AGIs over 100k)
Taxable interest for individuals: $1,009 (reported on 42.4% of returns)
This zip code:
$1,009
Michigan:
$1,725
(% of AGI for various income ranges: 4.1% for AGIs below $10k, 2.9% for AGIs $10k-25k, 1.9% for AGIs $25k-50k, 0.3% for AGIs $50k-75k, 0.2% for AGIs $75k-100k, 0.6% for AGIs over 100k)
Taxable dividends: $1,125 (reported on 17.6% of returns)
Here:
$1,125
State:
$3,420
(% of AGI for various income ranges: 2.9% for AGIs below $10k, 1.0% for AGIs $10k-25k, 0.4% for AGIs $25k-50k, 0.0% for AGIs $50k-75k, 0.3% for AGIs $75k-100k, 0.9% for AGIs over 100k)
Net capital gain/loss: +$6,632 (reported on 14.3% of returns)
Here:
+$6,632
State:
+$8,532
(% of AGI for various income ranges: 1.3% for AGIs $10k-25k, 0.2% for AGIs $25k-50k, 0.8% for AGIs $50k-75k, 0.6% for AGIs $75k-100k, 9.2% for AGIs over 100k)
Profit/loss from business: +$3,385 (reported on 14.3% of returns)
Here:
+$3,385
State:
+$9,547
(% of AGI for various income ranges: -7.5% for AGIs below $10k, 2.9% for AGIs $10k-25k, 3.9% for AGIs $25k-50k, 0.5% for AGIs $50k-75k, -0.4% for AGIs $75k-100k)
IRA payment deduction: $2,133 (reported on 1.8% of returns)
49325:
$2,133
Michigan:
$2,875
Total itemized deductions: $15,351 (23% of AGI, reported on 36.2% of returns)
Here:
$15,351
State:
$18,509
Here:
22.6% of AGI
State:
20.7% of AGI
(% of AGI for various income ranges: 6.0% for AGIs $10k-25k, 12.9% for AGIs $25k-50k, 13.7% for AGIs $50k-75k, 15.3% for AGIs $75k-100k, 12.8% for AGIs over 100k)
Charity contributions deductions: $2,888 (4% of AGI, reported on 28.5% of returns)
Here:
$2,888
State:
$3,365
Here:
4.0% of AGI
State:
3.6% of AGI
(% of AGI for various income ranges: 0.5% for AGIs $10k-25k, 1.9% for AGIs $25k-50k, 1.6% for AGIs $50k-75k, 2.6% for AGIs $75k-100k, 2.3% for AGIs over 100k)
Total tax: $4,606 (reported on 79.5% of returns)
49325:
$4,606
State:
$7,691
(% of AGI for various income ranges: 3.6% for AGIs below $10k, 3.9% for AGIs $10k-25k, 6.4% for AGIs $25k-50k, 7.2% for AGIs $50k-75k, 9.3% for AGIs $75k-100k, 14.6% for AGIs over 100k)
Earned income credit: $1,402 (reported on 10.6% of returns)
Here:
$1,402
State:
$1,737
Percentage of individuals using paid preparers for their 2004 taxes: 58.3%
Here:
58%
State:
60%
(% for various income ranges: 53.9% for AGIs below $10k, 53.9% for AGIs $10k-25k, 59.7% for AGIs $25k-50k, 63.1% for AGIs $50k-75k, 55.6% for AGIs $75k-100k, 67.4% for AGIs over 100k)
Household received Food Stamps/SNAP in the past 12 months: 44 Household did not receive Food Stamps/SNAP in the past 12 months: 734
Women who had a birth in the past 12 months: 7 (6 now married, 0 unmarried) Women who did not have a birth in the past 12 months: 492 (258 now married, 232 unmarried)
Housing units in zip code 49325 with a mortgage: 326 (30 second mortgage, 1 home equity loan, 22 both second mortgage and home equity loan) Houses without a mortgage: 33
Median monthly owner costs for units with a mortgage: $1,502 Median monthly owner costs for units without a mortgage: $578
Residents with income below the poverty level in 2022:
This zip code:
6.0%
Whole state:
13.4%
Residents with income below 50% of the poverty level in 2022:
This zip code:
3.3%
Whole state:
6.9%
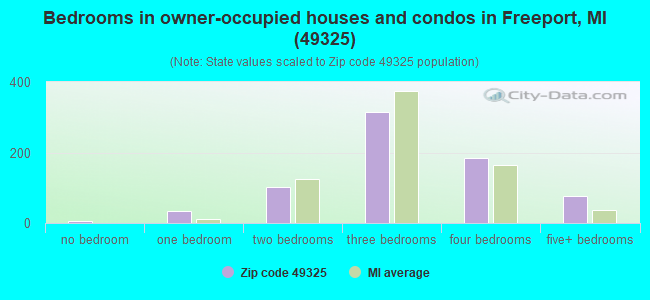
Median number of rooms in houses and condos:
Here:
7.1
State:
6.5
Median number of rooms in apartments:
Here:
6.4
State:
4.3
Notable locations in this zip code not listed on our city pages
Notable locations in zip code 49325: Freeport District Library (A), Freeport Area Volunteer Fire Department (B), Freeport Village Hall (C), Freeport Police Department (D). Display/hide their locations on the map
Churches in zip code 49325 include: Hope Church (A), Freeport United Brethren Church (B), Freeport United Methodist Church (C). Display/hide their locations on the map
Lakes: Logan Lake (A), Lawhead Lake (B), Huckleberry Lake (C), Scott Lake (D), Bullhead Lake (E), Sugarbush Lake (F). Display/hide their locations on the map
In group quarters: 9 (-1 institutionalized population)
Size of family households: 221 2-persons, 93 3-persons, 97 4-persons, 52 5-persons, 116 6-persons, 7 7-or-more-persons
Size of nonfamily households: 154 1-person, 32 2-persons, 4 4-persons
719 married couples with children.
77 single-parent households (29 men, 48 women).
97.0% of residents of 49325 zip code speak English at home.
1.5% of residents speak Spanish at home (77% very well, 23% well).
0.7% of residents speak other Indo-European language at home (60% very well, 7% well, 33% not well).
Foreign born population: 6 (0.2%) (100.0% of them are naturalized citizens)
This zip code:
0.2%
Whole state:
6.9%
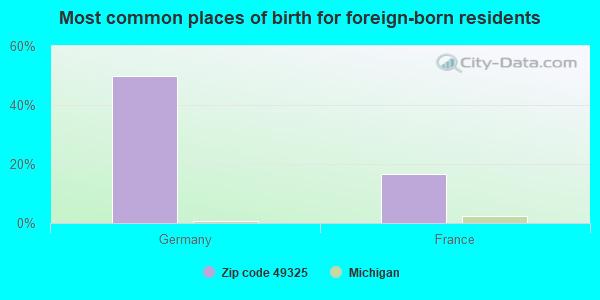
50%Germany
17%France
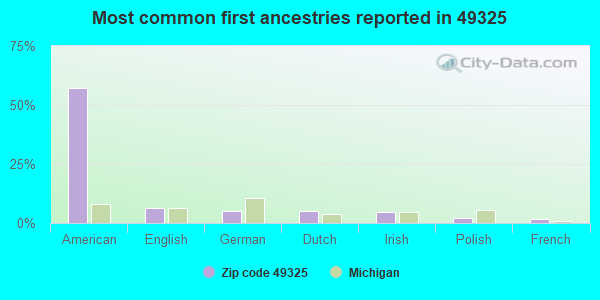
57%American
6%English
5%German
5%Dutch
4%Irish
2%Polish
2%French
Year of entry for the foreign-born population
02010 or later
02000 to 2009
11990 to 1999
4Before 1990
Facilities with environmental interests located in this zip code:
FREEPORT DAIRY LLC (10560 FREEP0RT AVE in FREEPORT, MI)
National Pollutant Discharge Elimination System NON-MAJOR (Tracking pollutant discharge elimination systems) - permit Business SIC classification: DAIRY FARMS Alternative names: FREEPORT DAIRY-CAFO
FREEPORT AUTO (238 COUNTY LINE in FREEPORT, MI)
(Resource Conservation and Recovery Act (tracking hazardous waste))
FREEPORT FRAME AND COLLISION (10900 FREEPORT AVE in FREEPORT, MI)
Conditionally Exempt Small Quantity Generators, less than 100 kg/month of hazardous waste (Resource Conservation and Recovery Act (tracking hazardous waste)) Organizations: HUBERT PORRITT (CONTACT/OPERATOR)
Housing units lacking complete kitchen facilities: 0.4%
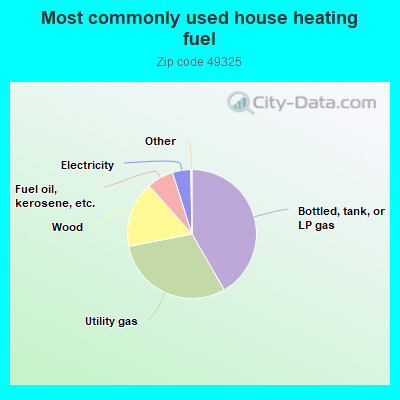
41.9%Bottled, tank, or LP gas
30.4%Utility gas
16.6%Wood
6.7%Fuel oil, kerosene, etc.
4.6%Electricity
Population in 1990: 1,546. Population change in the 1990s: +96 (+6.2%).
Place of birth for U.S.-born residents:
This state: 2,322
Northeast: 19
Midwest: 64
South: 20
West: 35
63% of the 49325 zip code residents lived in the same house 5 years ago. Out of people who lived in different houses, 51% lived in this county. Out of people who lived in different counties, 50% lived in Michigan.
94% of the 49325 zip code residents lived in the same house 1 year ago. Out of people who lived in different houses, 18% moved from this county. Out of people who lived in different houses, 58% moved from different county within same state. Out of people who lived in different houses, 27% moved from different state.
Private vs. public school enrollment:
Students in private schools in grades 1 to 8 (elementary and middle school):
Here:
0.0%
Michigan:
12.4%
Students in private schools in grades 9 to 12 (high school): 4
Here:
4.5%
Michigan:
9.8%
Students in private undergraduate colleges:
Here:
0.0%
Michigan:
14.9%
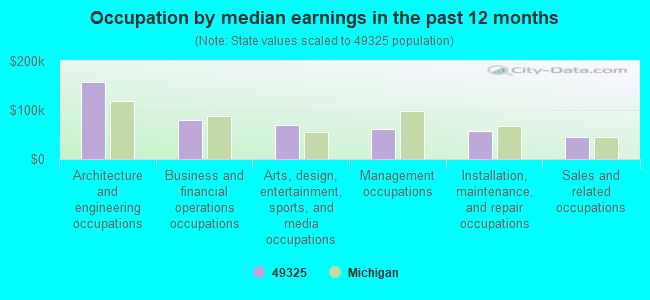
Occupation by median earnings in the past 12 months ($)
156,474Architecture and engineering occupations
80,195Business and financial operations occupations
69,589Arts, design, entertainment, sports, and media occupations
61,687Management occupations
57,471Installation, maintenance, and repair occupations
45,525Sales and related occupations
Top industries in this zip code by the number of employees in 2005:
Accommodation and Food Services: Limited-Service Restaurants (20-49 employees: 1 establishment)
Construction: Poured Concrete Foundation and Structure Contractors (5-9: 1)
Accommodation and Food Services: Full-Service Restaurants (5-9: 1)
People in group quarters in 2010:
10 people in group homes intended for adults
People in group quarters in 2000:
6 people in other group homes
Fatal accident statistics in 2013:
Fatal accident count: 2
Vehicles involved in fatal accidents: 3
Fatal accidents caused by drunken drivers: 1
Fatalities: 2
Persons involved in fatal accidents: 7
Pedestrians involved in fatal accidents: 0
Fatal accident statistics in 2012:
Fatal accident count: 1
Vehicles involved in fatal accidents: 2
Fatal accidents caused by drunken drivers: 0
Fatalities: 1
Persons involved in fatal accidents: 3
Pedestrians involved in fatal accidents: 0
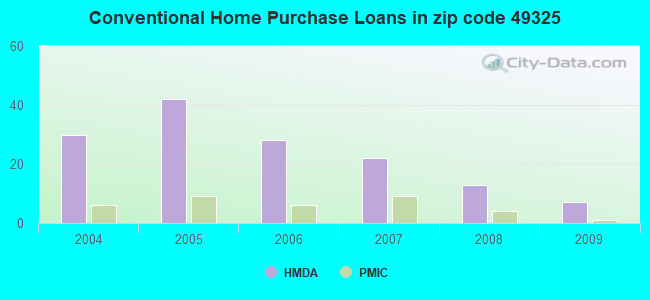
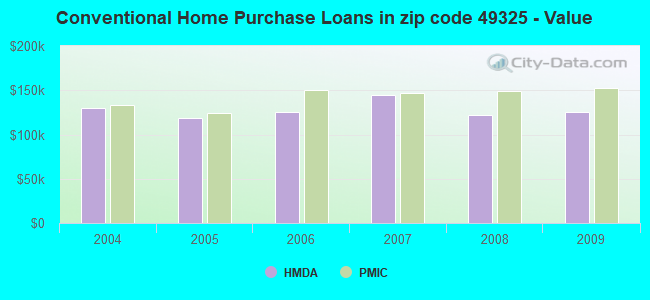
Home Mortgage Disclosure Act Aggregated Statistics For Year 2009 (Based on 2 partial tracts)
A) FHA, FSA/RHS & VA Home Purchase Loans
B) Conventional Home Purchase Loans
C) Refinancings
D) Home Improvement Loans
F) Non-occupant Loans on < 5 Family Dwellings (A B C & D)
G) Loans On Manufactured Home Dwelling (A B C & D)
Number
Average Value
Number
Average Value
Number
Average Value
Number
Average Value
Number
Average Value
Number
Average Value
LOANS ORIGINATED
11
$103,136
7
$125,569
59
$120,115
3
$23,110
2
$179,760
2
$73,040
APPLICATIONS APPROVED, NOT ACCEPTED
0
$0
0
$0
7
$124,224
0
$0
0
$0
0
$0
APPLICATIONS DENIED
2
$95,325
3
$107,623
27
$131,265
1
$91,120
2
$97,060
5
$108,746
APPLICATIONS WITHDRAWN
1
$178,270
0
$0
18
$140,004
0
$0
0
$0
0
$0
FILES CLOSED FOR INCOMPLETENESS
0
$0
0
$0
1
$117,360
0
$0
0
$0
0
$0
Aggregated Statistics For Year 2008 (Based on 2 partial tracts)
A) FHA, FSA/RHS & VA Home Purchase Loans
B) Conventional Home Purchase Loans
C) Refinancings
D) Home Improvement Loans
F) Non-occupant Loans on < 5 Family Dwellings (A B C & D)
G) Loans On Manufactured Home Dwelling (A B C & D)
Number
Average Value
Number
Average Value
Number
Average Value
Number
Average Value
Number
Average Value
Number
Average Value
LOANS ORIGINATED
6
$130,073
13
$122,543
39
$114,874
6
$19,478
3
$105,643
3
$75,930
APPLICATIONS APPROVED, NOT ACCEPTED
1
$130,240
0
$0
6
$147,817
0
$0
0
$0
1
$105,480
APPLICATIONS DENIED
2
$107,955
4
$121,572
31
$145,924
3
$42,917
0
$0
3
$107,623
APPLICATIONS WITHDRAWN
0
$0
1
$187,190
11
$115,066
1
$18,820
0
$0
0
$0
FILES CLOSED FOR INCOMPLETENESS
0
$0
0
$0
3
$144,267
0
$0
0
$0
0
$0
Aggregated Statistics For Year 2007 (Based on 2 partial tracts)
A) FHA, FSA/RHS & VA Home Purchase Loans
B) Conventional Home Purchase Loans
C) Refinancings
D) Home Improvement Loans
F) Non-occupant Loans on < 5 Family Dwellings (A B C & D)
G) Loans On Manufactured Home Dwelling (A B C & D)
Number
Average Value
Number
Average Value
Number
Average Value
Number
Average Value
Number
Average Value
Number
Average Value
LOANS ORIGINATED
4
$139,648
22
$144,711
58
$114,946
14
$25,998
3
$153,513
7
$83,336
APPLICATIONS APPROVED, NOT ACCEPTED
0
$0
1
$125,290
16
$110,491
0
$0
0
$0
0
$0
APPLICATIONS DENIED
0
$0
4
$152,275
38
$137,822
7
$39,687
2
$112,660
3
$94,583
APPLICATIONS WITHDRAWN
1
$135,190
1
$202,040
12
$137,088
0
$0
0
$0
1
$98,050
FILES CLOSED FOR INCOMPLETENESS
0
$0
0
$0
4
$164,160
0
$0
0
$0
0
$0
Aggregated Statistics For Year 2006 (Based on 2 partial tracts)
A) FHA, FSA/RHS & VA Home Purchase Loans
B) Conventional Home Purchase Loans
C) Refinancings
D) Home Improvement Loans
F) Non-occupant Loans on < 5 Family Dwellings (A B C & D)
G) Loans On Manufactured Home Dwelling (A B C & D)
Number
Average Value
Number
Average Value
Number
Average Value
Number
Average Value
Number
Average Value
Number
Average Value
LOANS ORIGINATED
1
$178,770
28
$125,480
60
$108,622
11
$36,060
5
$91,018
4
$61,158
APPLICATIONS APPROVED, NOT ACCEPTED
0
$0
7
$106,539
8
$108,944
1
$101,520
0
$0
0
$0
APPLICATIONS DENIED
0
$0
9
$119,178
42
$138,668
6
$81,873
1
$212,940
3
$79,727
APPLICATIONS WITHDRAWN
0
$0
1
$96,070
20
$137,492
1
$204,020
0
$0
0
$0
FILES CLOSED FOR INCOMPLETENESS
0
$0
1
$103,990
9
$124,020
0
$0
0
$0
0
$0
Aggregated Statistics For Year 2005 (Based on 2 partial tracts)
A) FHA, FSA/RHS & VA Home Purchase Loans
B) Conventional Home Purchase Loans
C) Refinancings
D) Home Improvement Loans
F) Non-occupant Loans on < 5 Family Dwellings (A B C & D)
G) Loans On Manufactured Home Dwelling (A B C & D)
Number
Average Value
Number
Average Value
Number
Average Value
Number
Average Value
Number
Average Value
Number
Average Value
LOANS ORIGINATED
5
$125,186
42
$118,990
94
$119,517
15
$47,044
7
$96,776
8
$89,260
APPLICATIONS APPROVED, NOT ACCEPTED
0
$0
2
$150,045
18
$125,341
1
$13,370
0
$0
1
$84,680
APPLICATIONS DENIED
0
$0
8
$134,075
60
$131,591
9
$47,264
1
$147,070
5
$78,836
APPLICATIONS WITHDRAWN
0
$0
3
$149,717
47
$138,498
3
$71,640
2
$111,670
3
$115,050
FILES CLOSED FOR INCOMPLETENESS
0
$0
0
$0
13
$136,561
1
$39,620
0
$0
0
$0
Aggregated Statistics For Year 2004 (Based on 2 partial tracts)
A) FHA, FSA/RHS & VA Home Purchase Loans
B) Conventional Home Purchase Loans
C) Refinancings
D) Home Improvement Loans
F) Non-occupant Loans on < 5 Family Dwellings (A B C & D)
G) Loans On Manufactured Home Dwelling (A B C & D)
Detailed PMIC statistics for the following Tracts:0102.00
2002 - 2018 National Fire Incident Reporting System (NFIRS) incidents
According to the data from the years 2002 - 2018 the average number of fires per year is 13. The highest number of fire incidents - 29 took place in 2009, and the least - 0 in 2011. The data has a declining trend.
When looking into fire subcategories, the most incidents belonged to: Structure Fires (48.0%), and Outside Fires (35.8%).
Fire incident types reported to NFIRS in Zip Code 49325


 Nearest zip codes: 48815, 49302, 49058, 49333, 48897, 48849.
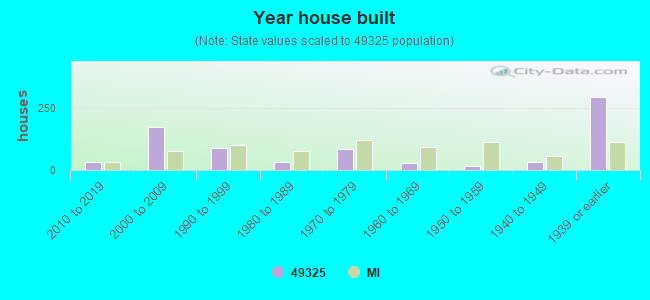


 According to the data from the years 2002 - 2018 the average number of fires per year is 13. The highest number of fire incidents - 29 took place in 2009, and the least - 0 in 2011. The data has a declining trend.
 When looking into fire subcategories, the most incidents belonged to: Structure Fires (48.0%), and Outside Fires (35.8%).