Estimated zip code population in 2022: 1,322 Zip code population in 2010: 1,398 Zip code population in 2000: 1,460
Houses and condos: 504 Renter-occupied apartments: 63
% of renters here:
13%
State:
27%
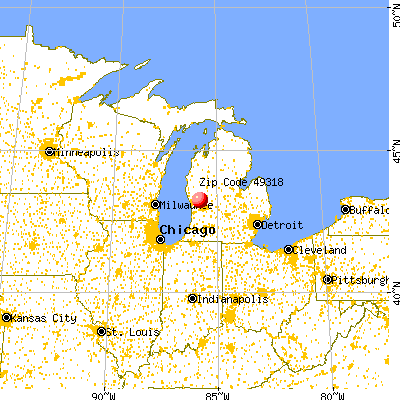
March 2022 cost of living index in zip code 49318: 82.7 (low, U.S. average is 100)
Land area: 17.8 sq. mi. Water area: 0.2 sq. mi.
Population density: 74 people per square mile
(very low).
OSM Map
General Map
Google Map
MSN Map
OSM Map
General Map
Google Map
MSN Map
OSM Map
General Map
Google Map
MSN Map
OSM Map
General Map
Google Map
MSN Map
Please wait while loading the map...
Real estate property taxes paid for housing units in 2022:
This zip code:
1.0% ($2,380)
Michigan:
1.2% ($2,746)
Median real estate property taxes paid for housing units with mortgages in 2022: $2,400 (1.0%) Median real estate property taxes paid for housing units with no mortgage in 2022: $2,366 (1.0%)
Business Search- 14 Million verified businesses
Males: 745
(56.4%)
Females: 576
(43.6%)
For population 25 years and over in 49318:
High school or higher: 92.2%
Bachelor's degree or higher: 18.3%
Graduate or professional degree: 5.1%
Unemployed: 3.1%
Mean travel time to work (commute): 28.1 minutes
For population 15 years and over in 49318:
Never married: 26.5%
Now married: 56.9%
Separated: 0.5%
Widowed: 6.7%
Divorced: 9.4%
Zip code 49318 compared to state average:
Black race population percentage significantly below state average.
Foreign-born population percentage below state average.
Renting percentage below state average.
Length of stay since moving in significantly above state average.
Number of college students below state average.
Percentage of population with a bachelor's degree or higher below state average.
Averages for the 2020 tax year for zip code 49318, filed in 2021:
Average Adjusted Gross Income (AGI) in 2020: $57,625 (Individual Income Tax Returns)
Here:
$57,625
State:
$68,945
Salary/wage: $50,791 (reported on 79.5% of returns)
Here:
$50,791
State:
$57,142
(% of AGI for various income ranges: 1457.1% for AGIs below $25k, 3493.1% for AGIs $25k-50k, 6045.0% for AGIs $50k-75k, 11170.0% for AGIs $75k-100k, 17000.0% for AGIs $100k-200k)
Taxable interest for individuals: $1,395 (reported on 30.1% of returns)
This zip code:
$1,395
Michigan:
$1,630
(% of AGI for various income ranges: 5.7% for AGIs below $25k, 30.0% for AGIs $25k-50k, 30.0% for AGIs $50k-75k, 12.0% for AGIs $75k-100k, 358.3% for AGIs $100k-200k)
Ordinary dividends: $5,709 (reported on 15.1% of returns)
Here:
$5,709
State:
$6,972
(% of AGI for various income ranges: 48.6% for AGIs below $25k, 44.4% for AGIs $25k-50k, 86.0% for AGIs $50k-75k, 671.7% for AGIs $100k-200k)
Net capital gain/loss in AGI: +$7,433 (reported on 12.3% of returns)
Here:
+$7,433
State:
+$20,064
(% of AGI for various income ranges: 10.7% for AGIs below $25k, 87.0% for AGIs $50k-75k, 945.0% for AGIs $100k-200k)
Profit/loss from business: +$5,988 (reported on 11.0% of returns)
Here:
+$5,988
State:
+$11,172
(% of AGI for various income ranges: 83.6% for AGIs below $25k, 154.4% for AGIs $25k-50k, 115.0% for AGIs $50k-75k)
Taxable individual retirement arrangement distribution: $11,271 (reported on 9.6% of returns)
49318:
$11,271
Michigan:
$19,803
(% of AGI for various income ranges: 225.7% for AGIs below $25k, 473.0% for AGIs $50k-75k)
Earned income credit: $2,144 (reported on 12.3% of returns)
Here:
$2,144
State:
$2,251
(% of AGI for various income ranges: 63.6% for AGIs below $25k, 65.0% for AGIs $25k-50k)
Percentage of individuals using paid preparers for their 2020 taxes: 91.8%
Here:
92%
State:
93%
(% for various income ranges: 90.9% for AGIs below $25k, 95.0% for AGIs $25k-50k, 92.3% for AGIs $50k-75k, 87.5% for AGIs $75k-100k, 90.0% for AGIs $100k-200k)
Averages for the 2012 tax year for zip code 49318, filed in 2013:
Average Adjusted Gross Income (AGI) in 2012: $46,176 (Individual Income Tax Returns)
Here:
$46,176
State:
$55,609
Salary/wage: $39,143 (reported on 85.3% of returns)
Here:
$39,143
State:
$46,782
(% of AGI for various income ranges: 74.8% for AGIs below $25k, 76.6% for AGIs $25k-50k, 86.6% for AGIs $50k-75k, 80.0% for AGIs $75k-100k, 55.4% for AGIs $100k-200k)
Taxable interest for individuals: $795 (reported on 29.4% of returns)
This zip code:
$795
Michigan:
$1,491
(% of AGI for various income ranges: 0.8% for AGIs below $25k, 1.1% for AGIs $25k-50k, 0.6% for AGIs $75k-100k, 0.2% for AGIs $100k-200k)
Ordinary dividends: $2,590 (reported on 14.7% of returns)
Here:
$2,590
State:
$6,225
(% of AGI for various income ranges: 2.3% for AGIs below $25k, 0.7% for AGIs $25k-50k, 2.7% for AGIs $75k-100k)
Net capital gain/loss in AGI: +$143 (reported on 10.3% of returns)
Here:
+$143
State:
+$9,326
Profit/loss from business: +$7,600 (reported on 13.2% of returns)
Here:
+$7,600
State:
+$11,523
(% of AGI for various income ranges: 6.9% for AGIs below $25k, 5.5% for AGIs $25k-50k, 1.4% for AGIs $50k-75k)
Taxable individual retirement arrangement distribution: $7,500 (reported on 10.3% of returns)
49318:
$7,500
Michigan:
$15,298
(% of AGI for various income ranges: 4.5% for AGIs below $25k, 3.4% for AGIs $25k-50k, 2.3% for AGIs $50k-75k)
Total itemized deductions: $17,671 (22% of AGI, reported on 25.0% of returns)
Here:
$17,671
State:
$21,628
Here:
21.7% of AGI
State:
18.4% of AGI
(% of AGI for various income ranges: 14.0% for AGIs $25k-50k, 8.3% for AGIs $50k-75k, 10.9% for AGIs $75k-100k, 9.8% for AGIs $100k-200k)
Charity contributions: $2,785 (reported on 19.1% of returns)
Here:
$2,785
State:
$4,225
(% of AGI for various income ranges: 1.3% for AGIs $25k-50k, 1.0% for AGIs $50k-75k, 1.7% for AGIs $75k-100k, 1.2% for AGIs $100k-200k)
Taxes paid: $6,659 (reported on 25.0% of returns)
49318:
$6,659
State:
$8,327
(% of AGI for various income ranges: 5.0% for AGIs $25k-50k, 2.4% for AGIs $50k-75k, 3.9% for AGIs $75k-100k, 4.5% for AGIs $100k-200k)
Earned income credit: $2,131 (reported on 19.1% of returns)
Here:
$2,131
State:
$2,306
(% of AGI for various income ranges: 5.8% for AGIs below $25k, 1.3% for AGIs $25k-50k)
Percentage of individuals using paid preparers for their 2012 taxes: 63.2%
Here:
63%
State:
57%
(% for various income ranges: 60.7% for AGIs below $25k, 66.7% for AGIs $25k-50k, 70.0% for AGIs $50k-75k, 50.0% for AGIs $75k-100k, 66.7% for AGIs $100k-200k)
Averages for the 2004 tax year for zip code 49318, filed in 2005:
Average Adjusted Gross Income (AGI) in 2004: $40,093 (Individual Income Tax Returns)
Here:
$40,093
State:
$48,204
Salary/wage: $35,755 (reported on 87.4% of returns)
Here:
$35,755
State:
$42,791
(% of AGI for various income ranges: 81.5% for AGIs below $10k, 75.2% for AGIs $10k-25k, 88.2% for AGIs $25k-50k, 86.1% for AGIs $50k-75k, 84.3% for AGIs $75k-100k, 50.7% for AGIs over 100k)
Taxable interest for individuals: $1,164 (reported on 42.3% of returns)
This zip code:
$1,164
Michigan:
$1,725
(% of AGI for various income ranges: 5.8% for AGIs below $10k, 1.6% for AGIs $10k-25k, 1.2% for AGIs $25k-50k, 1.1% for AGIs $50k-75k, 1.1% for AGIs $75k-100k, 0.8% for AGIs over 100k)
Taxable dividends: $1,787 (reported on 18.4% of returns)
Here:
$1,787
State:
$3,420
(% of AGI for various income ranges: 4.7% for AGIs below $10k, 1.8% for AGIs $10k-25k, 0.4% for AGIs $25k-50k, 0.7% for AGIs $50k-75k, 0.6% for AGIs $75k-100k, 0.8% for AGIs over 100k)
Net capital gain/loss: +$4,596 (reported on 14.3% of returns)
Here:
+$4,596
State:
+$8,532
(% of AGI for various income ranges: -1.0% for AGIs below $10k, 0.3% for AGIs $10k-25k, 0.9% for AGIs $25k-50k, 0.9% for AGIs $50k-75k, 0.9% for AGIs $75k-100k, 5.1% for AGIs over 100k)
Profit/loss from business: +$3,747 (reported on 11.4% of returns)
Here:
+$3,747
State:
+$9,547
(% of AGI for various income ranges: 8.8% for AGIs $10k-25k, 1.5% for AGIs $25k-50k, 1.1% for AGIs $50k-75k, -2.3% for AGIs $75k-100k)
IRA payment deduction: $2,938 (reported on 2.3% of returns)
49318:
$2,938
Michigan:
$2,875
Total itemized deductions: $14,541 (22% of AGI, reported on 32.1% of returns)
Here:
$14,541
State:
$18,509
Here:
22.2% of AGI
State:
20.7% of AGI
(% of AGI for various income ranges: 9.4% for AGIs $10k-25k, 11.6% for AGIs $25k-50k, 12.7% for AGIs $50k-75k, 15.3% for AGIs $75k-100k, 9.5% for AGIs over 100k)
Charity contributions deductions: $2,589 (4% of AGI, reported on 26.8% of returns)
Here:
$2,589
State:
$3,365
Here:
3.8% of AGI
State:
3.6% of AGI
(% of AGI for various income ranges: 0.9% for AGIs $10k-25k, 1.0% for AGIs $25k-50k, 2.0% for AGIs $50k-75k, 2.4% for AGIs $75k-100k, 2.1% for AGIs over 100k)
Total tax: $4,277 (reported on 73.2% of returns)
49318:
$4,277
State:
$7,691
(% of AGI for various income ranges: 3.4% for AGIs below $10k, 4.1% for AGIs $10k-25k, 6.1% for AGIs $25k-50k, 8.2% for AGIs $50k-75k, 9.3% for AGIs $75k-100k, 10.1% for AGIs over 100k)
Earned income credit: $1,971 (reported on 10.0% of returns)
Here:
$1,971
State:
$1,737
Percentage of individuals using paid preparers for their 2004 taxes: 64.5%
Here:
65%
State:
60%
(% for various income ranges: 56.1% for AGIs below $10k, 68.2% for AGIs $10k-25k, 66.3% for AGIs $25k-50k, 68.3% for AGIs $50k-75k, 59.6% for AGIs $75k-100k, 72.7% for AGIs over 100k)
Household received Food Stamps/SNAP in the past 12 months: 26 Household did not receive Food Stamps/SNAP in the past 12 months: 456
Women who had a birth in the past 12 months: 14 (12 now married, 1 unmarried) Women who did not have a birth in the past 12 months: 213 (120 now married, 92 unmarried)
Housing units in zip code 49318 with a mortgage: 196 (39 second mortgage, 2 home equity loan, 21 both second mortgage and home equity loan) Houses without a mortgage: 5
Median monthly owner costs for units with a mortgage: $1,415 Median monthly owner costs for units without a mortgage: $589
Residents with income below the poverty level in 2022:
This zip code:
10.9%
Whole state:
13.4%
Residents with income below 50% of the poverty level in 2022:
This zip code:
4.1%
Whole state:
6.9%
Median number of rooms in houses and condos:
Here:
6.4
State:
6.5
Median number of rooms in apartments:
Here:
4.3
State:
4.3
Notable locations in this zip code not listed on our city pages
214 married couples with children.
28 single-parent households (7 men, 21 women).
92.4% of residents of 49318 zip code speak English at home.
7.0% of residents speak Spanish at home (76% very well, 9% well, 7% not well, 7% not at all).
0.4% of residents speak Asian or Pacific Island language at home (100% very well).
Foreign born population: 57 (4.3%) (26.9% of them are naturalized citizens)
This zip code:
4.3%
Whole state:
6.9%
48%Honduras
38%Bhutan
9%Malaysia
15%German
10%American
9%Dutch
8%Swedish
8%Irish
7%European
7%English
Year of entry for the foreign-born population
272010 or later
42000 to 2009
91990 to 1999
20Before 1990
Facilities with environmental interests located in this zip code:
FINLEYS SUNOCO SERVICE STATION (17984 APPLE in CASNOVIA, MI)
(Resource Conservation and Recovery Act (tracking hazardous waste))
Housing units lacking complete kitchen facilities: 0.3%
41.6%Utility gas
29.4%Bottled, tank, or LP gas
12.9%Wood
11.6%Fuel oil, kerosene, etc.
3.2%Electricity
1.9%Other fuel
Population in 1990: 1,283. Population change in the 1990s: +177 (+13.8%).
Place of birth for U.S.-born residents:
This state: 1,165
Northeast: 5
Midwest: 24
South: 26
West: 37
73% of the 49318 zip code residents lived in the same house 5 years ago. Out of people who lived in different houses, 40% lived in this county. Out of people who lived in different counties, 50% lived in Michigan.
85% of the 49318 zip code residents lived in the same house 1 year ago. Out of people who lived in different houses, 23% moved from this county. Out of people who lived in different houses, 64% moved from different county within same state. Out of people who lived in different houses, 10% moved from different state.
Private vs. public school enrollment:
Students in private schools in grades 1 to 8 (elementary and middle school): 40
Here:
27.1%
Michigan:
12.4%
Students in private schools in grades 9 to 12 (high school):
Here:
0.0%
Michigan:
9.8%
Students in private undergraduate colleges:
Here:
0.0%
Michigan:
14.9%
Occupation by median earnings in the past 12 months ($)
116,144Health diagnosing and treating practitioners and other technical occupations
80,773Arts, design, entertainment, sports, and media occupations
70,112Installation, maintenance, and repair occupations
58,974Production occupations
57,412Business and financial operations occupations
56,054Management occupations
Top industries in this zip code by the number of employees in 2005:
Accommodation and Food Services: Full-Service Restaurants (10-19 employees: 1 establishment)
Other Services (except Public Administration): Commercial and Industrial Machinery and Equipment (except Automotive and Electronic) Repair and Maintenance (5-9: 1)
Finance and Insurance: Insurance Agencies and Brokerages (5-9: 1)
Construction: Site Preparation Contractors (5-9: 1)
Wholesale Trade: Farm and Garden Machinery and Equipment Merchant Wholesalers (5-9: 1)
Administrative and Support and Waste Management and Remediation Services: Landscaping Services (5-9: 1)
Construction: Plumbing, Heating, and Air-Conditioning Contractors (5-9: 1)
Professional, Scientific, and Technical Services: Environmental Consulting Services (5-9: 1)
People in group quarters in 2010:
21 people in workers' group living quarters and job corps centers
People in group quarters in 2000:
29 people in agriculture workers' dormitories on farms
3 people in unknown juvenile institutions
Fatal accident statistics in 2014:
Fatal accident count: 2
Vehicles involved in fatal accidents: 3
Fatal accidents caused by drunken drivers: 0
Fatalities: 5
Persons involved in fatal accidents: 10
Pedestrians involved in fatal accidents: 0
Fatal accident statistics in 2013:
Fatal accident count: 1
Vehicles involved in fatal accidents: 4
Fatal accidents caused by drunken drivers: 0
Fatalities: 1
Persons involved in fatal accidents: 5
Pedestrians involved in fatal accidents: 0
Home Mortgage Disclosure Act Aggregated Statistics For Year 2009 (Based on 4 partial tracts)
A) FHA, FSA/RHS & VA Home Purchase Loans
B) Conventional Home Purchase Loans
C) Refinancings
D) Home Improvement Loans
F) Non-occupant Loans on < 5 Family Dwellings (A B C & D)
G) Loans On Manufactured Home Dwelling (A B C & D)
Number
Average Value
Number
Average Value
Number
Average Value
Number
Average Value
Number
Average Value
Number
Average Value
LOANS ORIGINATED
7
$91,736
3
$87,817
36
$120,113
1
$39,230
1
$51,500
5
$63,246
APPLICATIONS APPROVED, NOT ACCEPTED
1
$81,560
0
$0
4
$117,410
1
$11,080
0
$0
1
$68,470
APPLICATIONS DENIED
1
$125,890
2
$53,890
16
$136,333
0
$0
0
$0
2
$76,575
APPLICATIONS WITHDRAWN
1
$73,850
0
$0
11
$128,595
0
$0
0
$0
0
$0
FILES CLOSED FOR INCOMPLETENESS
1
$90,460
0
$0
3
$116,933
0
$0
0
$0
1
$75,140
Aggregated Statistics For Year 2008 (Based on 4 partial tracts)
A) FHA, FSA/RHS & VA Home Purchase Loans
B) Conventional Home Purchase Loans
C) Refinancings
D) Home Improvement Loans
F) Non-occupant Loans on < 5 Family Dwellings (A B C & D)
G) Loans On Manufactured Home Dwelling (A B C & D)
Number
Average Value
Number
Average Value
Number
Average Value
Number
Average Value
Number
Average Value
Number
Average Value
LOANS ORIGINATED
4
$108,520
9
$104,347
32
$109,266
5
$30,256
2
$55,000
8
$74,419
APPLICATIONS APPROVED, NOT ACCEPTED
0
$0
3
$69,130
6
$113,578
0
$0
0
$0
3
$63,323
APPLICATIONS DENIED
2
$102,720
3
$106,933
26
$106,825
3
$40,170
1
$89,440
8
$71,774
APPLICATIONS WITHDRAWN
0
$0
1
$15,630
12
$132,858
1
$13,820
0
$0
1
$89,200
FILES CLOSED FOR INCOMPLETENESS
0
$0
1
$61,980
3
$200,697
0
$0
0
$0
0
$0
Aggregated Statistics For Year 2007 (Based on 4 partial tracts)
A) FHA, FSA/RHS & VA Home Purchase Loans
B) Conventional Home Purchase Loans
C) Refinancings
D) Home Improvement Loans
F) Non-occupant Loans on < 5 Family Dwellings (A B C & D)
G) Loans On Manufactured Home Dwelling (A B C & D)
Number
Average Value
Number
Average Value
Number
Average Value
Number
Average Value
Number
Average Value
Number
Average Value
LOANS ORIGINATED
3
$109,720
18
$104,117
53
$105,616
8
$29,616
6
$73,183
12
$76,665
APPLICATIONS APPROVED, NOT ACCEPTED
0
$0
3
$89,897
8
$120,246
3
$26,690
1
$71,190
3
$71,027
APPLICATIONS DENIED
0
$0
7
$74,267
38
$97,003
7
$57,310
1
$145,740
13
$68,439
APPLICATIONS WITHDRAWN
1
$74,970
2
$99,950
10
$112,802
0
$0
0
$0
3
$105,133
FILES CLOSED FOR INCOMPLETENESS
0
$0
0
$0
5
$122,772
0
$0
0
$0
0
$0
Aggregated Statistics For Year 2006 (Based on 4 partial tracts)
A) FHA, FSA/RHS & VA Home Purchase Loans
B) Conventional Home Purchase Loans
C) Refinancings
D) Home Improvement Loans
F) Non-occupant Loans on < 5 Family Dwellings (A B C & D)
G) Loans On Manufactured Home Dwelling (A B C & D)
Number
Average Value
Number
Average Value
Number
Average Value
Number
Average Value
Number
Average Value
Number
Average Value
LOANS ORIGINATED
1
$175,720
20
$109,130
42
$101,293
8
$34,700
2
$83,870
8
$63,601
APPLICATIONS APPROVED, NOT ACCEPTED
0
$0
1
$69,500
8
$80,259
2
$14,810
0
$0
1
$114,330
APPLICATIONS DENIED
1
$146,690
6
$74,063
45
$104,776
6
$38,043
0
$0
10
$65,736
APPLICATIONS WITHDRAWN
0
$0
2
$88,555
21
$111,690
1
$53,110
1
$75,670
2
$59,940
FILES CLOSED FOR INCOMPLETENESS
0
$0
0
$0
6
$118,453
0
$0
0
$0
0
$0
Aggregated Statistics For Year 2005 (Based on 4 partial tracts)
A) FHA, FSA/RHS & VA Home Purchase Loans
B) Conventional Home Purchase Loans
C) Refinancings
D) Home Improvement Loans
F) Non-occupant Loans on < 5 Family Dwellings (A B C & D)
G) Loans On Manufactured Home Dwelling (A B C & D)
Number
Average Value
Number
Average Value
Number
Average Value
Number
Average Value
Number
Average Value
Number
Average Value
LOANS ORIGINATED
3
$101,560
25
$114,520
63
$105,867
10
$22,874
3
$85,413
11
$79,466
APPLICATIONS APPROVED, NOT ACCEPTED
0
$0
4
$98,470
10
$123,680
1
$86,890
0
$0
1
$125,020
APPLICATIONS DENIED
1
$108,490
9
$96,136
52
$118,190
8
$24,546
2
$64,170
11
$89,618
APPLICATIONS WITHDRAWN
0
$0
2
$184,860
35
$129,205
1
$80,490
0
$0
4
$123,122
FILES CLOSED FOR INCOMPLETENESS
0
$0
3
$70,273
6
$99,187
1
$36,440
0
$0
0
$0
Aggregated Statistics For Year 2004 (Based on 4 partial tracts)
A) FHA, FSA/RHS & VA Home Purchase Loans
B) Conventional Home Purchase Loans
C) Refinancings
D) Home Improvement Loans
F) Non-occupant Loans on < 5 Family Dwellings (A B C & D)
G) Loans On Manufactured Home Dwelling (A B C & D)
Number
Average Value
Number
Average Value
Number
Average Value
Number
Average Value
Number
Average Value
Number
Average Value
LOANS ORIGINATED
6
$96,500
24
$110,610
66
$102,476
11
$35,948
2
$96,195
14
$80,520
APPLICATIONS APPROVED, NOT ACCEPTED
0
$0
5
$97,336
14
$126,179
1
$44,330
2
$86,385
2
$89,360
APPLICATIONS DENIED
2
$99,940
7
$106,531
43
$107,295
7
$39,554
1
$5,070
10
$85,780
APPLICATIONS WITHDRAWN
1
$90,380
3
$134,873
19
$108,274
1
$22,600
0
$0
3
$89,033
FILES CLOSED FOR INCOMPLETENESS
0
$0
1
$111,250
9
$126,953
0
$0
0
$0
2
$97,280
Aggregated Statistics For Year 2003 (Based on 4 partial tracts)
A) FHA, FSA/RHS & VA Home Purchase Loans
B) Conventional Home Purchase Loans
C) Refinancings
D) Home Improvement Loans
F) Non-occupant Loans on < 5 Family Dwellings (A B C & D)
Number
Average Value
Number
Average Value
Number
Average Value
Number
Average Value
Number
Average Value
LOANS ORIGINATED
3
$108,473
18
$105,134
124
$101,146
5
$26,872
3
$84,443
APPLICATIONS APPROVED, NOT ACCEPTED
1
$85,020
4
$88,900
15
$116,857
2
$19,685
2
$87,000
APPLICATIONS DENIED
0
$0
6
$72,022
58
$101,072
4
$21,538
1
$113,220
APPLICATIONS WITHDRAWN
1
$85,610
3
$86,793
19
$96,062
0
$0
0
$0
FILES CLOSED FOR INCOMPLETENESS
1
$122,710
0
$0
7
$95,663
0
$0
0
$0
Aggregated Statistics For Year 2002 (Based on 4 partial tracts)
A) FHA, FSA/RHS & VA Home Purchase Loans
B) Conventional Home Purchase Loans
C) Refinancings
D) Home Improvement Loans
F) Non-occupant Loans on < 5 Family Dwellings (A B C & D)
Number
Average Value
Number
Average Value
Number
Average Value
Number
Average Value
Number
Average Value
LOANS ORIGINATED
2
$90,620
21
$99,747
93
$96,509
4
$44,495
3
$75,777
APPLICATIONS APPROVED, NOT ACCEPTED
0
$0
3
$113,060
18
$111,311
0
$0
0
$0
APPLICATIONS DENIED
0
$0
7
$64,263
40
$92,069
3
$28,053
0
$0
APPLICATIONS WITHDRAWN
1
$103,170
2
$76,910
19
$98,987
1
$71,870
0
$0
FILES CLOSED FOR INCOMPLETENESS
0
$0
1
$39,870
5
$101,914
0
$0
1
$129,830
Aggregated Statistics For Year 2001 (Based on 4 partial tracts)
A) FHA, FSA/RHS & VA Home Purchase Loans
B) Conventional Home Purchase Loans
C) Refinancings
D) Home Improvement Loans
F) Non-occupant Loans on < 5 Family Dwellings (A B C & D)
Number
Average Value
Number
Average Value
Number
Average Value
Number
Average Value
Number
Average Value
LOANS ORIGINATED
4
$105,290
16
$103,242
73
$95,224
12
$17,503
2
$73,255
APPLICATIONS APPROVED, NOT ACCEPTED
2
$79,615
3
$58,567
12
$97,511
2
$10,535
0
$0
APPLICATIONS DENIED
0
$0
9
$61,256
42
$86,733
7
$16,914
1
$71,200
APPLICATIONS WITHDRAWN
0
$0
1
$53,640
17
$80,651
1
$37,590
1
$25,130
FILES CLOSED FOR INCOMPLETENESS
0
$0
0
$0
5
$74,510
0
$0
0
$0
Aggregated Statistics For Year 2000 (Based on 4 partial tracts)
A) FHA, FSA/RHS & VA Home Purchase Loans
B) Conventional Home Purchase Loans
C) Refinancings
D) Home Improvement Loans
F) Non-occupant Loans on < 5 Family Dwellings (A B C & D)
Number
Average Value
Number
Average Value
Number
Average Value
Number
Average Value
Number
Average Value
LOANS ORIGINATED
4
$87,460
18
$85,414
35
$68,719
10
$17,139
1
$57,040
APPLICATIONS APPROVED, NOT ACCEPTED
0
$0
4
$90,342
9
$71,921
3
$20,483
0
$0
APPLICATIONS DENIED
1
$95,010
12
$49,867
30
$64,859
11
$12,969
1
$30,310
APPLICATIONS WITHDRAWN
1
$59,470
3
$103,260
14
$68,246
0
$0
0
$0
FILES CLOSED FOR INCOMPLETENESS
0
$0
0
$0
1
$85,590
0
$0
0
$0
Aggregated Statistics For Year 1999 (Based on 2 partial tracts)
A) FHA, FSA/RHS & VA Home Purchase Loans
B) Conventional Home Purchase Loans
C) Refinancings
D) Home Improvement Loans
F) Non-occupant Loans on < 5 Family Dwellings (A B C & D)
Detailed PMIC statistics for the following Tracts:0030.00
, 0201.00
2002 - 2018 National Fire Incident Reporting System (NFIRS) incidents
According to the data from the years 2002 - 2018 the average number of fire incidents per year is 12. The highest number of fires - 27 took place in 2013, and the least - 1 in 2007. The data has an increasing trend.
When looking into fire subcategories, the most reports belonged to: Structure Fires (56.7%), and Outside Fires (22.2%).
Fire incident types reported to NFIRS in Zip Code 49318


 Nearest zip codes: 49303, 49330, 49403, 49327, 49345, 49451.


 According to the data from the years 2002 - 2018 the average number of fire incidents per year is 12. The highest number of fires - 27 took place in 2013, and the least - 1 in 2007. The data has an increasing trend.
 When looking into fire subcategories, the most reports belonged to: Structure Fires (56.7%), and Outside Fires (22.2%).