Estimated zip code population in 2022: 4,603 Zip code population in 2010: 4,328 Zip code population in 2000: 4,551
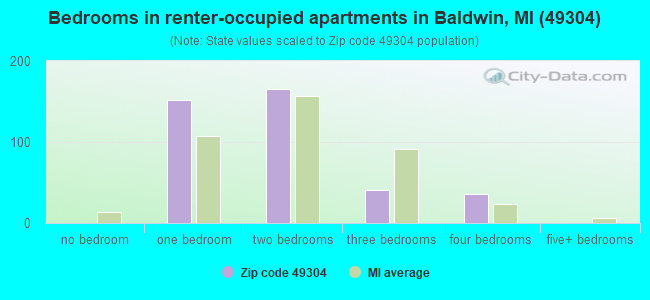
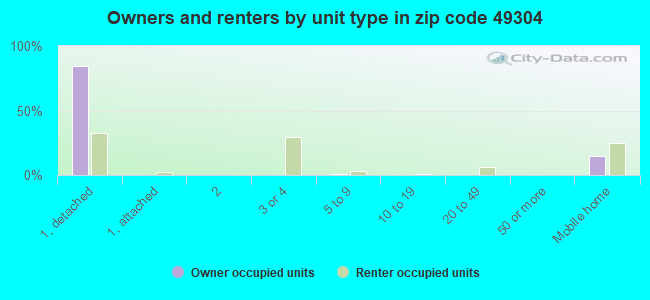
Houses and condos: 5,811 Renter-occupied apartments: 388
% of renters here:
23%
State:
27%
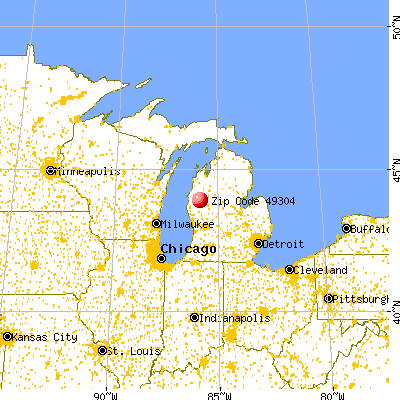
March 2022 cost of living index in zip code 49304: 81.4 (low, U.S. average is 100)
Land area: 129.2 sq. mi. Water area: 3.7 sq. mi.
Population density: 36 people per square mile
(very low).
OSM Map
General Map
Google Map
MSN Map
OSM Map
General Map
Google Map
MSN Map
OSM Map
General Map
Google Map
MSN Map
OSM Map
General Map
Google Map
MSN Map
Please wait while loading the map...
Real estate property taxes paid for housing units in 2022:
This zip code:
1.2% ($1,386)
Michigan:
1.2% ($2,746)
Median real estate property taxes paid for housing units with mortgages in 2022: $1,661 (1.2%) Median real estate property taxes paid for housing units with no mortgage in 2022: $1,151 (1.2%)
Averages for the 2020 tax year for zip code 49304, filed in 2021:
Average Adjusted Gross Income (AGI) in 2020: $42,507 (Individual Income Tax Returns)
Here:
$42,507
State:
$68,945
Salary/wage: $32,487 (reported on 66.3% of returns)
Here:
$32,487
State:
$57,142
(% of AGI for various income ranges: 781.5% for AGIs below $25k, 2736.9% for AGIs $25k-50k, 4688.0% for AGIs $50k-75k, 7770.0% for AGIs $75k-100k, 11930.0% for AGIs $100k-200k)
Taxable interest for individuals: $1,064 (reported on 24.9% of returns)
This zip code:
$1,064
Michigan:
$1,630
(% of AGI for various income ranges: 14.5% for AGIs below $25k, 23.4% for AGIs $25k-50k, 52.0% for AGIs $50k-75k, 163.3% for AGIs $75k-100k, 186.7% for AGIs $100k-200k)
Ordinary dividends: $8,454 (reported on 14.2% of returns)
Here:
$8,454
State:
$6,972
(% of AGI for various income ranges: 24.7% for AGIs below $25k, 33.1% for AGIs $25k-50k, 98.0% for AGIs $50k-75k, 300.0% for AGIs $75k-100k, 2425.0% for AGIs $100k-200k)
Net capital gain/loss in AGI: +$9,943 (reported on 12.4% of returns)
Here:
+$9,943
State:
+$20,064
(% of AGI for various income ranges: 0.2% for AGIs below $25k, 69.4% for AGIs $25k-50k, 85.3% for AGIs $50k-75k, 451.7% for AGIs $75k-100k, 2408.3% for AGIs $100k-200k)
Profit/loss from business: +$8,330 (reported on 13.6% of returns)
Here:
+$8,330
State:
+$11,172
(% of AGI for various income ranges: 119.2% for AGIs below $25k, 120.3% for AGIs $25k-50k, 274.7% for AGIs $50k-75k, 751.7% for AGIs $75k-100k)
Taxable individual retirement arrangement distribution: $14,474 (reported on 11.2% of returns)
49304:
$14,474
Michigan:
$19,803
(% of AGI for various income ranges: 86.0% for AGIs below $25k, 120.3% for AGIs $25k-50k, 347.3% for AGIs $50k-75k, 1111.7% for AGIs $75k-100k, 1141.7% for AGIs $100k-200k)
Total itemized deductions: $25,175 (reported on 2.4% of returns)
Here:
$25,175
State:
$34,117
(% of AGI for various income ranges: 671.3% for AGIs $50k-75k)
Charity contributions: $7,133 (reported on 1.8% of returns)
Here:
$7,133
State:
$13,548
(% of AGI for various income ranges: 142.7% for AGIs $50k-75k)
Taxes paid: $6,400 (reported on 2.4% of returns)
49304:
$6,400
State:
$7,972
(% of AGI for various income ranges: 170.7% for AGIs $50k-75k)
Earned income credit: $2,244 (reported on 21.3% of returns)
Here:
$2,244
State:
$2,251
(% of AGI for various income ranges: 101.3% for AGIs below $25k, 77.4% for AGIs $25k-50k)
Percentage of individuals using paid preparers for their 2020 taxes: 92.9%
Here:
93%
State:
93%
(% for various income ranges: 88.8% for AGIs below $25k, 95.6% for AGIs $25k-50k, 95.2% for AGIs $50k-75k, 100.0% for AGIs $75k-100k, 100.0% for AGIs $100k-200k, 100.0% for AGIs over 200k)
Averages for the 2012 tax year for zip code 49304, filed in 2013:
Average Adjusted Gross Income (AGI) in 2012: $34,153 (Individual Income Tax Returns)
Here:
$34,153
State:
$55,609
Salary/wage: $25,437 (reported on 71.1% of returns)
Here:
$25,437
State:
$46,782
(% of AGI for various income ranges: 57.2% for AGIs below $25k, 57.4% for AGIs $25k-50k, 62.9% for AGIs $50k-75k, 51.8% for AGIs $75k-100k, 39.4% for AGIs $100k-200k)
Taxable interest for individuals: $1,165 (reported on 26.1% of returns)
This zip code:
$1,165
Michigan:
$1,491
(% of AGI for various income ranges: 1.7% for AGIs below $25k, 0.5% for AGIs $25k-50k, 0.6% for AGIs $50k-75k, 0.5% for AGIs $75k-100k, 1.0% for AGIs $100k-200k)
Ordinary dividends: $5,525 (reported on 16.9% of returns)
Here:
$5,525
State:
$6,225
(% of AGI for various income ranges: 1.7% for AGIs below $25k, 1.0% for AGIs $25k-50k, 1.8% for AGIs $50k-75k, 2.7% for AGIs $75k-100k, 5.6% for AGIs $100k-200k)
Net capital gain/loss in AGI: +$2,772 (reported on 12.7% of returns)
Here:
+$2,772
State:
+$9,326
(% of AGI for various income ranges: 0.1% for AGIs $50k-75k, 4.0% for AGIs $100k-200k)
Profit/loss from business: +$5,311 (reported on 13.4% of returns)
Here:
+$5,311
State:
+$11,523
(% of AGI for various income ranges: 6.1% for AGIs below $25k, 1.5% for AGIs $25k-50k, 2.6% for AGIs $50k-75k, 1.0% for AGIs $75k-100k)
Taxable individual retirement arrangement distribution: $12,658 (reported on 13.4% of returns)
49304:
$12,658
Michigan:
$15,298
(% of AGI for various income ranges: 5.1% for AGIs below $25k, 4.2% for AGIs $25k-50k, 10.0% for AGIs $50k-75k, 4.0% for AGIs $100k-200k)
Total itemized deductions: $18,396 (26% of AGI, reported on 19.0% of returns)
Here:
$18,396
State:
$21,628
Here:
25.8% of AGI
State:
18.4% of AGI
(% of AGI for various income ranges: 7.2% for AGIs below $25k, 8.2% for AGIs $25k-50k, 10.5% for AGIs $50k-75k, 14.5% for AGIs $75k-100k, 12.1% for AGIs $100k-200k)
Charity contributions: $3,879 (reported on 13.4% of returns)
Here:
$3,879
State:
$4,225
(% of AGI for various income ranges: 0.8% for AGIs below $25k, 0.8% for AGIs $25k-50k, 1.6% for AGIs $50k-75k, 2.1% for AGIs $75k-100k, 2.3% for AGIs $100k-200k)
Taxes paid: $5,769 (reported on 18.3% of returns)
49304:
$5,769
State:
$8,327
(% of AGI for various income ranges: 1.2% for AGIs below $25k, 1.9% for AGIs $25k-50k, 2.9% for AGIs $50k-75k, 4.1% for AGIs $75k-100k, 5.2% for AGIs $100k-200k)
Earned income credit: $2,312 (reported on 29.6% of returns)
Here:
$2,312
State:
$2,306
(% of AGI for various income ranges: 9.5% for AGIs below $25k, 1.2% for AGIs $25k-50k)
Percentage of individuals using paid preparers for their 2012 taxes: 59.2%
Here:
59%
State:
57%
(% for various income ranges: 59.3% for AGIs below $25k, 53.1% for AGIs $25k-50k, 62.5% for AGIs $50k-75k, 71.4% for AGIs $75k-100k, 66.7% for AGIs $100k-200k)
Averages for the 2004 tax year for zip code 49304, filed in 2005:
Average Adjusted Gross Income (AGI) in 2004: $26,066 (Individual Income Tax Returns)
Here:
$26,066
State:
$48,204
Salary/wage: $22,292 (reported on 72.0% of returns)
Here:
$22,292
State:
$42,791
(% of AGI for various income ranges: 87.9% for AGIs below $10k, 63.3% for AGIs $10k-25k, 64.5% for AGIs $25k-50k, 60.0% for AGIs $50k-75k, 54.8% for AGIs $75k-100k, 54.6% for AGIs over 100k)
Taxable interest for individuals: $1,677 (reported on 33.3% of returns)
This zip code:
$1,677
Michigan:
$1,725
(% of AGI for various income ranges: 5.3% for AGIs below $10k, 1.5% for AGIs $10k-25k, 1.4% for AGIs $25k-50k, 1.5% for AGIs $50k-75k, 1.5% for AGIs $75k-100k, 3.9% for AGIs over 100k)
Taxable dividends: $5,018 (reported on 17.3% of returns)
Here:
$5,018
State:
$3,420
(% of AGI for various income ranges: 2.8% for AGIs below $10k, 1.2% for AGIs $10k-25k, 1.0% for AGIs $25k-50k, 2.5% for AGIs $50k-75k, 3.4% for AGIs $75k-100k, 9.7% for AGIs over 100k)
Net capital gain/loss: +$4,055 (reported on 13.5% of returns)
Here:
+$4,055
State:
+$8,532
(% of AGI for various income ranges: -0.5% for AGIs below $10k, 0.6% for AGIs $10k-25k, 0.9% for AGIs $25k-50k, 0.1% for AGIs $50k-75k, 4.6% for AGIs $75k-100k, 6.4% for AGIs over 100k)
Profit/loss from business: +$4,201 (reported on 12.9% of returns)
Here:
+$4,201
State:
+$9,547
(% of AGI for various income ranges: 0.8% for AGIs below $10k, 4.8% for AGIs $10k-25k, 1.1% for AGIs $25k-50k, 1.9% for AGIs $50k-75k, 4.4% for AGIs $75k-100k)
IRA payment deduction: $2,727 (reported on 1.4% of returns)
49304:
$2,727
Michigan:
$2,875
Total itemized deductions: $15,197 (25% of AGI, reported on 17.3% of returns)
Here:
$15,197
State:
$18,509
Here:
24.7% of AGI
State:
20.7% of AGI
(% of AGI for various income ranges: 7.4% for AGIs below $10k, 8.0% for AGIs $10k-25k, 10.5% for AGIs $25k-50k, 10.0% for AGIs $50k-75k, 10.9% for AGIs $75k-100k, 11.8% for AGIs over 100k)
Charity contributions deductions: $3,311 (5% of AGI, reported on 13.9% of returns)
Here:
$3,311
State:
$3,365
Here:
4.8% of AGI
State:
3.6% of AGI
(% of AGI for various income ranges: 0.7% for AGIs $10k-25k, 1.3% for AGIs $25k-50k, 2.2% for AGIs $50k-75k, 2.4% for AGIs $75k-100k, 3.3% for AGIs over 100k)
Total tax: $4,013 (reported on 57.1% of returns)
49304:
$4,013
State:
$7,691
(% of AGI for various income ranges: 3.0% for AGIs below $10k, 3.2% for AGIs $10k-25k, 6.2% for AGIs $25k-50k, 9.5% for AGIs $50k-75k, 11.8% for AGIs $75k-100k, 17.6% for AGIs over 100k)
Earned income credit: $1,676 (reported on 25.2% of returns)
Here:
$1,676
State:
$1,737
Percentage of individuals using paid preparers for their 2004 taxes: 62.1%
Here:
62%
State:
60%
(% for various income ranges: 60.0% for AGIs below $10k, 63.8% for AGIs $10k-25k, 58.9% for AGIs $25k-50k, 64.6% for AGIs $50k-75k, 75.0% for AGIs $75k-100k, 72.9% for AGIs over 100k)
Likely homosexual households (counted as self-reported same-sex unmarried-partner households)
Lesbian couples: 0.2% of all households
Gay men: 0.0% of all households
Household received Food Stamps/SNAP in the past 12 months: 446 Household did not receive Food Stamps/SNAP in the past 12 months: 1,233
Women who had a birth in the past 12 months: 34 (13 now married, 20 unmarried) Women who did not have a birth in the past 12 months: 536 (175 now married, 362 unmarried)
Housing units in zip code 49304 with a mortgage: 595 (40 second mortgage, 38 both second mortgage and home equity loan) Median monthly owner costs for units with a mortgage: $1,019 Median monthly owner costs for units without a mortgage: $448
Residents with income below the poverty level in 2022:
This zip code:
23.4%
Whole state:
13.4%
Residents with income below 50% of the poverty level in 2022:
This zip code:
12.9%
Whole state:
6.9%
Median number of rooms in houses and condos:
Here:
5.3
State:
6.5
Median number of rooms in apartments:
Here:
4.0
State:
4.3
Notable locations in this zip code not listed on our city pages
Notable locations in zip code 49304: Leverentz Lake State Forest Campground (A), Baldwin Station (B), Whispering Oaks Campground and Cabins (C), Ivan's Campground and Cabins (D), Marquette Trails Country Club (E), Baldwin Fish Hatchery (F), Marlborough Station (G), Wingleton Station (H), Forks Public Access (I), Little Leverentz Lake Recreation Site (J), Bray Creek Recreation Site (K), Baldwin District Ranger Office (L), Gleasons Landing Recreation Area (M), Life Emergency Medical Services of Lake County Baldwin (N), Lake County Courthouse (O), Baldwin Fire Station (P), Lake County Sheriff Department (Q), Lake Township Fire Department (R), Baldwin Fire Department (S), Webber Township Fire Department (T). Display/hide their locations on the map
Churches in zip code 49304 include: Grace Lutheran Church (A), Baldwin Assembly of God Church (B), Baldwin Church of Christ (C), Saint Ann Catholic Church (D), Baldwin Congregational United Church of Christ (E), Goodwill Missionary Baptist Church (F), Kingdom Hall of Jehovah's Witnesses (G), Lake Community Bible Church (H), Christ Community Church (I). Display/hide their locations on the map
Lakes, reservoirs, and swamps: Rainbow Lake (A), Little Leverentz Lake (B), Basford Lake (C), Big Star Lake (D), Orchard Lake (E), Whalen Lake (F), Duck Lake (G), Feeder Lake (H). Display/hide their locations on the map
Rivers and creeks: Bray Creek (A), Baldwin River (B), Jenks Creek (C), Danaher Creek (D), Middle Branch Pere Marquette River (E), Cole Creek (F), Sanborn Creek (G), Little South Branch Pere Marquette River (H). Display/hide their locations on the map
Parks in zip code 49304 include: Shrine of the Pines (1), Brown Trout Historical Marker (2), Lake County Historical Marker (3). Display/hide their locations on the map
In group quarters: 273 (-1 institutionalized population)
Size of family households: 451 2-persons, 124 3-persons, 52 4-persons, 49 5-persons, 53 6-persons, 8 7-or-more-persons
Size of nonfamily households: 788 1-person, 135 2-persons, 13 3-persons
300 married couples with children.
213 single-parent households (147 men, 66 women).
96.7% of residents of 49304 zip code speak English at home.
3.0% of residents speak Spanish at home (83% very well, 4% well, 13% not well).
0.2% of residents speak other Indo-European language at home (86% very well, 14% well).
0.6% of residents speak Asian or Pacific Island language at home (100% very well).
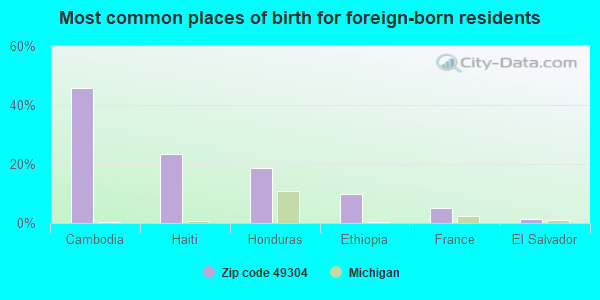
Foreign born population: 81 (1.8%) (60.5% of them are naturalized citizens)
This zip code:
1.8%
Whole state:
6.9%
46%Cambodia
23%Haiti
19%Honduras
10%Ethiopia
5%France
1%El Salvador
19%English
8%Irish
7%German
6%American
6%Dutch
2%Welsh
2%European
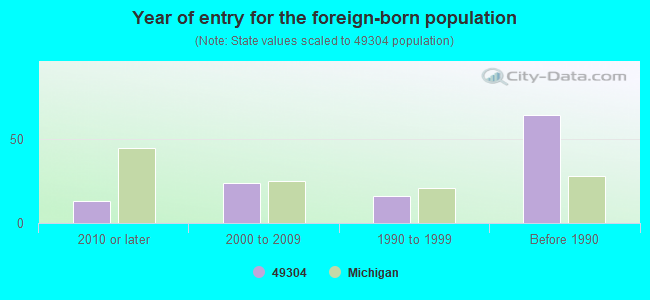
Year of entry for the foreign-born population
132010 or later
242000 to 2009
161990 to 1999
64Before 1990
Major facilities with environmental interests located in this zip code:
BALDWIN ELEMENTARY SCHOOL (525 FOURTH STREET in BALDWIN, MI)
(National Center for Education Statistics) - STATE ID-05826 Organizations: BALDWIN COMMUNITY SCHOOLS (SCHOOL DISTRICT)
BALDWIN JUNIOR HIGH SCHOOL (525 FOURTH STREET in BALDWIN, MI)
(National Center for Education Statistics) - STATE ID-05565 Organizations: BALDWIN COMMUNITY SCHOOLS (SCHOOL DISTRICT)
BALDWIN SENIOR HIGH SCHOOL (525 FOURTH STREET in BALDWIN, MI)
(National Center for Education Statistics) - STATE ID-00181 Organizations: BALDWIN COMMUNITY SCHOOLS (SCHOOL DISTRICT)
AUSTIN TUBE PROD (STATE FOREST RD in BALDWIN, MI)
National Pollutant Discharge Elimination System NON-MAJOR (Tracking pollutant discharge elimination systems) - permit Business SIC classification: FABRICATED PIPE AND PIPE FITTINGS Organizations: JOE DAY (CONTACT/OWNER)
BALDWIN COMMUNITY SCHOOLS (525 4TH ST in BALDWIN, MI)
COMPLIANCE ACTIVITY (Tracking inspections of insecticide, fungicide, and rodenticide, and toxic substances) Conditionally Exempt Small Quantity Generators, less than 100 kg/month of hazardous waste (Resource Conservation and Recovery Act (tracking hazardous waste)) Alternative names: BALDWIN SCHOOL, BALDWN COMM SCHOOLS
MI DEPT/NATURAL RESOURCES (BALDWIN RADIO TOWER WOLF LAKE in BALDWIN, MI)
(Resource Conservation and Recovery Act (tracking hazardous waste)) Organizations: MICH DEPT OF NATURAL RESOURCES (CONTACT/OWNER)
Alternative names: MIDNR RADIO TOWER WOLF LAKE
MI DEPT/TRANSPORTATION (880.5 MICHIGAN AVE in BALDWIN, MI)
(Resource Conservation and Recovery Act (tracking hazardous waste)) Organizations: MICH DEPT OF TRANSPORTATION (CONTACT/OPERATOR)
MI DEPT/TRANSPORTATION BRIDGE (US-10 OVER BALDWIN CREEK in BALDWIN, MI)
(Resource Conservation and Recovery Act (tracking hazardous waste)) Organizations: MICH DEPT OF TRANSPORTATION (CONTACT/OPERATOR)
Alternative names: MIDOT BRIDGE US-10 OVER BALDWIN CREEK
Housing units lacking complete plumbing facilities: 9.0% Housing units lacking complete kitchen facilities: 7.8%
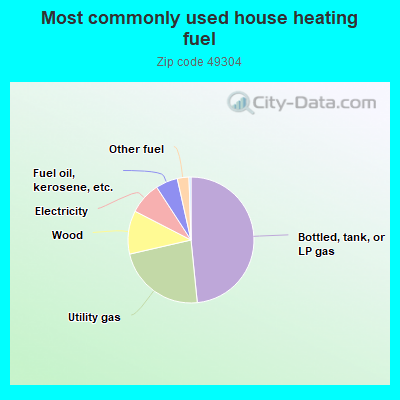
48.6%Bottled, tank, or LP gas
23.1%Utility gas
11.2%Wood
8.3%Electricity
5.7%Fuel oil, kerosene, etc.
3.0%Other fuel
Population in 1990: 3,387. Population change in the 1990s: +1,164 (+34.4%).
Place of birth for U.S.-born residents:
This state: 3,610
Northeast: 42
Midwest: 374
South: 354
West: 92
52% of the 49304 zip code residents lived in the same house 5 years ago. Out of people who lived in different houses, 30% lived in this county. Out of people who lived in different counties, 50% lived in Michigan.
87% of the 49304 zip code residents lived in the same house 1 year ago. Out of people who lived in different houses, 31% moved from this county. Out of people who lived in different houses, 63% moved from different county within same state. Out of people who lived in different houses, 3% moved from different state.
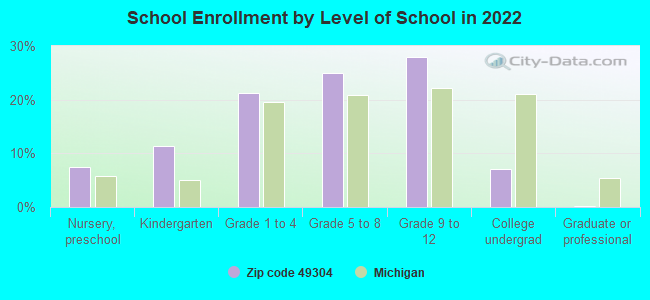
Private vs. public school enrollment:
Students in private schools in grades 1 to 8 (elementary and middle school): 2
Here:
0.7%
Michigan:
12.4%
Students in private schools in grades 9 to 12 (high school):
Here:
0.0%
Michigan:
9.8%
Students in private undergraduate colleges: 10
Here:
21.4%
Michigan:
14.9%
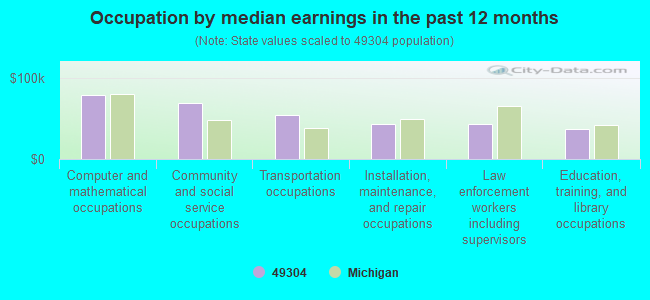
Occupation by median earnings in the past 12 months ($)
79,002Computer and mathematical occupations
69,680Community and social service occupations
54,661Transportation occupations
43,483Installation, maintenance, and repair occupations
42,702Law enforcement workers including supervisors
37,191Education, training, and library occupations
Top industries in this zip code by the number of employees in 2005:
Administrative and Support and Waste Management and Remediation Services: Security Guards and Patrol Services (100-249 employees: 1 establishment)
Health Care and Social Assistance: Offices of Physicians (except Mental Health Specialists) (50-99: 1)
Health Care and Social Assistance: Nursing Care Facilities (50-99: 1)
Health Care and Social Assistance: Offices of Physicians, Mental Health Specialists (20-49: 1)
Finance and Insurance: Commercial Banking (20-49: 1)
People in group quarters in 2010:
271 people in correctional residential facilities
75 people in nursing facilities/skilled-nursing facilities
20 people in local jails and other municipal confinement facilities
6 people in group homes intended for adults
People in group quarters in 2000:
324 people in training schools for juvenile delinquents
160 people in state prisons
83 people in nursing homes
18 people in local jails and other confinement facilities (including police lockups)
6 people in other group homes
Fatal accident statistics in 2014:
Fatal accident count: 1
Vehicles involved in fatal accidents: 2
Fatal accidents caused by drunken drivers: 0
Fatalities: 1
Persons involved in fatal accidents: 3
Pedestrians involved in fatal accidents: 0
Fatal accident statistics in 2012:
Fatal accident count: 2
Vehicles involved in fatal accidents: 3
Fatal accidents caused by drunken drivers: 1
Fatalities: 2
Persons involved in fatal accidents: 7
Pedestrians involved in fatal accidents: 0
2002 - 2018 National Fire Incident Reporting System (NFIRS) incidents
According to the data from the years 2002 - 2018 the average number of fire incidents per year is 48. The highest number of fires - 73 took place in 2008, and the least - 27 in 2013. The data has an increasing trend.
When looking into fire subcategories, the most reports belonged to: Structure Fires (51.4%), and Outside Fires (34.1%).
Fire incident types reported to NFIRS in Zip Code 49304


 Nearest zip codes: 49642, 49309, 49402, 49623, 49644, 49458.


 According to the data from the years 2002 - 2018 the average number of fire incidents per year is 48. The highest number of fires - 73 took place in 2008, and the least - 27 in 2013. The data has an increasing trend.
 When looking into fire subcategories, the most reports belonged to: Structure Fires (51.4%), and Outside Fires (34.1%).