Estimated zip code population in 2022: 2,118 Zip code population in 2010: 1,939 Zip code population in 2000: 1,899
Houses and condos: 863 Renter-occupied apartments: 86
% of renters here:
13%
State:
27%
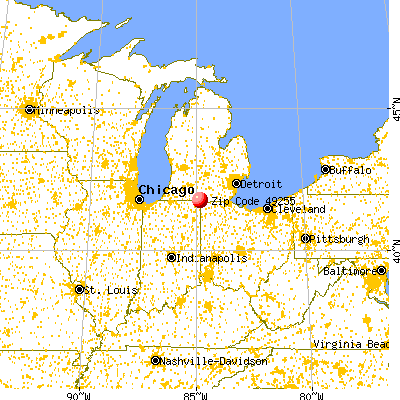
March 2022 cost of living index in zip code 49255: 81.9 (low, U.S. average is 100)
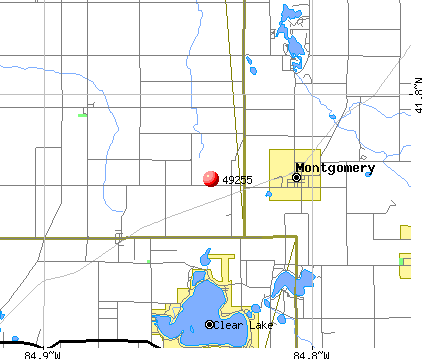
Land area: 40.0 sq. mi. Water area: 0.3 sq. mi.
Population density: 53 people per square mile
(very low).
OSM Map
General Map
Google Map
MSN Map
OSM Map
General Map
Google Map
MSN Map
OSM Map
General Map
Google Map
MSN Map
OSM Map
General Map
Google Map
MSN Map
Please wait while loading the map...
Real estate property taxes paid for housing units in 2022:
This zip code:
1.0% ($1,478)
Michigan:
1.2% ($2,746)
Median real estate property taxes paid for housing units with mortgages in 2022: $1,630 (1.0%) Median real estate property taxes paid for housing units with no mortgage in 2022: $1,335 (1.2%)
Business Search- 14 Million verified businesses
Males: 1,077
(50.9%)
Females: 1,041
(49.1%)
For population 25 years and over in 49255:
High school or higher: 74.4%
Bachelor's degree or higher: 10.6%
Graduate or professional degree: 2.1%
Unemployed: 2.4%
Mean travel time to work (commute): 22.3 minutes
For population 15 years and over in 49255:
Never married: 23.7%
Now married: 61.9%
Separated: 1.0%
Widowed: 3.1%
Divorced: 10.3%
Zip code 49255 compared to state average:
Median house value below state average.
Unemployed percentage below state average.
Black race population percentage significantly below state average.
Median age significantly below state average.
Foreign-born population percentage significantly below state average.
Renting percentage below state average.
Number of college students significantly below state average.
Percentage of population with a bachelor's degree or higher significantly below state average.
Estimated median house/condo value in 2022: $144,281
49255:
$144,281
Michigan:
$224,400
According to our research of Michigan and other state lists, there were 7 registered sex offenders living in 49255 zip code as of May 23, 2024. The ratio of all residents to sex offenders in zip code 49255 is 331 to 1. The ratio of registered sex offenders to all residents in this zip code is near the state average.
Median resident age:
This zip code:
28.2 years
Michigan median age:
40.3 years
Average household size:
This zip code:
3.2 people
Michigan:
2.4 people
Averages for the 2020 tax year for zip code 49255, filed in 2021:
Average Adjusted Gross Income (AGI) in 2020: $46,319 (Individual Income Tax Returns)
Here:
$46,319
State:
$68,945
Salary/wage: $42,527 (reported on 75.9% of returns)
Here:
$42,527
State:
$57,142
(% of AGI for various income ranges: 1115.7% for AGIs below $25k, 3514.6% for AGIs $25k-50k, 6192.9% for AGIs $50k-75k, 10566.7% for AGIs $75k-100k, 16920.0% for AGIs $100k-200k)
Taxable interest for individuals: $300 (reported on 19.0% of returns)
This zip code:
$300
Michigan:
$1,630
(% of AGI for various income ranges: 2.9% for AGIs below $25k, 9.2% for AGIs $25k-50k, 56.7% for AGIs $75k-100k)
Ordinary dividends: $2,140 (reported on 8.6% of returns)
Here:
$2,140
State:
$6,972
(% of AGI for various income ranges: 46.9% for AGIs $25k-50k, 153.3% for AGIs $75k-100k)
Net capital gain/loss in AGI: +$4,300 (reported on 6.9% of returns)
Here:
+$4,300
State:
+$20,064
(% of AGI for various income ranges: 35.7% for AGIs below $25k, 406.7% for AGIs $75k-100k)
Profit/loss from business: +$13,656 (reported on 15.5% of returns)
Here:
+$13,656
State:
+$11,172
(% of AGI for various income ranges: 106.4% for AGIs below $25k, 356.2% for AGIs $25k-50k, 881.4% for AGIs $50k-75k)
Taxable individual retirement arrangement distribution: $7,375 (reported on 6.9% of returns)
49255:
$7,375
Michigan:
$19,803
(% of AGI for various income ranges: 226.9% for AGIs $25k-50k)
Earned income credit: $1,918 (reported on 19.0% of returns)
Here:
$1,918
State:
$2,251
(% of AGI for various income ranges: 71.4% for AGIs below $25k, 85.4% for AGIs $25k-50k)
Percentage of individuals using paid preparers for their 2020 taxes: 94.8%
Here:
95%
State:
93%
(% for various income ranges: 90.5% for AGIs below $25k, 100.0% for AGIs $25k-50k, 100.0% for AGIs $50k-75k, 100.0% for AGIs $75k-100k, 83.3% for AGIs $100k-200k)
Averages for the 2012 tax year for zip code 49255, filed in 2013:
Average Adjusted Gross Income (AGI) in 2012: $36,023 (Individual Income Tax Returns)
Here:
$36,023
State:
$55,609
Salary/wage: $32,760 (reported on 80.0% of returns)
Here:
$32,760
State:
$46,782
(% of AGI for various income ranges: 66.7% for AGIs below $25k, 77.5% for AGIs $25k-50k, 83.7% for AGIs $50k-75k, 119.3% for AGIs $75k-100k)
Taxable interest for individuals: $800 (reported on 23.3% of returns)
This zip code:
$800
Michigan:
$1,491
(% of AGI for various income ranges: 1.1% for AGIs below $25k, 0.5% for AGIs $25k-50k, 0.5% for AGIs $50k-75k, 0.7% for AGIs $75k-100k)
Ordinary dividends: $1,583 (reported on 10.0% of returns)
Here:
$1,583
State:
$6,225
Net capital gain/loss in AGI: +$6,217 (reported on 10.0% of returns)
Here:
+$6,217
State:
+$9,326
Profit/loss from business: +$8,422 (reported on 15.0% of returns)
Here:
+$8,422
State:
+$11,523
(% of AGI for various income ranges: 6.1% for AGIs below $25k, 7.6% for AGIs $25k-50k, 2.0% for AGIs $50k-75k)
Taxable individual retirement arrangement distribution: $5,750 (reported on 10.0% of returns)
49255:
$5,750
Michigan:
$15,298
Total itemized deductions: $19,288 (25% of AGI, reported on 13.3% of returns)
Here:
$19,288
State:
$21,628
Here:
24.9% of AGI
State:
18.4% of AGI
Charity contributions: $3,475 (reported on 6.7% of returns)
Here:
$3,475
State:
$4,225
Taxes paid: $5,088 (reported on 13.3% of returns)
49255:
$5,088
State:
$8,327
Earned income credit: $2,492 (reported on 21.7% of returns)
Here:
$2,492
State:
$2,306
(% of AGI for various income ranges: 8.0% for AGIs below $25k, 1.2% for AGIs $25k-50k)
Percentage of individuals using paid preparers for their 2012 taxes: 66.7%
Here:
67%
State:
57%
(% for various income ranges: 60.7% for AGIs below $25k, 64.7% for AGIs $25k-50k, 77.8% for AGIs $50k-75k, 125.0% for AGIs $75k-100k)
Averages for the 2004 tax year for zip code 49255, filed in 2005:
Average Adjusted Gross Income (AGI) in 2004: $31,160 (Individual Income Tax Returns)
Here:
$31,160
State:
$48,204
Salary/wage: $29,386 (reported on 83.0% of returns)
Here:
$29,386
State:
$42,791
(% of AGI for various income ranges: 130.0% for AGIs below $10k, 71.0% for AGIs $10k-25k, 85.7% for AGIs $25k-50k, 83.6% for AGIs $50k-75k, 107.7% for AGIs $75k-100k)
Taxable interest for individuals: $1,197 (reported on 37.2% of returns)
This zip code:
$1,197
Michigan:
$1,725
(% of AGI for various income ranges: 6.4% for AGIs below $10k, 2.6% for AGIs $10k-25k, 0.4% for AGIs $25k-50k, 1.4% for AGIs $50k-75k, 3.0% for AGIs $75k-100k)
Taxable dividends: $1,490 (reported on 14.9% of returns)
Here:
$1,490
State:
$3,420
(% of AGI for various income ranges: 3.1% for AGIs below $10k, 1.1% for AGIs $10k-25k, 0.5% for AGIs $25k-50k, 0.7% for AGIs $50k-75k, 1.2% for AGIs $75k-100k)
Net capital gain/loss: +$1,352 (reported on 11.0% of returns)
Here:
+$1,352
State:
+$8,532
(% of AGI for various income ranges: -2.6% for AGIs below $10k, -0.2% for AGIs $10k-25k, 0.3% for AGIs $25k-50k, 1.6% for AGIs $50k-75k)
Profit/loss from business: +$4,889 (reported on 12.6% of returns)
Here:
+$4,889
State:
+$9,547
(% of AGI for various income ranges: 0.3% for AGIs below $10k, 6.8% for AGIs $10k-25k, 1.8% for AGIs $25k-50k, 1.3% for AGIs $50k-75k)
Total itemized deductions: $14,408 (25% of AGI, reported on 18.7% of returns)
Here:
$14,408
State:
$18,509
Here:
24.7% of AGI
State:
20.7% of AGI
(% of AGI for various income ranges: 5.7% for AGIs $10k-25k, 7.8% for AGIs $25k-50k, 11.1% for AGIs $50k-75k, 16.9% for AGIs $75k-100k)
Charity contributions deductions: $2,654 (4% of AGI, reported on 12.1% of returns)
Here:
$2,654
State:
$3,365
Here:
3.8% of AGI
State:
3.6% of AGI
Total tax: $3,877 (reported on 67.2% of returns)
49255:
$3,877
State:
$7,691
(% of AGI for various income ranges: 5.1% for AGIs below $10k, 3.8% for AGIs $10k-25k, 5.9% for AGIs $25k-50k, 8.5% for AGIs $50k-75k, 10.9% for AGIs $75k-100k, 20.9% for AGIs over 100k)
Earned income credit: $1,795 (reported on 20.5% of returns)
Here:
$1,795
State:
$1,737
Percentage of individuals using paid preparers for their 2004 taxes: 75.3%
Here:
75%
State:
60%
(% for various income ranges: 74.2% for AGIs below $10k, 72.8% for AGIs $10k-25k, 76.3% for AGIs $25k-50k, 73.6% for AGIs $50k-75k, 121.4% for AGIs $75k-100k)
Likely homosexual households (counted as self-reported same-sex unmarried-partner households)
Lesbian couples: 0.3% of all households
Gay men: 0.0% of all households
Household received Food Stamps/SNAP in the past 12 months: 31 Household did not receive Food Stamps/SNAP in the past 12 months: 616
Women who had a birth in the past 12 months: 42 (37 now married, 5 unmarried) Women who did not have a birth in the past 12 months: 430 (232 now married, 196 unmarried)
Housing units in zip code 49255 with a mortgage: 369 (43 second mortgage, 34 both second mortgage and home equity loan) Houses without a mortgage: 3
Median monthly owner costs for units with a mortgage: $1,170 Median monthly owner costs for units without a mortgage: $467
Residents with income below the poverty level in 2022:
This zip code:
35.4%
Whole state:
13.4%
Residents with income below 50% of the poverty level in 2022:
This zip code:
13.6%
Whole state:
6.9%
Median number of rooms in houses and condos:
Here:
6.3
State:
6.5
Median number of rooms in apartments:
Here:
5.7
State:
4.3
Notable locations in this zip code not listed on our city pages
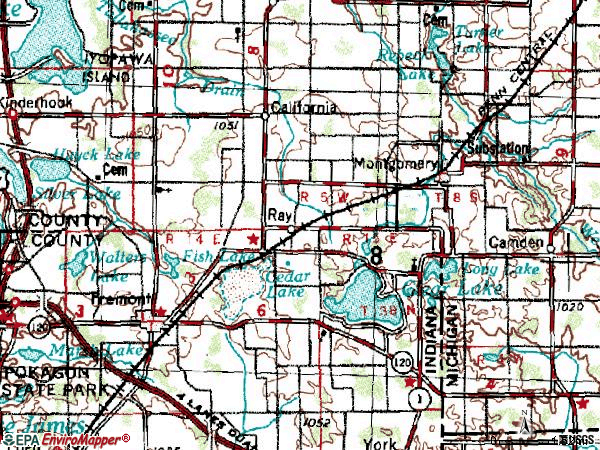
Churches in zip code 49255 include: Stokes Chapel (A), Montgomery United Methodist Church (B), Montgomery United Brethren Church (C). Display/hide their locations on the map
Cemeteries: Munday Cemetery (1), California Corners Cemetery (2), Hultz Family Cemetery (3), West Reading Cemetery (4). Display/hide their locations on the map
Lakes and swamps: Marsh Lake (A), Withington Lake (B), Mead Lake (C), Cartwright Lakes (D), Browns Lake (E), Lake Bricker (F), Long Lake (G), Big Swamp (H). Display/hide their locations on the map
In group quarters: 17 (-1 institutionalized population)
Size of family households: 226 2-persons, 90 3-persons, 60 4-persons, 18 5-persons, 32 6-persons, 59 7-or-more-persons
Size of nonfamily households: 122 1-person, 43 2-persons
622 married couples with children.
99 single-parent households (23 men, 76 women).
69.2% of residents of 49255 zip code speak English at home.
31.7% of residents speak other Indo-European language at home (73% very well, 8% well, 14% not well, 5% not at all).
0.3% of residents speak Asian or Pacific Island language at home (50% very well, 50% well).
0.1% of residents speak other language at home (100% very well).
Foreign born population: 5 (0.3%) (17.4% of them are naturalized citizens)
This zip code:
0.3%
Whole state:
6.9%
67%Malaysia
17%Sweden
48%German
15%Swiss
10%English
8%American
6%Irish
2%European
1%Polish
Year of entry for the foreign-born population
32010 or later
192000 to 2009
11990 to 1999
2Before 1990
Facilities with environmental interests located in this zip code:
AMISH PRIVATE 2 (RR 2 1018 HAMMAN in MONTGOMERY, MI)
COMPLIANCE ACTIVITY (Tracking inspections of insecticide, fungicide, and rodenticide, and toxic substances)
Housing units lacking complete plumbing facilities: 14.3% Housing units lacking complete kitchen facilities: 14.1%
40.0%Bottled, tank, or LP gas
26.1%Wood
18.4%Utility gas
5.6%Electricity
5.2%Coal or coke
3.5%Fuel oil, kerosene, etc.
1.4%Other fuel
Population in 1990: 2,260.
Place of birth for U.S.-born residents:
This state: 1,570
Northeast: 15
Midwest: 428
South: 74
West: 4
62% of the 49255 zip code residents lived in the same house 5 years ago. Out of people who lived in different houses, 50% lived in this county. Out of people who lived in different counties, 50% lived in Michigan.
95% of the 49255 zip code residents lived in the same house 1 year ago. Out of people who lived in different houses, 55% moved from this county. Out of people who lived in different houses, 30% moved from different county within same state. Out of people who lived in different houses, 14% moved from different state. Out of people who lived in different houses, 2% moved from abroad.
Private vs. public school enrollment:
Students in private schools in grades 1 to 8 (elementary and middle school): 172
Here:
59.0%
Michigan:
12.4%
Students in private schools in grades 9 to 12 (high school): 12
Here:
13.2%
Michigan:
9.8%
Students in private undergraduate colleges: 4
Here:
40.1%
Michigan:
14.9%
Occupation by median earnings in the past 12 months ($)
59,038Health diagnosing and treating practitioners and other technical occupations
54,295Law enforcement workers including supervisors
48,180Business and financial operations occupations
48,081Transportation occupations
46,163Production occupations
45,157Building and grounds cleaning and maintenance occupations
Top industries in this zip code by the number of employees in 2005:
Construction: Plumbing, Heating, and Air-Conditioning Contractors (5-9 employees: 1 establishment)
Wholesale Trade: Poultry and Poultry Product Merchant Wholesalers (5-9: 1)
Health Care and Social Assistance: Services for the Elderly and Persons with Disabilities (5-9: 1)
Wholesale Trade: Stationery and Office Supplies Merchant Wholesalers (1-4: 1)
Health Care and Social Assistance: Other Individual and Family Services (1-4: 1)
Construction: Highway, Street, and Bridge Construction (1-4: 1)
Wholesale Trade: Other Miscellaneous Nondurable Goods Merchant Wholesalers (1-4: 1)
People in group quarters in 2010:
23 people in group homes intended for adults
People in group quarters in 2000:
14 people in other group homes
6 people in other noninstitutional group quarters
Fatal accident statistics in 2012:
Fatal accident count: 1
Vehicles involved in fatal accidents: 1
Fatal accidents caused by drunken drivers: 0
Fatalities: 1
Persons involved in fatal accidents: 4
Pedestrians involved in fatal accidents: 0
Fatal accident statistics in 2011:
Fatal accident count: 1
Vehicles involved in fatal accidents: 1
Fatal accidents caused by drunken drivers: 1
Fatalities: 1
Persons involved in fatal accidents: 1
Pedestrians involved in fatal accidents: 0
2002 - 2016 National Fire Incident Reporting System (NFIRS) incidents
According to the data from the years 2002 - 2016 the average number of fires per year is 11. The highest number of fire incidents - 24 took place in 2012, and the least - 2 in 2002. The data has a growing trend.
When looking into fire subcategories, the most incidents belonged to: Outside Fires (81.1%), and Structure Fires (15.4%).
Fire incident types reported to NFIRS in Zip Code 49255


 Nearest zip codes: 46737, 49274, 49082, 49232, 49227, 43518.


 According to the data from the years 2002 - 2016 the average number of fires per year is 11. The highest number of fire incidents - 24 took place in 2012, and the least - 2 in 2002. The data has a growing trend.
 When looking into fire subcategories, the most incidents belonged to: Outside Fires (81.1%), and Structure Fires (15.4%).