Estimated zip code population in 2022: 880 Zip code population in 2010: 899 Zip code population in 2000: 912
Houses and condos: 385 Renter-occupied apartments: 34
% of renters here:
10%
State:
27%
March 2022 cost of living index in zip code 49248: 91.5 (less than average, U.S. average is 100)
Land area: 32.9 sq. mi. Water area: 0.0 sq. mi.
Population density: 27 people per square mile
(very low).
OSM Map
General Map
Google Map
MSN Map
OSM Map
General Map
Google Map
MSN Map
OSM Map
General Map
Google Map
MSN Map
OSM Map
General Map
Google Map
MSN Map
Please wait while loading the map...
Real estate property taxes paid for housing units in 2022:
This zip code:
1.3% ($2,227)
Michigan:
1.2% ($2,746)
Median real estate property taxes paid for housing units with mortgages in 2022: $2,169 (1.3%) Median real estate property taxes paid for housing units with no mortgage in 2022: $2,328 (1.4%)
Business Search- 14 Million verified businesses
Males: 437
(49.7%)
Females: 443
(50.3%)
For population 25 years and over in 49248:
High school or higher: 90.4%
Bachelor's degree or higher: 15.0%
Graduate or professional degree: 2.5%
Unemployed: 4.2%
Mean travel time to work (commute): 29.9 minutes
For population 15 years and over in 49248:
Never married: 29.6%
Now married: 54.5%
Separated: 0.9%
Widowed: 7.9%
Divorced: 7.2%
Zip code 49248 compared to state average:
Black race population percentage significantly below state average.
Hispanic race population percentage below state average.
Median age above state average.
Foreign-born population percentage significantly below state average.
Renting percentage significantly below state average.
Length of stay since moving in significantly above state average.
House age above state average.
Number of college students below state average.
Percentage of population with a bachelor's degree or higher below state average.
Averages for the 2020 tax year for zip code 49248, filed in 2021:
Average Adjusted Gross Income (AGI) in 2020: $53,069 (Individual Income Tax Returns)
Here:
$53,069
State:
$68,945
Salary/wage: $46,538 (reported on 81.0% of returns)
Here:
$46,538
State:
$57,142
(% of AGI for various income ranges: 862.2% for AGIs below $25k, 3589.0% for AGIs $25k-50k, 6058.0% for AGIs $50k-75k, 10433.3% for AGIs $75k-100k, 17663.3% for AGIs $100k-200k)
Taxable interest for individuals: $545 (reported on 26.2% of returns)
This zip code:
$545
Michigan:
$1,630
(% of AGI for various income ranges: 10.0% for AGIs below $25k, 36.0% for AGIs $50k-75k, 110.0% for AGIs $100k-200k)
Ordinary dividends: $960 (reported on 11.9% of returns)
Here:
$960
State:
$6,972
(% of AGI for various income ranges: 96.0% for AGIs $50k-75k)
Net capital gain/loss in AGI: +$1,350 (reported on 9.5% of returns)
Here:
+$1,350
State:
+$20,064
(% of AGI for various income ranges: 108.0% for AGIs $50k-75k)
Profit/loss from business: +$4,075 (reported on 9.5% of returns)
Here:
+$4,075
State:
+$11,172
(% of AGI for various income ranges: 326.0% for AGIs $50k-75k)
Taxable individual retirement arrangement distribution: $8,250 (reported on 9.5% of returns)
49248:
$8,250
Michigan:
$19,803
(% of AGI for various income ranges: 366.7% for AGIs below $25k)
Earned income credit: $1,750 (reported on 14.3% of returns)
Here:
$1,750
State:
$2,251
(% of AGI for various income ranges: 55.6% for AGIs below $25k, 55.0% for AGIs $25k-50k)
Percentage of individuals using paid preparers for their 2020 taxes: 92.9%
Here:
93%
State:
93%
(% for various income ranges: 92.3% for AGIs below $25k, 91.7% for AGIs $25k-50k, 100.0% for AGIs $50k-75k, 80.0% for AGIs $75k-100k, 100.0% for AGIs $100k-200k)
Averages for the 2012 tax year for zip code 49248, filed in 2013:
Average Adjusted Gross Income (AGI) in 2012: $45,845 (Individual Income Tax Returns)
Here:
$45,845
State:
$55,609
Salary/wage: $38,900 (reported on 77.3% of returns)
Here:
$38,900
State:
$46,782
(% of AGI for various income ranges: 65.5% for AGIs below $25k, 78.7% for AGIs $25k-50k, 77.8% for AGIs $50k-75k, 74.2% for AGIs $75k-100k, 45.4% for AGIs $100k-200k)
Taxable interest for individuals: $683 (reported on 27.3% of returns)
This zip code:
$683
Michigan:
$1,491
(% of AGI for various income ranges: 0.4% for AGIs below $25k, 1.9% for AGIs $75k-100k)
Ordinary dividends: $783 (reported on 13.6% of returns)
Here:
$783
State:
$6,225
Net capital gain/loss in AGI: +$733 (reported on 6.8% of returns)
Here:
+$733
State:
+$9,326
Profit/loss from business: +$7,683 (reported on 13.6% of returns)
Here:
+$7,683
State:
+$11,523
Taxable individual retirement arrangement distribution: $5,833 (reported on 6.8% of returns)
49248:
$5,833
Michigan:
$15,298
Total itemized deductions: $15,170 (16% of AGI, reported on 22.7% of returns)
Here:
$15,170
State:
$21,628
Here:
16.3% of AGI
State:
18.4% of AGI
(% of AGI for various income ranges: 8.6% for AGIs $25k-50k, 7.7% for AGIs $50k-75k, 9.4% for AGIs $75k-100k, 8.4% for AGIs $100k-200k)
Charity contributions: $1,917 (reported on 13.6% of returns)
Here:
$1,917
State:
$4,225
Taxes paid: $5,730 (reported on 22.7% of returns)
49248:
$5,730
State:
$8,327
(% of AGI for various income ranges: 2.4% for AGIs $25k-50k, 2.1% for AGIs $50k-75k, 3.5% for AGIs $75k-100k, 4.2% for AGIs $100k-200k)
Earned income credit: $2,171 (reported on 15.9% of returns)
Here:
$2,171
State:
$2,306
(% of AGI for various income ranges: 4.6% for AGIs below $25k, 1.2% for AGIs $25k-50k)
Percentage of individuals using paid preparers for their 2012 taxes: 65.9%
Here:
66%
State:
57%
(% for various income ranges: 52.6% for AGIs below $25k, 63.6% for AGIs $25k-50k, 83.3% for AGIs $50k-75k, 100.0% for AGIs $75k-100k, 75.0% for AGIs $100k-200k)
Averages for the 2004 tax year for zip code 49248, filed in 2005:
Average Adjusted Gross Income (AGI) in 2004: $37,746 (Individual Income Tax Returns)
Here:
$37,746
State:
$48,204
Salary/wage: $35,686 (reported on 85.3% of returns)
Here:
$35,686
State:
$42,791
(% of AGI for various income ranges: 84.4% for AGIs below $10k, 82.7% for AGIs $10k-25k, 86.9% for AGIs $25k-50k, 82.8% for AGIs $50k-75k, 85.0% for AGIs $75k-100k, 62.3% for AGIs over 100k)
Taxable interest for individuals: $905 (reported on 45.7% of returns)
This zip code:
$905
Michigan:
$1,725
(% of AGI for various income ranges: 9.6% for AGIs below $10k, 4.1% for AGIs $10k-25k, 1.0% for AGIs $25k-50k, 0.3% for AGIs $50k-75k, 0.2% for AGIs $75k-100k, 0.4% for AGIs over 100k)
Taxable dividends: $628 (reported on 18.8% of returns)
Here:
$628
State:
$3,420
(% of AGI for various income ranges: 1.4% for AGIs $10k-25k, 0.3% for AGIs $25k-50k, 0.1% for AGIs $50k-75k, 0.3% for AGIs $75k-100k)
Net capital gain/loss: +$292 (reported on 11.6% of returns)
Here:
+$292
State:
+$8,532
(% of AGI for various income ranges: 0.2% for AGIs below $10k, -1.1% for AGIs $10k-25k, 0.7% for AGIs $50k-75k)
Profit/loss from business: +$3,787 (reported on 11.4% of returns)
Here:
+$3,787
State:
+$9,547
Profit/loss from farming: +$1,840 (reported on 6.0% of returns)
Here:
+$1,840
State:
-$4,492
Total itemized deductions: $14,177 (22% of AGI, reported on 27.3% of returns)
Here:
$14,177
State:
$18,509
Here:
22.2% of AGI
State:
20.7% of AGI
(% of AGI for various income ranges: 16.4% for AGIs $10k-25k, 9.1% for AGIs $25k-50k, 8.9% for AGIs $50k-75k, 10.8% for AGIs $75k-100k, 11.4% for AGIs over 100k)
Charity contributions deductions: $2,556 (4% of AGI, reported on 21.7% of returns)
Here:
$2,556
State:
$3,365
Here:
3.9% of AGI
State:
3.6% of AGI
(% of AGI for various income ranges: 2.2% for AGIs $10k-25k, 1.0% for AGIs $25k-50k, 1.3% for AGIs $50k-75k, 1.4% for AGIs $75k-100k, 2.3% for AGIs over 100k)
Total tax: $4,771 (reported on 74.9% of returns)
49248:
$4,771
State:
$7,691
(% of AGI for various income ranges: 2.5% for AGIs below $10k, 4.1% for AGIs $10k-25k, 6.4% for AGIs $25k-50k, 8.7% for AGIs $50k-75k, 10.6% for AGIs $75k-100k, 17.7% for AGIs over 100k)
Earned income credit: $1,588 (reported on 12.3% of returns)
Here:
$1,588
State:
$1,737
Percentage of individuals using paid preparers for their 2004 taxes: 64.7%
Here:
65%
State:
60%
(% for various income ranges: 62.4% for AGIs below $10k, 64.9% for AGIs $10k-25k, 64.2% for AGIs $25k-50k, 65.7% for AGIs $50k-75k, 66.7% for AGIs $75k-100k, 71.4% for AGIs over 100k)
Household received Food Stamps/SNAP in the past 12 months: 10 Household did not receive Food Stamps/SNAP in the past 12 months: 338
Women who had a birth in the past 12 months: 19 (5 now married, 12 unmarried) Women who did not have a birth in the past 12 months: 164 (95 now married, 68 unmarried)
Housing units in zip code 49248 with a mortgage: 150 (16 second mortgage, 1 home equity loan, 12 both second mortgage and home equity loan) Houses without a mortgage: 11
Median monthly owner costs for units with a mortgage: $1,281 Median monthly owner costs for units without a mortgage: $534
Residents with income below the poverty level in 2022:
This zip code:
7.1%
Whole state:
13.4%
Residents with income below 50% of the poverty level in 2022:
This zip code:
4.6%
Whole state:
6.9%
Median number of rooms in houses and condos:
Here:
6.9
State:
6.5
Median number of rooms in apartments:
Here:
6.4
State:
4.3
Notable locations in this zip code not listed on our city pages
Cemeteries: Peebles Cemetery (1), Luke Farm Cemetery (2), Brock Cemetery (3), Reed Grave (4), Ridgeville Cemetery (5). Display/hide their locations on the map
Streams, rivers, and creeks: Walker Drain (A), Hall Drain (B), Holmes Drain (C), Jasper Drain (D), Abbott Drain (E), Knapp Drain (F), Morse Lord Drain (G), Raymond Drain (H), Nelson Drain (I). Display/hide their locations on the map
National Pollutant Discharge Elimination System NON-MAJOR (Tracking pollutant discharge elimination systems) - permit Business SIC classification: SEWERAGE SYSTEMS Organizations: FAIRFIELD TWP WWSL-JASPER (CONTACT/OWNER)
Alternative names: FAIRFIELD TWP WWSL-JASPER
FAIRFIELD TWP-JASPER SEC WWSL (4017 SUMMIT STREET in JASPER, MI)
National Pollutant Discharge Elimination System NON-MAJOR (Tracking pollutant discharge elimination systems) - permit Business SIC classification: SEWERAGE SYSTEMS
MI DEPT/TRANSPORTATION BRIDGE B02-46071 (M52 OVER BLACK CREEK in JASPER, MI)
Conditionally Exempt Small Quantity Generators, less than 100 kg/month of hazardous waste (Resource Conservation and Recovery Act (tracking hazardous waste)) Organizations: MICH DEPT OF TRANSPORTATION (CONTACT/OPERATOR)
Housing units lacking complete plumbing facilities: 2.7% Housing units lacking complete kitchen facilities: 4.9%
50.7%Utility gas
34.7%Bottled, tank, or LP gas
7.9%Fuel oil, kerosene, etc.
5.2%Wood
1.2%Electricity
0.9%Other fuel
Population in 1990: 1,240.
Place of birth for U.S.-born residents:
This state: 583
Northeast: 3
Midwest: 227
South: 21
West: 39
80% of the 49248 zip code residents lived in the same house 5 years ago. Out of people who lived in different houses, 60% lived in this county. Out of people who lived in different counties, 50% lived in Michigan.
88% of the 49248 zip code residents lived in the same house 1 year ago. Out of people who lived in different houses, 66% moved from this county. Out of people who lived in different houses, 17% moved from different county within same state. Out of people who lived in different houses, 13% moved from different state.
Private vs. public school enrollment:
Students in private schools in grades 1 to 8 (elementary and middle school): 4
Here:
14.7%
Michigan:
12.4%
Students in private schools in grades 9 to 12 (high school): 6
Here:
15.0%
Michigan:
9.8%
Students in private undergraduate colleges:
Here:
0.0%
Michigan:
14.9%
Occupation by median earnings in the past 12 months ($)
104,030Architecture and engineering occupations
86,045Health diagnosing and treating practitioners and other technical occupations
59,709Law enforcement workers including supervisors
57,589Business and financial operations occupations
57,166Installation, maintenance, and repair occupations
51,187Education, training, and library occupations
Top industries in this zip code by the number of employees in 2005:
Health Care and Social Assistance: Child Day Care Services (5-9 employees: 1 establishment)
Other Services (except Public Administration): Religious Organizations (1-4: 1)
Construction: Plumbing, Heating, and Air-Conditioning Contractors (1-4: 1)
Finance and Insurance: Insurance Agencies and Brokerages (1-4: 1)
Construction: Residential Remodelers (1-4: 1)
Administrative and Support and Waste Management and Remediation Services: Janitorial Services (1-4: 1)
Other Services (except Public Administration): Automotive Body, Paint, and Interior Repair and Maintenance (1-4: 1)
Construction: Roofing Contractors (1-4: 1)
People in group quarters in 2000:
10 people in unknown juvenile institutions
Fatal accident statistics in 2013:
Fatal accident count: 1
Vehicles involved in fatal accidents: 1
Fatal accidents caused by drunken drivers: 0
Fatalities: 1
Persons involved in fatal accidents: 1
Pedestrians involved in fatal accidents: 0
Home Mortgage Disclosure Act Aggregated Statistics For Year 2003 (Based on 2 partial tracts)
A) FHA, FSA/RHS & VA Home Purchase Loans
B) Conventional Home Purchase Loans
C) Refinancings
D) Home Improvement Loans
F) Non-occupant Loans on < 5 Family Dwellings (A B C & D)
Number
Average Value
Number
Average Value
Number
Average Value
Number
Average Value
Number
Average Value
LOANS ORIGINATED
1
$50,690
43
$96,643
97
$97,924
6
$26,623
5
$64,052
APPLICATIONS APPROVED, NOT ACCEPTED
2
$56,450
4
$96,575
12
$111,360
4
$12,288
0
$0
APPLICATIONS DENIED
2
$63,745
9
$64,000
54
$80,242
10
$51,149
2
$81,025
APPLICATIONS WITHDRAWN
1
$56,830
2
$112,895
20
$91,968
0
$0
0
$0
FILES CLOSED FOR INCOMPLETENESS
1
$65,280
1
$72,190
6
$80,768
0
$0
0
$0
Aggregated Statistics For Year 2002 (Based on 2 partial tracts)
A) FHA, FSA/RHS & VA Home Purchase Loans
B) Conventional Home Purchase Loans
C) Refinancings
D) Home Improvement Loans
F) Non-occupant Loans on < 5 Family Dwellings (A B C & D)
Number
Average Value
Number
Average Value
Number
Average Value
Number
Average Value
Number
Average Value
LOANS ORIGINATED
2
$107,135
14
$89,088
104
$100,822
5
$18,124
1
$36,100
APPLICATIONS APPROVED, NOT ACCEPTED
0
$0
2
$107,905
15
$111,616
2
$13,440
0
$0
APPLICATIONS DENIED
2
$81,410
5
$30,412
37
$88,403
4
$9,025
0
$0
APPLICATIONS WITHDRAWN
0
$0
1
$84,480
18
$96,341
1
$3,840
1
$84,480
FILES CLOSED FOR INCOMPLETENESS
1
$58,370
0
$0
9
$88,149
0
$0
0
$0
Aggregated Statistics For Year 2001 (Based on 2 partial tracts)
A) FHA, FSA/RHS & VA Home Purchase Loans
B) Conventional Home Purchase Loans
C) Refinancings
D) Home Improvement Loans
F) Non-occupant Loans on < 5 Family Dwellings (A B C & D)
Number
Average Value
Number
Average Value
Number
Average Value
Number
Average Value
Number
Average Value
LOANS ORIGINATED
5
$83,712
21
$91,429
80
$89,347
19
$22,353
2
$37,630
APPLICATIONS APPROVED, NOT ACCEPTED
0
$0
2
$37,630
9
$98,389
2
$77,570
0
$0
APPLICATIONS DENIED
2
$52,990
11
$51,875
41
$85,117
9
$18,261
1
$14,590
APPLICATIONS WITHDRAWN
1
$52,990
2
$38,400
18
$82,006
2
$19,585
1
$18,430
FILES CLOSED FOR INCOMPLETENESS
0
$0
0
$0
4
$91,585
0
$0
0
$0
Aggregated Statistics For Year 2000 (Based on 2 partial tracts)
A) FHA, FSA/RHS & VA Home Purchase Loans
B) Conventional Home Purchase Loans
C) Refinancings
D) Home Improvement Loans
F) Non-occupant Loans on < 5 Family Dwellings (A B C & D)
Number
Average Value
Number
Average Value
Number
Average Value
Number
Average Value
Number
Average Value
LOANS ORIGINATED
5
$86,630
18
$91,051
31
$80,442
10
$36,557
2
$24,960
APPLICATIONS APPROVED, NOT ACCEPTED
0
$0
3
$45,567
11
$65,629
2
$7,680
0
$0
APPLICATIONS DENIED
1
$57,600
17
$90,353
23
$64,479
8
$20,064
2
$27,650
APPLICATIONS WITHDRAWN
0
$0
1
$29,180
7
$58,149
3
$50,177
0
$0
FILES CLOSED FOR INCOMPLETENESS
0
$0
1
$87,550
2
$61,055
0
$0
0
$0
Aggregated Statistics For Year 1999 (Based on 1 partial tract)
A) FHA, FSA/RHS & VA Home Purchase Loans
B) Conventional Home Purchase Loans
C) Refinancings
D) Home Improvement Loans
F) Non-occupant Loans on < 5 Family Dwellings (A B C & D)
Detailed PMIC statistics for the following Tracts:0620.00
2002 - 2018 National Fire Incident Reporting System (NFIRS) incidents
According to the data from the years 2002 - 2018 the average number of fires per year is 9. The highest number of fire incidents - 22 took place in 2005, and the least - 4 in 2002. The data has a growing trend.
When looking into fire subcategories, the most incidents belonged to: Outside Fires (50.7%), and Structure Fires (32.2%).
Fire incident types reported to NFIRS in Zip Code 49248


+$1,840
-$4,492
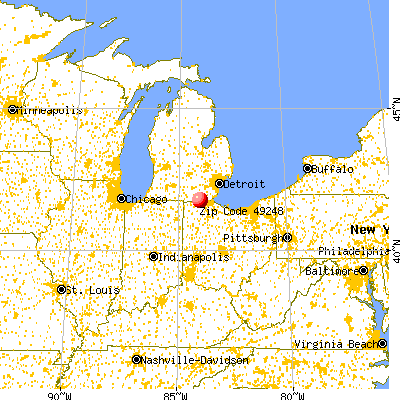
 Nearest zip codes: 43533, 49279, 49289, 43540, 49268, 49228.


 According to the data from the years 2002 - 2018 the average number of fires per year is 9. The highest number of fire incidents - 22 took place in 2005, and the least - 4 in 2002. The data has a growing trend.
 When looking into fire subcategories, the most incidents belonged to: Outside Fires (50.7%), and Structure Fires (32.2%).