Estimated zip code population in 2022: 1,854 Zip code population in 2010: 2,579 Zip code population in 2000: 2,349
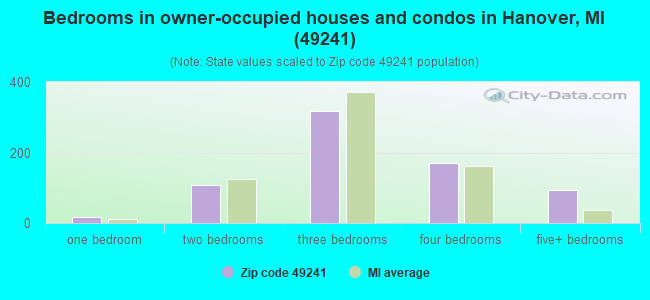
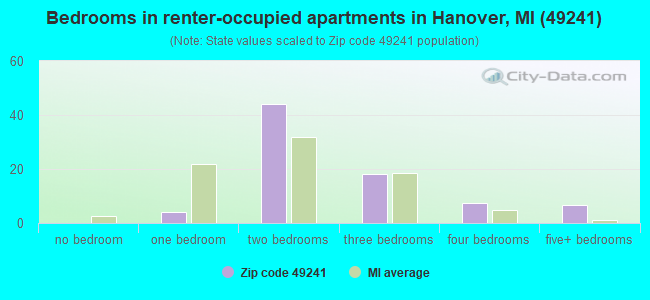
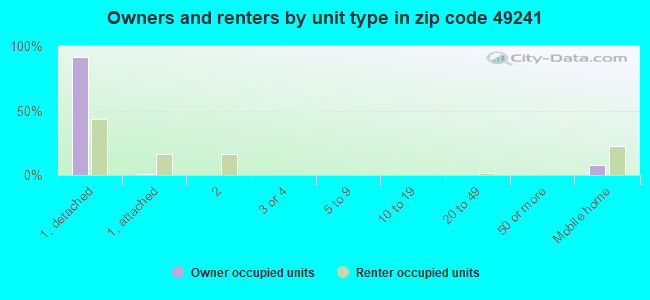
Houses and condos: 843 Renter-occupied apartments: 79
% of renters here:
10%
State:
27%
March 2022 cost of living index in zip code 49241: 81.2 (low, U.S. average is 100)
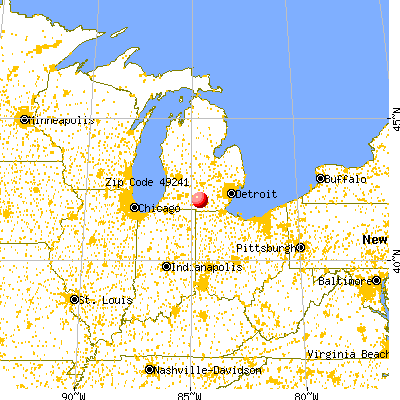
Land area: 34.0 sq. mi. Water area: 0.5 sq. mi.
Population density: 54 people per square mile
(very low).
OSM Map
General Map
Google Map
MSN Map
OSM Map
General Map
Google Map
MSN Map
OSM Map
General Map
Google Map
MSN Map
OSM Map
General Map
Google Map
MSN Map
Please wait while loading the map...
Real estate property taxes paid for housing units in 2022:
This zip code:
1.1% ($2,264)
Michigan:
1.2% ($2,746)
Median real estate property taxes paid for housing units with mortgages in 2022: $2,384 (1.1%) Median real estate property taxes paid for housing units with no mortgage in 2022: $2,011 (1.1%)
Business Search- 14 Million verified businesses
Males: 911
(49.1%)
Females: 943
(50.9%)
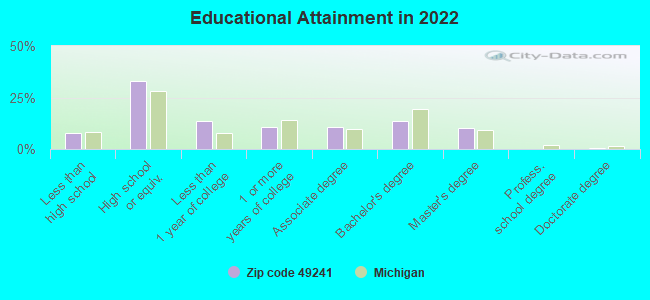
For population 25 years and over in 49241:
High school or higher: 91.4%
Bachelor's degree or higher: 24.3%
Graduate or professional degree: 10.9%
Unemployed: 1.5%
Mean travel time to work (commute): 30.9 minutes
For population 15 years and over in 49241:
Never married: 21.1%
Now married: 58.3%
Separated: 0.8%
Widowed: 7.3%
Divorced: 12.5%
Zip code 49241 compared to state average:
Unemployed percentage significantly below state average.
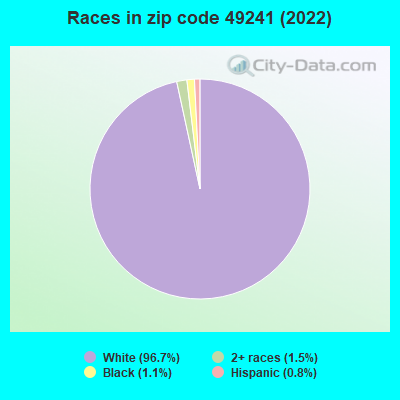
Black race population percentage significantly below state average.
Hispanic race population percentage significantly below state average.
Median age significantly above state average.
Foreign-born population percentage significantly below state average.
Renting percentage significantly below state average.
Length of stay since moving in significantly above state average.
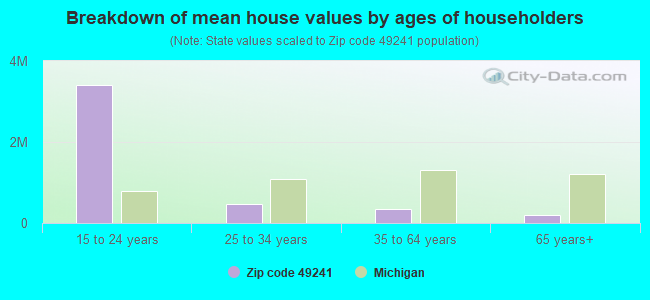
Estimated median house/condo value in 2022: $209,894
49241:
$209,894
Michigan:
$224,400
According to our research of Michigan and other state lists, there were 2 registered sex offenders living in 49241 zip code as of May 26, 2024. The ratio of all residents to sex offenders in zip code 49241 is 1,254 to 1. The ratio of registered sex offenders to all residents in this zip code is much lower than the state average.
Median resident age:
This zip code:
52.6 years
Michigan median age:
40.3 years
Average household size:
This zip code:
2.4 people
Michigan:
2.4 people
Averages for the 2020 tax year for zip code 49241, filed in 2021:
Average Adjusted Gross Income (AGI) in 2020: $54,995 (Individual Income Tax Returns)
Here:
$54,995
State:
$68,945
Salary/wage: $50,302 (reported on 78.7% of returns)
Here:
$50,302
State:
$57,142
(% of AGI for various income ranges: 995.7% for AGIs below $25k, 3302.7% for AGIs $25k-50k, 5856.9% for AGIs $50k-75k, 10341.4% for AGIs $75k-100k, 16680.0% for AGIs $100k-200k)
Taxable interest for individuals: $626 (reported on 25.0% of returns)
This zip code:
$626
Michigan:
$1,630
(% of AGI for various income ranges: 19.1% for AGIs below $25k, 7.7% for AGIs $25k-50k, 17.7% for AGIs $50k-75k, 37.1% for AGIs $75k-100k, 53.6% for AGIs $100k-200k)
Ordinary dividends: $3,256 (reported on 14.8% of returns)
Here:
$3,256
State:
$6,972
(% of AGI for various income ranges: 34.8% for AGIs below $25k, 10.9% for AGIs $25k-50k, 90.8% for AGIs $50k-75k, 271.8% for AGIs $100k-200k)
Net capital gain/loss in AGI: +$5,683 (reported on 11.1% of returns)
Here:
+$5,683
State:
+$20,064
(% of AGI for various income ranges: 23.5% for AGIs below $25k, 29.1% for AGIs $25k-50k, 100.8% for AGIs $50k-75k, 393.6% for AGIs $100k-200k)
Profit/loss from business: +$11,227 (reported on 13.9% of returns)
Here:
+$11,227
State:
+$11,172
(% of AGI for various income ranges: 110.4% for AGIs below $25k, 125.9% for AGIs $25k-50k, 633.1% for AGIs $50k-75k, 300.0% for AGIs $100k-200k)
Taxable individual retirement arrangement distribution: $16,400 (reported on 8.3% of returns)
49241:
$16,400
Michigan:
$19,803
(% of AGI for various income ranges: 229.1% for AGIs below $25k, 224.6% for AGIs $50k-75k, 938.6% for AGIs $75k-100k)
Total itemized deductions: $27,600 (reported on 1.9% of returns)
Here:
$27,600
State:
$34,117
(% of AGI for various income ranges: 424.6% for AGIs $50k-75k)
Taxes paid: $8,650 (reported on 1.9% of returns)
49241:
$8,650
State:
$7,972
(% of AGI for various income ranges: 133.1% for AGIs $50k-75k)
Earned income credit: $1,962 (reported on 12.0% of returns)
Here:
$1,962
State:
$2,251
(% of AGI for various income ranges: 49.6% for AGIs below $25k, 64.1% for AGIs $25k-50k)
Percentage of individuals using paid preparers for their 2020 taxes: 92.6%
Here:
93%
State:
93%
(% for various income ranges: 91.2% for AGIs below $25k, 92.9% for AGIs $25k-50k, 94.4% for AGIs $50k-75k, 90.9% for AGIs $75k-100k, 94.1% for AGIs $100k-200k)
Averages for the 2012 tax year for zip code 49241, filed in 2013:
Average Adjusted Gross Income (AGI) in 2012: $44,305 (Individual Income Tax Returns)
Here:
$44,305
State:
$55,609
Salary/wage: $40,001 (reported on 82.7% of returns)
Here:
$40,001
State:
$46,782
(% of AGI for various income ranges: 66.4% for AGIs below $25k, 77.0% for AGIs $25k-50k, 82.4% for AGIs $50k-75k, 79.3% for AGIs $75k-100k, 66.2% for AGIs $100k-200k)
Taxable interest for individuals: $619 (reported on 29.1% of returns)
This zip code:
$619
Michigan:
$1,491
(% of AGI for various income ranges: 1.2% for AGIs below $25k, 0.7% for AGIs $25k-50k, 0.1% for AGIs $50k-75k, 0.1% for AGIs $75k-100k, 0.3% for AGIs $100k-200k)
Ordinary dividends: $2,400 (reported on 15.5% of returns)
Here:
$2,400
State:
$6,225
(% of AGI for various income ranges: 0.8% for AGIs below $25k, 0.3% for AGIs $25k-50k, 0.3% for AGIs $50k-75k, 1.4% for AGIs $75k-100k, 1.3% for AGIs $100k-200k)
Net capital gain/loss in AGI: +$5,840 (reported on 9.1% of returns)
Here:
+$5,840
State:
+$9,326
(% of AGI for various income ranges: 0.2% for AGIs $25k-50k, 0.3% for AGIs $50k-75k, 4.1% for AGIs $100k-200k)
Profit/loss from business: +$8,107 (reported on 13.6% of returns)
Here:
+$8,107
State:
+$11,523
(% of AGI for various income ranges: 5.4% for AGIs below $25k, 5.2% for AGIs $25k-50k, 1.7% for AGIs $50k-75k, 2.4% for AGIs $75k-100k)
Taxable individual retirement arrangement distribution: $15,610 (reported on 9.1% of returns)
49241:
$15,610
Michigan:
$15,298
(% of AGI for various income ranges: 4.2% for AGIs below $25k, 5.2% for AGIs $25k-50k, 8.5% for AGIs $75k-100k)
Total itemized deductions: $18,262 (22% of AGI, reported on 23.6% of returns)
Here:
$18,262
State:
$21,628
Here:
22.1% of AGI
State:
18.4% of AGI
(% of AGI for various income ranges: 5.0% for AGIs below $25k, 5.8% for AGIs $25k-50k, 9.9% for AGIs $50k-75k, 10.9% for AGIs $75k-100k, 13.8% for AGIs $100k-200k)
Charity contributions: $2,300 (reported on 15.5% of returns)
Here:
$2,300
State:
$4,225
(% of AGI for various income ranges: 1.0% for AGIs below $25k, 1.1% for AGIs $50k-75k, 0.7% for AGIs $75k-100k, 1.1% for AGIs $100k-200k)
Taxes paid: $6,172 (reported on 22.7% of returns)
49241:
$6,172
State:
$8,327
(% of AGI for various income ranges: 2.2% for AGIs $25k-50k, 2.9% for AGIs $50k-75k, 3.7% for AGIs $75k-100k, 5.1% for AGIs $100k-200k)
Earned income credit: $1,915 (reported on 18.2% of returns)
Here:
$1,915
State:
$2,306
(% of AGI for various income ranges: 5.0% for AGIs below $25k, 1.1% for AGIs $25k-50k)
Percentage of individuals using paid preparers for their 2012 taxes: 56.4%
Here:
56%
State:
57%
(% for various income ranges: 50.0% for AGIs below $25k, 55.6% for AGIs $25k-50k, 61.1% for AGIs $50k-75k, 63.6% for AGIs $75k-100k, 75.0% for AGIs $100k-200k)
Averages for the 2004 tax year for zip code 49241, filed in 2005:
Average Adjusted Gross Income (AGI) in 2004: $36,578 (Individual Income Tax Returns)
Here:
$36,578
State:
$48,204
Salary/wage: $35,240 (reported on 85.4% of returns)
Here:
$35,240
State:
$42,791
(% of AGI for various income ranges: 120.4% for AGIs below $10k, 71.2% for AGIs $10k-25k, 83.1% for AGIs $25k-50k, 86.9% for AGIs $50k-75k, 86.0% for AGIs $75k-100k, 71.5% for AGIs over 100k)
Taxable interest for individuals: $1,039 (reported on 39.2% of returns)
This zip code:
$1,039
Michigan:
$1,725
(% of AGI for various income ranges: 4.2% for AGIs below $10k, 2.3% for AGIs $10k-25k, 1.0% for AGIs $25k-50k, 0.5% for AGIs $50k-75k, 0.5% for AGIs $75k-100k, 1.9% for AGIs over 100k)
Taxable dividends: $1,023 (reported on 15.9% of returns)
Here:
$1,023
State:
$3,420
(% of AGI for various income ranges: 1.5% for AGIs below $10k, 1.3% for AGIs $10k-25k, 0.3% for AGIs $25k-50k, 0.4% for AGIs $50k-75k, 0.1% for AGIs $75k-100k, 0.4% for AGIs over 100k)
Net capital gain/loss: +$5,514 (reported on 12.5% of returns)
Here:
+$5,514
State:
+$8,532
(% of AGI for various income ranges: -2.0% for AGIs below $10k, 0.1% for AGIs $10k-25k, 1.0% for AGIs $25k-50k, 0.9% for AGIs $50k-75k, 0.2% for AGIs $75k-100k, 9.1% for AGIs over 100k)
Profit/loss from business: +$5,798 (reported on 15.7% of returns)
Here:
+$5,798
State:
+$9,547
(% of AGI for various income ranges: 4.9% for AGIs below $10k, 6.4% for AGIs $10k-25k, 3.0% for AGIs $25k-50k, 2.6% for AGIs $50k-75k, 0.6% for AGIs $75k-100k)
IRA payment deduction: $3,111 (reported on 1.6% of returns)
49241:
$3,111
Michigan:
$2,875
Total itemized deductions: $14,928 (23% of AGI, reported on 27.5% of returns)
Here:
$14,928
State:
$18,509
Here:
23.3% of AGI
State:
20.7% of AGI
(% of AGI for various income ranges: 8.9% for AGIs $10k-25k, 9.2% for AGIs $25k-50k, 12.0% for AGIs $50k-75k, 12.8% for AGIs $75k-100k, 14.8% for AGIs over 100k)
Charity contributions deductions: $1,648 (2% of AGI, reported on 19.5% of returns)
Here:
$1,648
State:
$3,365
Here:
2.4% of AGI
State:
3.6% of AGI
(% of AGI for various income ranges: 0.7% for AGIs $10k-25k, 0.7% for AGIs $25k-50k, 0.5% for AGIs $50k-75k, 1.0% for AGIs $75k-100k, 2.0% for AGIs over 100k)
Total tax: $4,249 (reported on 72.8% of returns)
49241:
$4,249
State:
$7,691
(% of AGI for various income ranges: 2.0% for AGIs below $10k, 4.5% for AGIs $10k-25k, 6.2% for AGIs $25k-50k, 8.3% for AGIs $50k-75k, 10.4% for AGIs $75k-100k, 14.5% for AGIs over 100k)
Earned income credit: $1,642 (reported on 15.7% of returns)
Here:
$1,642
State:
$1,737
Percentage of individuals using paid preparers for their 2004 taxes: 57.6%
Here:
58%
State:
60%
(% for various income ranges: 44.6% for AGIs below $10k, 59.3% for AGIs $10k-25k, 61.9% for AGIs $25k-50k, 59.3% for AGIs $50k-75k, 64.9% for AGIs $75k-100k, 65.2% for AGIs over 100k)
Household received Food Stamps/SNAP in the past 12 months: 71 Household did not receive Food Stamps/SNAP in the past 12 months: 710
Women who had a birth in the past 12 months: 12 (6 now married, 5 unmarried) Women who did not have a birth in the past 12 months: 302 (139 now married, 162 unmarried)
Housing units in zip code 49241 with a mortgage: 360 (53 second mortgage, 44 both second mortgage and home equity loan) Houses without a mortgage: 89
Median monthly owner costs for units with a mortgage: $1,166 Median monthly owner costs for units without a mortgage: $533
Residents with income below the poverty level in 2022:
This zip code:
7.8%
Whole state:
13.4%
Residents with income below 50% of the poverty level in 2022:
This zip code:
5.2%
Whole state:
6.9%
Median number of rooms in houses and condos:
Here:
6.7
State:
6.5
Median number of rooms in apartments:
Here:
5.0
State:
4.3
Notable locations in this zip code not listed on our city pages
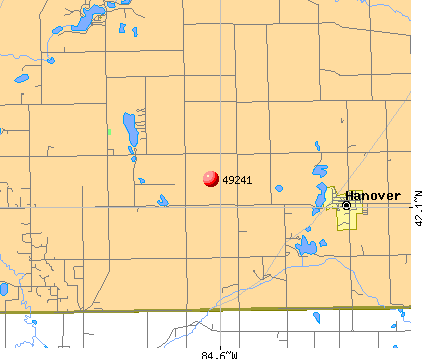
Notable locations in zip code 49241: Twin Pine Campground (A), Jackson District Library-Hanover Branch (B), Hanover Township Fire Department Station 1 Headquarters (C), Pulaski Township Fire Department (D). Display/hide their locations on the map
Parks in zip code 49241 include: Hanover High School Historical Marker (1), Hanover-Horton Schools Historical Marker (2). Display/hide their locations on the map
220 married couples with children.
72 single-parent households (7 men, 65 women).
98.3% of residents of 49241 zip code speak English at home.
0.5% of residents speak Spanish at home (100% very well).
1.6% of residents speak other Indo-European language at home (93% very well, 7% well).
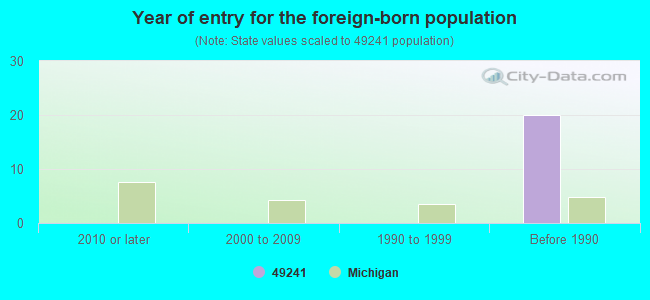
Foreign born population: 0 (0.0%)
:
0.0%
Whole state:
6.9%
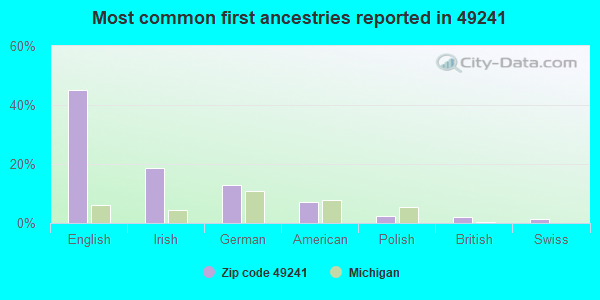
45%English
19%Irish
13%German
7%American
2%Polish
2%British
1%Swiss
Year of entry for the foreign-born population
02010 or later
02000 to 2009
01990 to 1999
20Before 1990
Facilities with environmental interests located in this zip code:
HANOVER-HORTON ELEMENTARY SCHOOL (131 FAIRVIEW in HANOVER, MI)
(National Center for Education Statistics) - STATE ID-07630 Organizations: HANOVER-HORTON SCHOOLS (SCHOOL DISTRICT)
CONSUMERS ENERGY (11189 WATSON RD in HANOVER, MI)
(Resource Conservation and Recovery Act (tracking hazardous waste))
Housing units lacking complete plumbing facilities: 4.8% Housing units lacking complete kitchen facilities: 4.6%
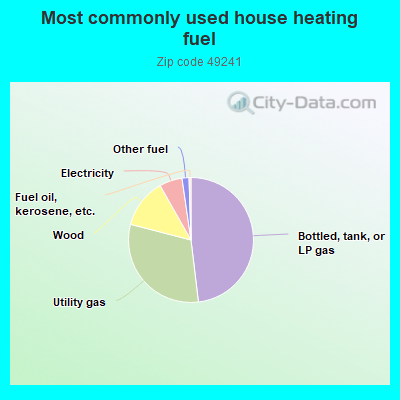
48.2%Bottled, tank, or LP gas
31.0%Utility gas
12.8%Wood
5.9%Electricity
1.8%Other fuel
0.5%Fuel oil, kerosene, etc.
Population in 1990: 2,809.
Place of birth for U.S.-born residents:
This state: 1,576
Northeast: 29
Midwest: 89
South: 86
West: 50
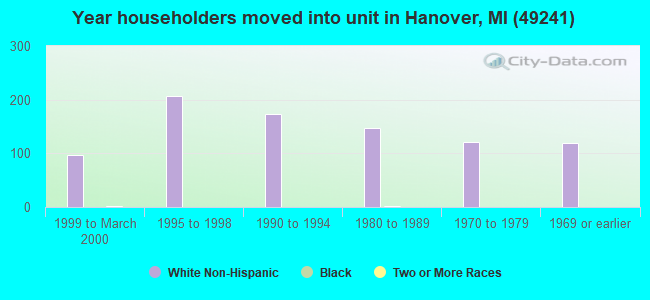
68% of the 49241 zip code residents lived in the same house 5 years ago. Out of people who lived in different houses, 72% lived in this county. Out of people who lived in different counties, 50% lived in Michigan.
94% of the 49241 zip code residents lived in the same house 1 year ago. Out of people who lived in different houses, 54% moved from this county. Out of people who lived in different houses, 22% moved from different county within same state. Out of people who lived in different houses, 24% moved from different state.
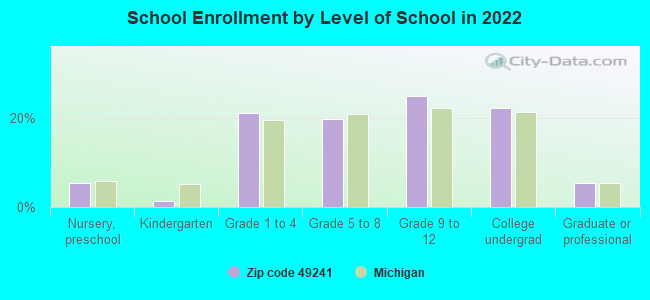
Private vs. public school enrollment:
Students in private schools in grades 1 to 8 (elementary and middle school):
Here:
0.0%
Michigan:
12.4%
Students in private schools in grades 9 to 12 (high school): 3
Here:
3.4%
Michigan:
9.8%
Students in private undergraduate colleges: 24
Here:
30.2%
Michigan:
14.9%
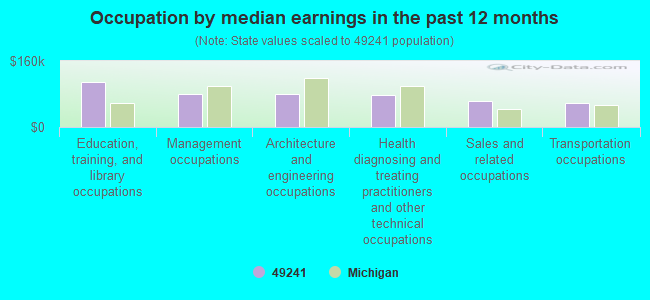
Occupation by median earnings in the past 12 months ($)
110,003Education, training, and library occupations
80,905Management occupations
79,490Architecture and engineering occupations
78,404Health diagnosing and treating practitioners and other technical occupations
63,799Sales and related occupations
58,457Transportation occupations
Top industries in this zip code by the number of employees in 2005:
Health Care and Social Assistance: Home Health Care Services (20-49 employees: 1 establishment)
Construction: Commercial and Institutional Building Construction (20-49: 1)
Administrative and Support and Waste Management and Remediation Services: Landscaping Services (10-19: 1, 1-4: 1)
Accommodation and Food Services: Full-Service Restaurants (10-19: 1)
Accommodation and Food Services: Drinking Places (Alcoholic Beverages) (5-9: 1)
Construction: All Other Specialty Trade Contractors (5-9: 1)
People in group quarters in 2000:
7 people in agriculture workers' dormitories on farms
Fatal accident statistics in 2013:
Fatal accident count: 1
Vehicles involved in fatal accidents: 1
Fatal accidents caused by drunken drivers: 0
Fatalities: 1
Persons involved in fatal accidents: 1
Pedestrians involved in fatal accidents: 0
Home Mortgage Disclosure Act Aggregated Statistics For Year 2009 (Based on 2 partial tracts)
A) FHA, FSA/RHS & VA Home Purchase Loans
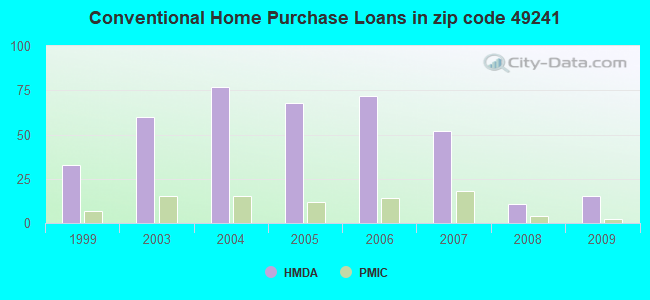
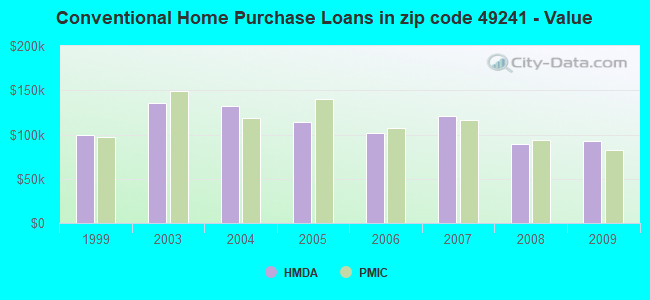
B) Conventional Home Purchase Loans
C) Refinancings
D) Home Improvement Loans
F) Non-occupant Loans on < 5 Family Dwellings (A B C & D)
G) Loans On Manufactured Home Dwelling (A B C & D)
Number
Average Value
Number
Average Value
Number
Average Value
Number
Average Value
Number
Average Value
Number
Average Value
LOANS ORIGINATED
17
$103,892
15
$92,684
113
$134,895
8
$37,509
13
$105,939
7
$87,597
APPLICATIONS APPROVED, NOT ACCEPTED
3
$95,947
2
$49,740
18
$136,353
1
$1,630
1
$65,230
2
$56,265
APPLICATIONS DENIED
3
$107,903
4
$91,528
42
$156,071
7
$23,064
8
$172,458
2
$112,525
APPLICATIONS WITHDRAWN
3
$95,947
1
$35,880
29
$123,603
8
$25,481
2
$178,980
0
$0
FILES CLOSED FOR INCOMPLETENESS
0
$0
0
$0
0
$0
0
$0
0
$0
0
$0
Aggregated Statistics For Year 2008 (Based on 2 partial tracts)
A) FHA, FSA/RHS & VA Home Purchase Loans
B) Conventional Home Purchase Loans
C) Refinancings
D) Home Improvement Loans
F) Non-occupant Loans on < 5 Family Dwellings (A B C & D)
G) Loans On Manufactured Home Dwelling (A B C & D)
Number
Average Value
Number
Average Value
Number
Average Value
Number
Average Value
Number
Average Value
Number
Average Value
LOANS ORIGINATED
21
$96,256
11
$89,545
82
$123,334
15
$54,849
6
$128,697
6
$92,955
APPLICATIONS APPROVED, NOT ACCEPTED
5
$79,420
5
$110,894
15
$93,717
3
$33,977
1
$88,880
4
$83,375
APPLICATIONS DENIED
5
$92,956
12
$44,032
53
$131,787
11
$30,318
6
$58,165
10
$65,558
APPLICATIONS WITHDRAWN
2
$172,865
3
$121,767
23
$136,774
10
$31,882
1
$58,710
0
$0
FILES CLOSED FOR INCOMPLETENESS
0
$0
1
$71,760
3
$139,707
2
$17,940
0
$0
0
$0
Aggregated Statistics For Year 2007 (Based on 2 partial tracts)
A) FHA, FSA/RHS & VA Home Purchase Loans
B) Conventional Home Purchase Loans
C) Refinancings
D) Home Improvement Loans
F) Non-occupant Loans on < 5 Family Dwellings (A B C & D)
G) Loans On Manufactured Home Dwelling (A B C & D)
Number
Average Value
Number
Average Value
Number
Average Value
Number
Average Value
Number
Average Value
Number
Average Value
LOANS ORIGINATED
7
$104,604
52
$120,946
112
$113,654
28
$38,673
13
$115,097
11
$107,559
APPLICATIONS APPROVED, NOT ACCEPTED
1
$94,590
8
$127,814
17
$126,579
4
$14,270
0
$0
2
$125,570
APPLICATIONS DENIED
7
$101,459
14
$92,781
85
$129,438
19
$44,075
6
$94,450
9
$57,078
APPLICATIONS WITHDRAWN
2
$65,640
5
$86,106
37
$121,935
7
$40,653
1
$120,680
1
$157,370
FILES CLOSED FOR INCOMPLETENESS
1
$71,760
4
$94,995
7
$171,467
1
$8,970
1
$105,190
0
$0
Aggregated Statistics For Year 2006 (Based on 2 partial tracts)
A) FHA, FSA/RHS & VA Home Purchase Loans
B) Conventional Home Purchase Loans
C) Refinancings
D) Home Improvement Loans
E) Loans on Dwellings For 5+ Families
F) Non-occupant Loans on < 5 Family Dwellings (A B C & D)
G) Loans On Manufactured Home Dwelling (A B C & D)
Number
Average Value
Number
Average Value
Number
Average Value
Number
Average Value
Number
Average Value
Number
Average Value
Number
Average Value
LOANS ORIGINATED
10
$108,856
72
$101,415
163
$117,263
34
$57,246
1
$58,710
11
$179,833
19
$79,008
APPLICATIONS APPROVED, NOT ACCEPTED
1
$64,420
10
$85,209
25
$117,352
4
$21,200
0
$0
1
$89,690
5
$64,742
APPLICATIONS DENIED
2
$112,935
16
$104,982
134
$112,641
21
$62,708
0
$0
3
$81,813
11
$81,911
APPLICATIONS WITHDRAWN
1
$121,490
10
$88,145
48
$138,924
11
$90,139
0
$0
1
$114,160
5
$117,418
FILES CLOSED FOR INCOMPLETENESS
0
$0
2
$152,480
21
$133,027
1
$81,540
0
$0
1
$67,680
0
$0
Aggregated Statistics For Year 2005 (Based on 2 partial tracts)
A) FHA, FSA/RHS & VA Home Purchase Loans
B) Conventional Home Purchase Loans
C) Refinancings
D) Home Improvement Loans
F) Non-occupant Loans on < 5 Family Dwellings (A B C & D)
G) Loans On Manufactured Home Dwelling (A B C & D)
Number
Average Value
Number
Average Value
Number
Average Value
Number
Average Value
Number
Average Value
Number
Average Value
LOANS ORIGINATED
7
$102,507
68
$113,784
171
$124,751
32
$55,651
14
$140,424
13
$76,083
APPLICATIONS APPROVED, NOT ACCEPTED
2
$156,555
20
$76,362
38
$134,326
3
$47,293
3
$212,003
9
$77,463
APPLICATIONS DENIED
2
$155,335
24
$96,489
169
$114,166
20
$47,130
8
$134,846
20
$85,494
APPLICATIONS WITHDRAWN
0
$0
15
$86,269
74
$131,356
3
$131,007
3
$151,937
3
$92,957
FILES CLOSED FOR INCOMPLETENESS
0
$0
5
$88,226
48
$134,218
2
$101,110
2
$84,800
0
$0
Aggregated Statistics For Year 2004 (Based on 2 partial tracts)
A) FHA, FSA/RHS & VA Home Purchase Loans
B) Conventional Home Purchase Loans
C) Refinancings
D) Home Improvement Loans
F) Non-occupant Loans on < 5 Family Dwellings (A B C & D)
G) Loans On Manufactured Home Dwelling (A B C & D)
Number
Average Value
Number
Average Value
Number
Average Value
Number
Average Value
Number
Average Value
Number
Average Value
LOANS ORIGINATED
10
$96,217
77
$131,735
198
$112,472
34
$55,759
15
$177,811
26
$75,518
APPLICATIONS APPROVED, NOT ACCEPTED
1
$106,820
15
$123,180
32
$113,137
5
$18,102
2
$166,750
10
$74,038
APPLICATIONS DENIED
1
$38,320
33
$86,309
108
$109,475
15
$50,337
7
$94,237
17
$74,105
APPLICATIONS WITHDRAWN
0
$0
5
$84,802
64
$109,009
7
$32,616
1
$192,430
3
$98,120
FILES CLOSED FOR INCOMPLETENESS
0
$0
3
$103,283
34
$121,830
0
$0
0
$0
1
$79,910
Aggregated Statistics For Year 2003 (Based on 2 partial tracts)
A) FHA, FSA/RHS & VA Home Purchase Loans
B) Conventional Home Purchase Loans
C) Refinancings
D) Home Improvement Loans
F) Non-occupant Loans on < 5 Family Dwellings (A B C & D)
Number
Average Value
Number
Average Value
Number
Average Value
Number
Average Value
Number
Average Value
LOANS ORIGINATED
10
$110,405
60
$135,601
411
$113,323
29
$41,529
19
$105,315
APPLICATIONS APPROVED, NOT ACCEPTED
1
$96,220
2
$132,095
51
$117,306
2
$8,970
0
$0
APPLICATIONS DENIED
2
$105,185
18
$110,169
161
$109,051
11
$42,697
6
$123,125
APPLICATIONS WITHDRAWN
0
$0
5
$111,220
54
$116,995
2
$80,725
0
$0
FILES CLOSED FOR INCOMPLETENESS
0
$0
1
$73,390
13
$130,025
0
$0
0
$0
Aggregated Statistics For Year 1999 (Based on 1 partial tract)
A) FHA, FSA/RHS & VA Home Purchase Loans
B) Conventional Home Purchase Loans
C) Refinancings
D) Home Improvement Loans
F) Non-occupant Loans on < 5 Family Dwellings (A B C & D)
Detailed PMIC statistics for the following Tracts:0064.02
2002 - 2018 National Fire Incident Reporting System (NFIRS) incidents
According to the data from the years 2002 - 2018 the average number of fires per year is 14. The highest number of fire incidents - 37 took place in 2017, and the least - 5 in 2006. The data has a dropping trend.
When looking into fire subcategories, the most incidents belonged to: Structure Fires (45.9%), and Outside Fires (29.3%).
Fire incident types reported to NFIRS in Zip Code 49241


 Nearest zip codes: 49237, 49250, 49246, 49283, 49249, 49252.


 According to the data from the years 2002 - 2018 the average number of fires per year is 14. The highest number of fire incidents - 37 took place in 2017, and the least - 5 in 2006. The data has a dropping trend.
 When looking into fire subcategories, the most incidents belonged to: Structure Fires (45.9%), and Outside Fires (29.3%).