Estimated zip code population in 2022: 3,262 Zip code population in 2010: 3,083 Zip code population in 2000: 3,452
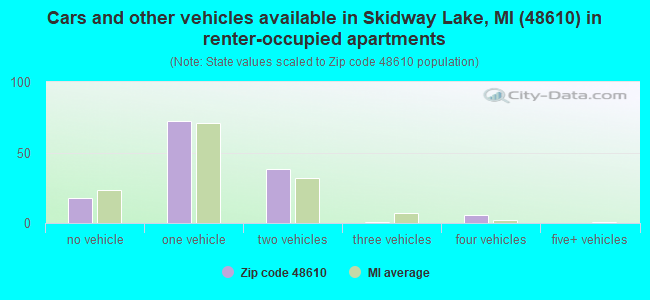
Houses and condos: 2,718 Renter-occupied apartments: 135
% of renters here:
9%
State:
27%
March 2022 cost of living index in zip code 48610: 80.7 (low, U.S. average is 100)
Land area: 117.5 sq. mi. Water area: 1.5 sq. mi.
Population density: 28 people per square mile
(very low).
OSM Map
General Map
Google Map
MSN Map
OSM Map
General Map
Google Map
MSN Map
OSM Map
General Map
Google Map
MSN Map
OSM Map
General Map
Google Map
MSN Map
Please wait while loading the map...
Real estate property taxes paid for housing units in 2022:
This zip code:
1.0% ($1,281)
Michigan:
1.2% ($2,746)
Median real estate property taxes paid for housing units with mortgages in 2022: $1,352 (1.0%) Median real estate property taxes paid for housing units with no mortgage in 2022: $1,186 (1.0%)
Business Search- 14 Million verified businesses
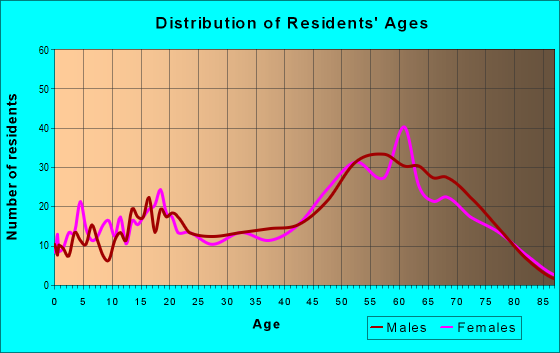
Males: 1,607
(49.3%)
Females: 1,654
(50.7%)
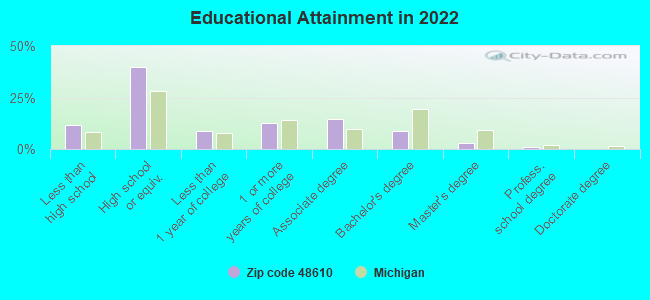
For population 25 years and over in 48610:
High school or higher: 87.7%
Bachelor's degree or higher: 12.8%
Graduate or professional degree: 4.2%
Unemployed: 8.8%
Mean travel time to work (commute): 28.6 minutes
For population 15 years and over in 48610:
Never married: 25.3%
Now married: 49.3%
Separated: 1.1%
Widowed: 6.3%
Divorced: 17.9%
Zip code 48610 compared to state average:
Median house value below state average.
Unemployed percentage above state average.
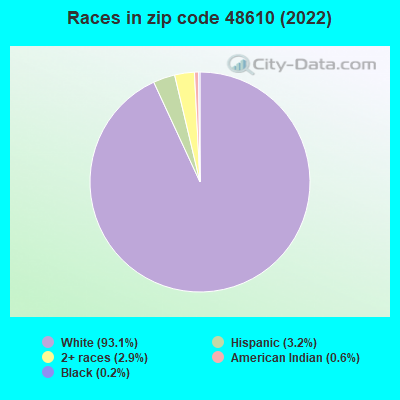
Black race population percentage significantly below state average.
Median age significantly above state average.
Foreign-born population percentage significantly below state average.
Renting percentage significantly below state average.
House age below state average.
Number of college students below state average.
Percentage of population with a bachelor's degree or higher below state average.
Averages for the 2020 tax year for zip code 48610, filed in 2021:
Average Adjusted Gross Income (AGI) in 2020: $44,132 (Individual Income Tax Returns)
Here:
$44,132
State:
$68,945
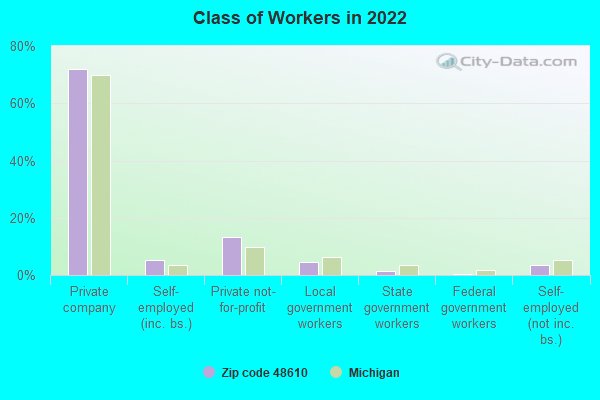
Salary/wage: $38,283 (reported on 69.5% of returns)
Here:
$38,283
State:
$57,142
(% of AGI for various income ranges: 822.6% for AGIs below $25k, 2660.6% for AGIs $25k-50k, 4914.1% for AGIs $50k-75k, 7733.3% for AGIs $75k-100k, 14053.3% for AGIs $100k-200k)
Taxable interest for individuals: $707 (reported on 27.8% of returns)
This zip code:
$707
Michigan:
$1,630
(% of AGI for various income ranges: 17.9% for AGIs below $25k, 17.3% for AGIs $25k-50k, 26.5% for AGIs $50k-75k, 36.7% for AGIs $75k-100k, 96.7% for AGIs $100k-200k)
Ordinary dividends: $1,550 (reported on 11.9% of returns)
Here:
$1,550
State:
$6,972
(% of AGI for various income ranges: 10.2% for AGIs below $25k, 22.7% for AGIs $25k-50k, 30.0% for AGIs $50k-75k, 80.0% for AGIs $75k-100k, 42.2% for AGIs $100k-200k)
Net capital gain/loss in AGI: +$2,700 (reported on 11.3% of returns)
Here:
+$2,700
State:
+$20,064
(% of AGI for various income ranges: 8.8% for AGIs below $25k, 20.3% for AGIs $25k-50k, 47.6% for AGIs $50k-75k, 91.1% for AGIs $75k-100k, 213.3% for AGIs $100k-200k)
Profit/loss from business: +$5,069 (reported on 8.6% of returns)
Here:
+$5,069
State:
+$11,172
(% of AGI for various income ranges: 62.6% for AGIs below $25k, 62.1% for AGIs $25k-50k, 42.9% for AGIs $50k-75k, 131.1% for AGIs $75k-100k)
Taxable individual retirement arrangement distribution: $15,250 (reported on 11.9% of returns)
48610:
$15,250
Michigan:
$19,803
(% of AGI for various income ranges: 72.1% for AGIs below $25k, 167.3% for AGIs $25k-50k, 592.9% for AGIs $50k-75k, 980.0% for AGIs $100k-200k)
Total itemized deductions: $33,100 (reported on 1.3% of returns)
Here:
$33,100
State:
$34,117
(% of AGI for various income ranges: 200.6% for AGIs $25k-50k)
Earned income credit: $1,927 (reported on 17.2% of returns)
Here:
$1,927
State:
$2,251
(% of AGI for various income ranges: 67.1% for AGIs below $25k, 66.4% for AGIs $25k-50k)
Percentage of individuals using paid preparers for their 2020 taxes: 92.7%
Here:
93%
State:
93%
(% for various income ranges: 91.8% for AGIs below $25k, 92.9% for AGIs $25k-50k, 90.9% for AGIs $50k-75k, 100.0% for AGIs $75k-100k, 92.9% for AGIs $100k-200k)
Averages for the 2012 tax year for zip code 48610, filed in 2013:
Average Adjusted Gross Income (AGI) in 2012: $33,317 (Individual Income Tax Returns)
Here:
$33,317
State:
$55,609
Salary/wage: $25,114 (reported on 76.2% of returns)
Here:
$25,114
State:
$46,782
(% of AGI for various income ranges: 58.7% for AGIs below $25k, 59.5% for AGIs $25k-50k, 60.7% for AGIs $50k-75k, 50.2% for AGIs $75k-100k, 55.5% for AGIs $100k-200k)
Taxable interest for individuals: $660 (reported on 32.9% of returns)
This zip code:
$660
Michigan:
$1,491
(% of AGI for various income ranges: 1.1% for AGIs below $25k, 0.8% for AGIs $25k-50k, 0.6% for AGIs $50k-75k, 0.3% for AGIs $75k-100k, 0.3% for AGIs $100k-200k)
Ordinary dividends: $2,005 (reported on 13.3% of returns)
Here:
$2,005
State:
$6,225
(% of AGI for various income ranges: 1.1% for AGIs below $25k, 1.2% for AGIs $25k-50k, 0.8% for AGIs $50k-75k, 0.7% for AGIs $75k-100k)
Net capital gain/loss in AGI: +$15 (reported on 9.1% of returns)
Here:
+$15
State:
+$9,326
(% of AGI for various income ranges: 0.3% for AGIs $25k-50k)
Profit/loss from business: +$5,013 (reported on 10.5% of returns)
Here:
+$5,013
State:
+$11,523
(% of AGI for various income ranges: 5.0% for AGIs below $25k, 1.6% for AGIs $25k-50k, 0.9% for AGIs $50k-75k)
Taxable individual retirement arrangement distribution: $12,650 (reported on 11.2% of returns)
48610:
$12,650
Michigan:
$15,298
(% of AGI for various income ranges: 2.9% for AGIs below $25k, 3.1% for AGIs $25k-50k, 4.9% for AGIs $50k-75k, 11.4% for AGIs $75k-100k)
Total itemized deductions: $16,456 (27% of AGI, reported on 17.5% of returns)
Here:
$16,456
State:
$21,628
Here:
27.4% of AGI
State:
18.4% of AGI
(% of AGI for various income ranges: 8.6% for AGIs below $25k, 8.1% for AGIs $25k-50k, 7.9% for AGIs $50k-75k, 10.9% for AGIs $75k-100k, 8.4% for AGIs $100k-200k)
Charity contributions: $1,816 (reported on 13.3% of returns)
Here:
$1,816
State:
$4,225
(% of AGI for various income ranges: 0.3% for AGIs below $25k, 0.6% for AGIs $25k-50k, 0.8% for AGIs $50k-75k, 1.1% for AGIs $75k-100k, 0.9% for AGIs $100k-200k)
Taxes paid: $4,504 (reported on 17.5% of returns)
48610:
$4,504
State:
$8,327
(% of AGI for various income ranges: 1.6% for AGIs below $25k, 1.8% for AGIs $25k-50k, 2.2% for AGIs $50k-75k, 3.6% for AGIs $75k-100k, 3.3% for AGIs $100k-200k)
Earned income credit: $1,964 (reported on 23.1% of returns)
Here:
$1,964
State:
$2,306
(% of AGI for various income ranges: 5.8% for AGIs below $25k, 0.9% for AGIs $25k-50k)
Percentage of individuals using paid preparers for their 2012 taxes: 60.1%
Here:
60%
State:
57%
(% for various income ranges: 54.7% for AGIs below $25k, 64.9% for AGIs $25k-50k, 68.8% for AGIs $50k-75k, 66.7% for AGIs $75k-100k, 66.7% for AGIs $100k-200k)
Averages for the 2004 tax year for zip code 48610, filed in 2005:
Average Adjusted Gross Income (AGI) in 2004: $29,677 (Individual Income Tax Returns)
Here:
$29,677
State:
$48,204
Salary/wage: $24,784 (reported on 80.6% of returns)
Here:
$24,784
State:
$42,791
(% of AGI for various income ranges: 96.0% for AGIs below $10k, 55.5% for AGIs $10k-25k, 64.1% for AGIs $25k-50k, 70.7% for AGIs $50k-75k, 75.8% for AGIs $75k-100k, 69.3% for AGIs over 100k)
Taxable interest for individuals: $1,133 (reported on 44.4% of returns)
This zip code:
$1,133
Michigan:
$1,725
(% of AGI for various income ranges: 13.0% for AGIs below $10k, 2.7% for AGIs $10k-25k, 1.2% for AGIs $25k-50k, 1.4% for AGIs $50k-75k, 0.6% for AGIs $75k-100k, 0.7% for AGIs over 100k)
Taxable dividends: $1,364 (reported on 18.0% of returns)
Here:
$1,364
State:
$3,420
(% of AGI for various income ranges: 4.8% for AGIs below $10k, 0.7% for AGIs $10k-25k, 0.6% for AGIs $25k-50k, 0.9% for AGIs $50k-75k, 0.9% for AGIs $75k-100k, 0.4% for AGIs over 100k)
Net capital gain/loss: +$1,961 (reported on 12.3% of returns)
Here:
+$1,961
State:
+$8,532
(% of AGI for various income ranges: -2.4% for AGIs below $10k, -0.6% for AGIs $10k-25k, 0.4% for AGIs $25k-50k, 2.0% for AGIs $50k-75k, 2.8% for AGIs over 100k)
Profit/loss from business: +$2,840 (reported on 12.1% of returns)
Here:
+$2,840
State:
+$9,547
(% of AGI for various income ranges: 6.4% for AGIs below $10k, 3.8% for AGIs $10k-25k, 1.3% for AGIs $25k-50k, -0.3% for AGIs $50k-75k)
IRA payment deduction: $2,095 (reported on 1.4% of returns)
48610:
$2,095
Michigan:
$2,875
Total itemized deductions: $14,536 (27% of AGI, reported on 22.7% of returns)
Here:
$14,536
State:
$18,509
Here:
26.5% of AGI
State:
20.7% of AGI
(% of AGI for various income ranges: 20.0% for AGIs below $10k, 8.8% for AGIs $10k-25k, 10.4% for AGIs $25k-50k, 13.3% for AGIs $50k-75k, 9.2% for AGIs $75k-100k, 11.9% for AGIs over 100k)
Charity contributions deductions: $1,496 (3% of AGI, reported on 18.7% of returns)
Here:
$1,496
State:
$3,365
Here:
2.6% of AGI
State:
3.6% of AGI
(% of AGI for various income ranges: 1.0% for AGIs below $10k, 0.5% for AGIs $10k-25k, 0.8% for AGIs $25k-50k, 1.1% for AGIs $50k-75k, 0.9% for AGIs $75k-100k, 1.6% for AGIs over 100k)
Total tax: $3,492 (reported on 66.9% of returns)
48610:
$3,492
State:
$7,691
(% of AGI for various income ranges: 2.7% for AGIs below $10k, 3.0% for AGIs $10k-25k, 5.9% for AGIs $25k-50k, 8.4% for AGIs $50k-75k, 11.7% for AGIs $75k-100k, 14.9% for AGIs over 100k)
Earned income credit: $1,673 (reported on 19.1% of returns)
Here:
$1,673
State:
$1,737
Percentage of individuals using paid preparers for their 2004 taxes: 63.5%
Here:
63%
State:
60%
(% for various income ranges: 54.6% for AGIs below $10k, 63.4% for AGIs $10k-25k, 67.7% for AGIs $25k-50k, 69.0% for AGIs $50k-75k, 65.6% for AGIs $75k-100k, 78.7% for AGIs over 100k)
Likely homosexual households (counted as self-reported same-sex unmarried-partner households)
Lesbian couples: 0.0% of all households
Gay men: 0.3% of all households
Household received Food Stamps/SNAP in the past 12 months: 376 Household did not receive Food Stamps/SNAP in the past 12 months: 1,129
Women who had a birth in the past 12 months: 21 (21 now married, 0 unmarried) Women who did not have a birth in the past 12 months: 604 (195 now married, 409 unmarried)
Housing units in zip code 48610 with a mortgage: 728 (44 second mortgage, 36 both second mortgage and home equity loan) Houses without a mortgage: 16
Median monthly owner costs for units with a mortgage: $930 Median monthly owner costs for units without a mortgage: $447
Residents with income below the poverty level in 2022:
This zip code:
19.5%
Whole state:
13.4%
Residents with income below 50% of the poverty level in 2022:
This zip code:
10.5%
Whole state:
6.9%
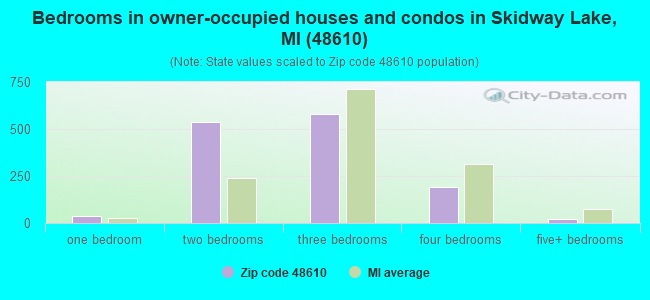
Median number of rooms in houses and condos:
Here:
5.8
State:
6.5
Median number of rooms in apartments:
Here:
4.8
State:
4.3
Notable locations in this zip code not listed on our city pages
Notable locations in zip code 48610: Greenwood Station (A), Rifle River Camp (B), Alger Rest Area (C), Alger Station (D), Greenwood Campground (E), Wildwood Campground (F), Wildwood Fire Department (G), Ogemaw County Emergency Medical Services Authority Mills Township (H), Arenac County Emergency Medical Services Alger (I), Mills Township Fire Department (J), Moffatt Township Volunteer Fire Department (K). Display/hide their locations on the map
Churches in zip code 48610 include: Alger Bible Baptist Church (A), Alger United Methodist Church (B), Saint Joseph Church (C), Allegheny Wesleyan Methodist Church (D). Display/hide their locations on the map
Lakes and reservoirs: Chandlers Lake (A), Forest Lake (B), Molasses River Flooding Number One (C), Molasses River Flooding Number Two (D). Display/hide their locations on the map
Creeks: Bear Creek (A), Harwood Creek (B), Hettinger Creek (C), Spring Creek (D), LaPorte Creek (E), Burch Creek (F), Chatman Creek (G), Cursten Creek (H), Eddy Creek (I). Display/hide their locations on the map
In group quarters: 12 (-1 institutionalized population)
Size of family households: 639 2-persons, 170 3-persons, 91 4-persons, 63 5-persons, 3 6-persons, 8 7-or-more-persons
Size of nonfamily households: 388 1-person, 130 2-persons, 4 4-persons
213 married couples with children.
252 single-parent households (119 men, 133 women).
99.7% of residents of 48610 zip code speak English at home.
0.3% of residents speak Spanish at home (80% very well, 20% not well).
0.2% of residents speak other Indo-European language at home (60% very well, 40% well).
0.1% of residents speak other language at home (100% very well).
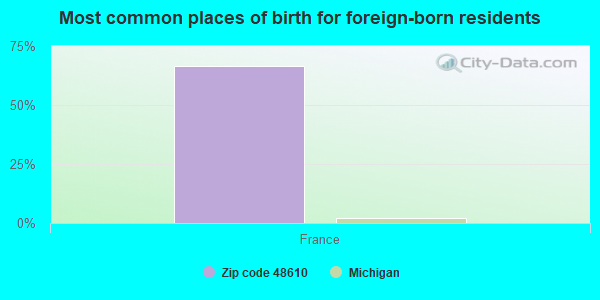
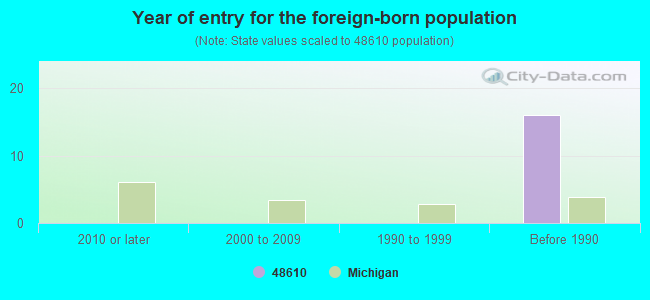
Foreign born population: 2 (0.1%) (0.0% of them are naturalized citizens)
:
0.1%
Whole state:
6.9%
67%France
22%German
13%Irish
11%American
8%English
8%Polish
3%Italian
3%French Canadian
Year of entry for the foreign-born population
02010 or later
02000 to 2009
01990 to 1999
16Before 1990
Facilities with environmental interests located in this zip code:
MI DEPT/ENVIRONMENTAL QUALITY (GREENWOOD RD APROX 1400 BLOCK in ALGER, MI)
(Resource Conservation and Recovery Act (tracking hazardous waste)) Alternative names: MI DEPT/ERD RRD (E)
BENNETT GLASS (1506 N M76 in ALGER, MI)
Conditionally Exempt Small Quantity Generators, less than 100 kg/month of hazardous waste (Resource Conservation and Recovery Act (tracking hazardous waste)) - notification Organizations: BENNETT RON (CONTACT/OWNER)
Housing units lacking complete plumbing facilities: 5.0% Housing units lacking complete kitchen facilities: 3.1%
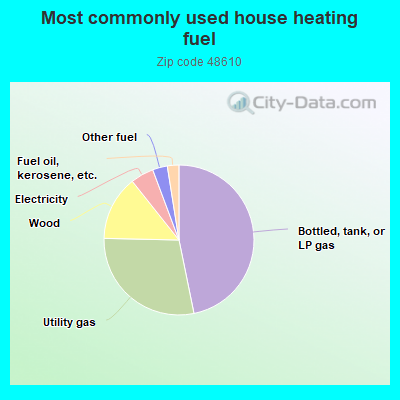
46.9%Bottled, tank, or LP gas
28.6%Utility gas
14.0%Wood
5.0%Electricity
3.2%Other fuel
2.5%Fuel oil, kerosene, etc.
Population in 1990: 2,015. Population change in the 1990s: +1,437 (+71.3%).
Place of birth for U.S.-born residents:
This state: 2,894
Northeast: 41
Midwest: 81
South: 112
West: 112
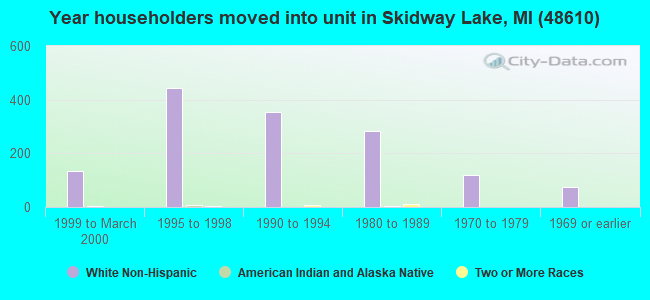
61% of the 48610 zip code residents lived in the same house 5 years ago. Out of people who lived in different houses, 24% lived in this county. Out of people who lived in different counties, 50% lived in Michigan.
88% of the 48610 zip code residents lived in the same house 1 year ago. Out of people who lived in different houses, 29% moved from this county. Out of people who lived in different houses, 65% moved from different county within same state. Out of people who lived in different houses, 3% moved from different state.
Private vs. public school enrollment:
Students in private schools in grades 1 to 8 (elementary and middle school):
Here:
0.0%
Michigan:
12.4%
Students in private schools in grades 9 to 12 (high school): 9
Here:
6.6%
Michigan:
9.8%
Students in private undergraduate colleges: 3
Here:
6.8%
Michigan:
14.9%
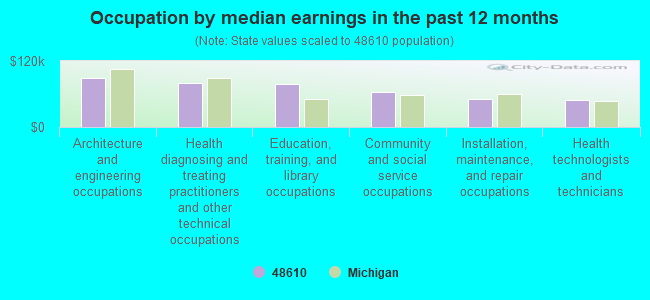
Occupation by median earnings in the past 12 months ($)
89,426Architecture and engineering occupations
80,183Health diagnosing and treating practitioners and other technical occupations
78,653Education, training, and library occupations
62,995Community and social service occupations
51,693Installation, maintenance, and repair occupations
48,378Health technologists and technicians
Top industries in this zip code by the number of employees in 2005:
Other Services (except Public Administration): Other Similar Organizations (except Business, Professional, Labor, and Political Organizations) (10-19: 1)
Health Care and Social Assistance: Offices of Dentists (10-19: 1)
Accommodation and Food Services: Limited-Service Restaurants (10-19: 1)
2002 - 2018 National Fire Incident Reporting System (NFIRS) incidents
Based on the data from the years 2002 - 2018 the average number of fires per year is 13. The highest number of fires - 25 took place in 2002, and the least - 5 in 2014. The data has a dropping trend.
When looking into fire subcategories, the most reports belonged to: Structure Fires (51.4%), and Outside Fires (33.0%).
Fire incident types reported to NFIRS in Zip Code 48610
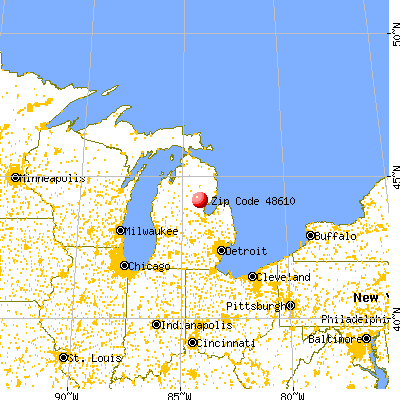


 Nearest zip codes: 48659, 48661, 48613, 48756, 48624, 48652.
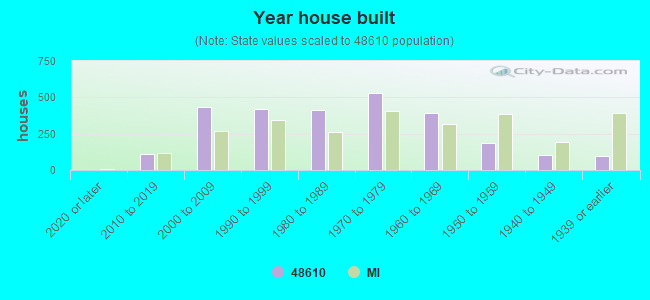


 Based on the data from the years 2002 - 2018 the average number of fires per year is 13. The highest number of fires - 25 took place in 2002, and the least - 5 in 2014. The data has a dropping trend.
 When looking into fire subcategories, the most reports belonged to: Structure Fires (51.4%), and Outside Fires (33.0%).