Estimated zip code population in 2022: 4,397 Zip code population in 2010: 4,312 Zip code population in 2000: 4,039
Houses and condos: 1,683 Renter-occupied apartments: 97
% of renters here:
6%
State:
27%
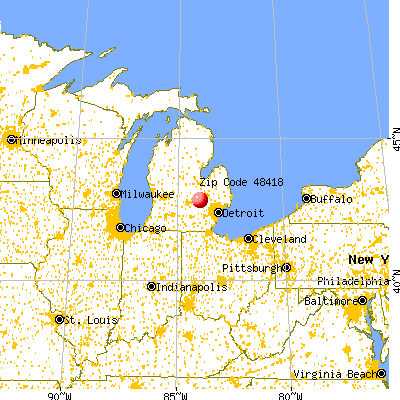
March 2022 cost of living index in zip code 48418: 83.1 (low, U.S. average is 100)
Land area: 38.7 sq. mi. Water area: 0.8 sq. mi.
Population density: 114 people per square mile
(very low).
OSM Map
General Map
Google Map
MSN Map
OSM Map
General Map
Google Map
MSN Map
OSM Map
General Map
Google Map
MSN Map
OSM Map
General Map
Google Map
MSN Map
Please wait while loading the map...
Real estate property taxes paid for housing units in 2022:
This zip code:
0.9% ($2,238)
Michigan:
1.2% ($2,746)
Median real estate property taxes paid for housing units with mortgages in 2022: $2,254 (0.9%) Median real estate property taxes paid for housing units with no mortgage in 2022: $2,243 (0.9%)
Business Search- 14 Million verified businesses
Males: 2,335
(53.1%)
Females: 2,062
(46.9%)
For population 25 years and over in 48418:
High school or higher: 94.7%
Bachelor's degree or higher: 23.5%
Graduate or professional degree: 8.9%
Unemployed: 2.2%
Mean travel time to work (commute): 32.7 minutes
For population 15 years and over in 48418:
Never married: 22.2%
Now married: 65.6%
Separated: 0.8%
Widowed: 4.7%
Divorced: 6.7%
Zip code 48418 compared to state average:
Unemployed percentage below state average.
Black race population percentage significantly below state average.
Hispanic race population percentage significantly below state average.
Median age above state average.
Foreign-born population percentage significantly below state average.
Renting percentage significantly below state average.
Length of stay since moving in above state average.
Estimated median house/condo value in 2022: $250,958
48418:
$250,958
Michigan:
$224,400
According to our research of Michigan and other state lists, there were 8 registered sex offenders living in 48418 zip code as of May 23, 2024. The ratio of all residents to sex offenders in zip code 48418 is 512 to 1. The ratio of registered sex offenders to all residents in this zip code is lower than the state average.
Median resident age:
This zip code:
44.4 years
Michigan median age:
40.3 years
Average household size:
This zip code:
2.7 people
Michigan:
2.4 people
Averages for the 2020 tax year for zip code 48418, filed in 2021:
Average Adjusted Gross Income (AGI) in 2020: $57,661 (Individual Income Tax Returns)
Here:
$57,661
State:
$68,945
Salary/wage: $51,966 (reported on 79.1% of returns)
Here:
$51,966
State:
$57,142
(% of AGI for various income ranges: 1074.2% for AGIs below $25k, 3127.4% for AGIs $25k-50k, 5597.2% for AGIs $50k-75k, 8762.9% for AGIs $75k-100k, 15359.1% for AGIs $100k-200k)
Taxable interest for individuals: $532 (reported on 27.3% of returns)
This zip code:
$532
Michigan:
$1,630
(% of AGI for various income ranges: 11.9% for AGIs below $25k, 18.7% for AGIs $25k-50k, 16.6% for AGIs $50k-75k, 11.8% for AGIs $75k-100k, 47.0% for AGIs $100k-200k)
Ordinary dividends: $2,394 (reported on 14.5% of returns)
Here:
$2,394
State:
$6,972
(% of AGI for various income ranges: 20.0% for AGIs below $25k, 15.5% for AGIs $25k-50k, 56.2% for AGIs $50k-75k, 32.9% for AGIs $75k-100k, 170.4% for AGIs $100k-200k)
Net capital gain/loss in AGI: +$4,761 (reported on 15.0% of returns)
Here:
+$4,761
State:
+$20,064
(% of AGI for various income ranges: 29.7% for AGIs $25k-50k, 95.9% for AGIs $50k-75k, 102.4% for AGIs $75k-100k, 440.9% for AGIs $100k-200k)
Profit/loss from business: +$8,941 (reported on 15.5% of returns)
Here:
+$8,941
State:
+$11,172
(% of AGI for various income ranges: 120.0% for AGIs below $25k, 275.8% for AGIs $25k-50k, 142.8% for AGIs $50k-75k, 218.8% for AGIs $75k-100k, 273.9% for AGIs $100k-200k)
Taxable individual retirement arrangement distribution: $21,123 (reported on 10.0% of returns)
48418:
$21,123
Michigan:
$19,803
(% of AGI for various income ranges: 54.0% for AGIs below $25k, 137.4% for AGIs $25k-50k, 203.4% for AGIs $50k-75k, 477.6% for AGIs $75k-100k, 1071.3% for AGIs $100k-200k)
Total itemized deductions: $23,212 (reported on 3.6% of returns)
Here:
$23,212
State:
$34,117
(% of AGI for various income ranges: 292.8% for AGIs $50k-75k, 438.3% for AGIs $100k-200k)
Charity contributions: $6,640 (reported on 2.3% of returns)
Here:
$6,640
State:
$13,548
(% of AGI for various income ranges: 144.3% for AGIs $100k-200k)
Taxes paid: $6,800 (reported on 3.6% of returns)
48418:
$6,800
State:
$7,972
(% of AGI for various income ranges: 69.7% for AGIs $50k-75k, 148.7% for AGIs $100k-200k)
Earned income credit: $2,092 (reported on 10.9% of returns)
Here:
$2,092
State:
$2,251
(% of AGI for various income ranges: 60.6% for AGIs below $25k, 55.5% for AGIs $25k-50k)
Percentage of individuals using paid preparers for their 2020 taxes: 93.6%
Here:
94%
State:
93%
(% for various income ranges: 91.4% for AGIs below $25k, 92.2% for AGIs $25k-50k, 94.7% for AGIs $50k-75k, 95.7% for AGIs $75k-100k, 97.1% for AGIs $100k-200k, 100.0% for AGIs over 200k)
Averages for the 2012 tax year for zip code 48418, filed in 2013:
Average Adjusted Gross Income (AGI) in 2012: $49,654 (Individual Income Tax Returns)
Here:
$49,654
State:
$55,609
Salary/wage: $44,568 (reported on 83.7% of returns)
Here:
$44,568
State:
$46,782
(% of AGI for various income ranges: 58.6% for AGIs below $25k, 64.3% for AGIs $25k-50k, 78.1% for AGIs $50k-75k, 82.1% for AGIs $75k-100k, 84.6% for AGIs $100k-200k, 58.7% for AGIs over 200k)
Taxable interest for individuals: $745 (reported on 28.1% of returns)
This zip code:
$745
Michigan:
$1,491
(% of AGI for various income ranges: 1.1% for AGIs below $25k, 0.6% for AGIs $25k-50k, 0.5% for AGIs $50k-75k, 0.3% for AGIs $100k-200k)
Ordinary dividends: $1,693 (reported on 15.3% of returns)
Here:
$1,693
State:
$6,225
(% of AGI for various income ranges: 1.4% for AGIs below $25k, 0.7% for AGIs $25k-50k, 0.4% for AGIs $50k-75k, 0.3% for AGIs $75k-100k, 0.5% for AGIs $100k-200k)
Net capital gain/loss in AGI: +$781 (reported on 10.7% of returns)
Here:
+$781
State:
+$9,326
(% of AGI for various income ranges: 0.5% for AGIs $25k-50k, 0.5% for AGIs $50k-75k)
Profit/loss from business: +$7,594 (reported on 15.8% of returns)
Here:
+$7,594
State:
+$11,523
(% of AGI for various income ranges: 9.9% for AGIs below $25k, 4.7% for AGIs $25k-50k, 1.1% for AGIs $50k-75k, 1.4% for AGIs $75k-100k, 0.9% for AGIs $100k-200k)
Taxable individual retirement arrangement distribution: $12,190 (reported on 10.7% of returns)
48418:
$12,190
Michigan:
$15,298
(% of AGI for various income ranges: 4.2% for AGIs below $25k, 2.8% for AGIs $25k-50k, 1.9% for AGIs $50k-75k, 3.0% for AGIs $75k-100k, 3.0% for AGIs $100k-200k)
Total itemized deductions: $18,198 (22% of AGI, reported on 33.2% of returns)
Here:
$18,198
State:
$21,628
Here:
21.7% of AGI
State:
18.4% of AGI
(% of AGI for various income ranges: 8.5% for AGIs below $25k, 12.7% for AGIs $25k-50k, 10.6% for AGIs $50k-75k, 12.4% for AGIs $75k-100k, 13.1% for AGIs $100k-200k, 15.6% for AGIs over 200k)
Charity contributions: $2,486 (reported on 25.5% of returns)
Here:
$2,486
State:
$4,225
(% of AGI for various income ranges: 0.6% for AGIs below $25k, 1.1% for AGIs $25k-50k, 0.9% for AGIs $50k-75k, 1.4% for AGIs $75k-100k, 1.6% for AGIs $100k-200k, 2.1% for AGIs over 200k)
Taxes paid: $5,777 (reported on 33.2% of returns)
48418:
$5,777
State:
$8,327
(% of AGI for various income ranges: 1.7% for AGIs below $25k, 2.9% for AGIs $25k-50k, 3.2% for AGIs $50k-75k, 4.2% for AGIs $75k-100k, 5.0% for AGIs $100k-200k, 5.6% for AGIs over 200k)
Earned income credit: $2,193 (reported on 15.3% of returns)
Here:
$2,193
State:
$2,306
(% of AGI for various income ranges: 5.2% for AGIs below $25k, 1.3% for AGIs $25k-50k)
Percentage of individuals using paid preparers for their 2012 taxes: 60.7%
Here:
61%
State:
57%
(% for various income ranges: 58.1% for AGIs below $25k, 61.7% for AGIs $25k-50k, 62.5% for AGIs $50k-75k, 60.0% for AGIs $75k-100k, 71.4% for AGIs $100k-200k)
Averages for the 2004 tax year for zip code 48418, filed in 2005:
Average Adjusted Gross Income (AGI) in 2004: $46,488 (Individual Income Tax Returns)
Here:
$46,488
State:
$48,204
Salary/wage: $42,475 (reported on 88.3% of returns)
Here:
$42,475
State:
$42,791
(% of AGI for various income ranges: 88.5% for AGIs below $10k, 66.5% for AGIs $10k-25k, 74.5% for AGIs $25k-50k, 84.4% for AGIs $50k-75k, 90.3% for AGIs $75k-100k, 76.5% for AGIs over 100k)
Taxable interest for individuals: $1,092 (reported on 47.7% of returns)
This zip code:
$1,092
Michigan:
$1,725
(% of AGI for various income ranges: 4.5% for AGIs below $10k, 2.4% for AGIs $10k-25k, 1.1% for AGIs $25k-50k, 0.6% for AGIs $50k-75k, 0.6% for AGIs $75k-100k, 1.5% for AGIs over 100k)
Taxable dividends: $1,152 (reported on 21.3% of returns)
Here:
$1,152
State:
$3,420
(% of AGI for various income ranges: 2.3% for AGIs below $10k, 0.9% for AGIs $10k-25k, 0.7% for AGIs $25k-50k, 0.6% for AGIs $50k-75k, 0.2% for AGIs $75k-100k, 0.4% for AGIs over 100k)
Net capital gain/loss: +$4,183 (reported on 15.7% of returns)
Here:
+$4,183
State:
+$8,532
(% of AGI for various income ranges: -2.3% for AGIs below $10k, 1.3% for AGIs $10k-25k, 1.3% for AGIs $25k-50k, 1.0% for AGIs $50k-75k, 0.2% for AGIs $75k-100k, 3.2% for AGIs over 100k)
Profit/loss from business: +$5,519 (reported on 16.3% of returns)
Here:
+$5,519
State:
+$9,547
(% of AGI for various income ranges: 6.7% for AGIs below $10k, 5.5% for AGIs $10k-25k, 3.2% for AGIs $25k-50k, 1.1% for AGIs $50k-75k, 1.6% for AGIs $75k-100k, 1.0% for AGIs over 100k)
IRA payment deduction: $2,571 (reported on 2.2% of returns)
48418:
$2,571
Michigan:
$2,875
Total itemized deductions: $15,881 (22% of AGI, reported on 43.2% of returns)
Here:
$15,881
State:
$18,509
Here:
21.8% of AGI
State:
20.7% of AGI
(% of AGI for various income ranges: 12.7% for AGIs below $10k, 11.7% for AGIs $10k-25k, 14.5% for AGIs $25k-50k, 17.0% for AGIs $50k-75k, 16.0% for AGIs $75k-100k, 12.6% for AGIs over 100k)
Charity contributions deductions: $2,072 (3% of AGI, reported on 37.2% of returns)
Here:
$2,072
State:
$3,365
Here:
2.7% of AGI
State:
3.6% of AGI
(% of AGI for various income ranges: 1.0% for AGIs below $10k, 1.0% for AGIs $10k-25k, 1.4% for AGIs $25k-50k, 1.8% for AGIs $50k-75k, 1.5% for AGIs $75k-100k, 2.1% for AGIs over 100k)
Total tax: $5,896 (reported on 78.1% of returns)
48418:
$5,896
State:
$7,691
(% of AGI for various income ranges: 4.3% for AGIs below $10k, 4.4% for AGIs $10k-25k, 6.2% for AGIs $25k-50k, 8.2% for AGIs $50k-75k, 9.7% for AGIs $75k-100k, 16.3% for AGIs over 100k)
Earned income credit: $1,704 (reported on 9.7% of returns)
Here:
$1,704
State:
$1,737
Percentage of individuals using paid preparers for their 2004 taxes: 60.7%
Here:
61%
State:
60%
(% for various income ranges: 50.1% for AGIs below $10k, 58.2% for AGIs $10k-25k, 65.2% for AGIs $25k-50k, 65.1% for AGIs $50k-75k, 63.8% for AGIs $75k-100k, 62.4% for AGIs over 100k)
Likely homosexual households (counted as self-reported same-sex unmarried-partner households)
Lesbian couples: 0.0% of all households
Gay men: 0.6% of all households
Household received Food Stamps/SNAP in the past 12 months: 69 Household did not receive Food Stamps/SNAP in the past 12 months: 1,549
Women who had a birth in the past 12 months: 29 (30 now married, 0 unmarried) Women who did not have a birth in the past 12 months: 773 (490 now married, 279 unmarried)
Housing units in zip code 48418 with a mortgage: 1,025 (190 second mortgage, 150 both second mortgage and home equity loan) Houses without a mortgage: 62
Median monthly owner costs for units with a mortgage: $1,562 Median monthly owner costs for units without a mortgage: $491
Residents with income below the poverty level in 2022:
This zip code:
5.0%
Whole state:
13.4%
Residents with income below 50% of the poverty level in 2022:
This zip code:
1.5%
Whole state:
6.9%
Median number of rooms in houses and condos:
Here:
6.9
State:
6.5
Median number of rooms in apartments:
Here:
5.5
State:
4.3
Notable locations in this zip code not listed on our city pages
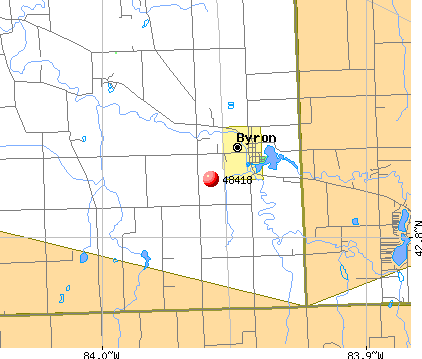
Notable locations in zip code 48418: Willowbrook Golf Course (A), Byron Police Department (B), Burns Township Fire Department (C). Display/hide their locations on the map
Churches in zip code 48418 include: Byron Baptist Church (A), United Methodist Church of Byron (B), Antrim Church (C). Display/hide their locations on the map
Lakes and reservoirs: Lillie Lake (A), Myers Lake (B), Kanause Lake (C), Woods Lake (D), Mud Lake (E), Merrill Lake (F), McKane Lake (G), Euler Lake (H). Display/hide their locations on the map
Parks in zip code 48418 include: Byron Sesquicentennial Park (1), Bryon Cemetery Historical Marker (2), Byron Historical Marker (3), Ellen May Tower Historical Marker (4), Spanish-American War Nurse Historical Marker (5). Display/hide their locations on the map
In group quarters: 6 (-1 institutionalized population)
Size of family households: 588 2-persons, 217 3-persons, 227 4-persons, 146 5-persons, 21 6-persons, 35 7-or-more-persons
Size of nonfamily households: 267 1-person, 120 2-persons
930 married couples with children.
46 single-parent households (46 women).
98.3% of residents of 48418 zip code speak English at home.
0.6% of residents speak Spanish at home (80% very well, 20% well).
0.6% of residents speak other Indo-European language at home (100% very well).
0.3% of residents speak Asian or Pacific Island language at home (100% very well).
Foreign born population: 66 (1.5%) (79.6% of them are naturalized citizens)
This zip code:
1.5%
Whole state:
6.9%
18%Malaysia
12%Guyana
9%Sweden
9%England
9%Ecuador
8%Barbados
6%France
26%American
23%Irish
18%German
8%Polish
6%English
4%Scottish
2%Norwegian
Year of entry for the foreign-born population
232010 or later
122000 to 2009
91990 to 1999
35Before 1990
Facilities with environmental interests located in this zip code:
GENESEE #7 ARGENTINE WWSL (14300 BIRD ROAD in BYRON, MI)
National Pollutant Discharge Elimination System NON-MAJOR (Tracking pollutant discharge elimination systems) - permit Business SIC classification: SEWERAGE SYSTEMS Organizations: GENESEE COUNTY DRAIN COMMISSIO (CONTACT/OWNER)
Alternative names: GENESSEE #7-ARGENTINE WWSL
ARNDTS SERVICE (421 MAPLE AVE in BYRON, MI)
(Resource Conservation and Recovery Act (tracking hazardous waste))
Housing units lacking complete kitchen facilities: 0.4%
54.2%Bottled, tank, or LP gas
23.6%Utility gas
8.4%Wood
6.3%Fuel oil, kerosene, etc.
5.8%Electricity
0.9%No fuel used
0.9%Other fuel
Population in 1990: 3,085. Population change in the 1990s: +954 (+30.9%).
Place of birth for U.S.-born residents:
This state: 3,915
Northeast: 32
Midwest: 169
South: 154
West: 34
61% of the 48418 zip code residents lived in the same house 5 years ago. Out of people who lived in different houses, 25% lived in this county. Out of people who lived in different counties, 50% lived in Michigan.
95% of the 48418 zip code residents lived in the same house 1 year ago. Out of people who lived in different houses, 33% moved from this county. Out of people who lived in different houses, 68% moved from different county within same state.
Private vs. public school enrollment:
Students in private schools in grades 1 to 8 (elementary and middle school): 173
Here:
33.2%
Michigan:
12.4%
Students in private schools in grades 9 to 12 (high school): 27
Here:
11.5%
Michigan:
9.8%
Students in private undergraduate colleges: 63
Here:
32.5%
Michigan:
14.9%
Occupation by median earnings in the past 12 months ($)
117,634Architecture and engineering occupations
90,465Computer and mathematical occupations
88,188Management occupations
74,583Health diagnosing and treating practitioners and other technical occupations
69,644Education, training, and library occupations
66,107Installation, maintenance, and repair occupations
Companies with federal contracts located in this zip code:
OPERATION PARTS (16331 MURRAY RD in BYRON, MI; small business) : $58,603 in 2 contractsfrom 2004 to 2005
$47,720 with Army for Miscellaneous Weapons. Signed on 2004-04-08. Completion date: 2004-06-07.
$10,883 with Army for Optical Sighting and Ranging Equipment. Signed on 2005-04-28. Completion date: 2005-07-29.
Top industries in this zip code by the number of employees in 2005:
Construction: Poured Concrete Foundation and Structure Contractors (20-49 employees: 1 establishment, 1-4 employees: 1 establishment)
Health Care and Social Assistance: Offices of Physicians (except Mental Health Specialists) (20-49: 1)
Construction: Plumbing, Heating, and Air-Conditioning Contractors (10-19: 1, 1-4: 1)
Other Services (except Public Administration): Religious Organizations (10-19: 1, 1-4: 1)
Health Care and Social Assistance: Ambulance Services (10-19: 1)
Construction: Oil and Gas Pipeline and Related Structures Construction (10-19: 1)
Administrative and Support and Waste Management and Remediation Services: Landscaping Services (5-9: 1, 1-4: 3)
Finance and Insurance: Insurance Agencies and Brokerages (5-9: 1, 1-4: 1)
Health Care and Social Assistance: Child Day Care Services (5-9: 1, 1-4: 1)
People in group quarters in 2010:
11 people in group homes intended for adults
People in group quarters in 2000:
9 people in other noninstitutional group quarters
Fatal accident statistics in 2013:
Fatal accident count: 1
Vehicles involved in fatal accidents: 1
Fatal accidents caused by drunken drivers: 1
Fatalities: 1
Persons involved in fatal accidents: 1
Pedestrians involved in fatal accidents: 0
Fatal accident statistics in 2012:
Fatal accident count: 1
Vehicles involved in fatal accidents: 1
Fatal accidents caused by drunken drivers: 0
Fatalities: 1
Persons involved in fatal accidents: 1
Pedestrians involved in fatal accidents: 1
Home Mortgage Disclosure Act Aggregated Statistics For Year 2009 (Based on 2 partial tracts)
A) FHA, FSA/RHS & VA Home Purchase Loans
B) Conventional Home Purchase Loans
C) Refinancings
D) Home Improvement Loans
F) Non-occupant Loans on < 5 Family Dwellings (A B C & D)
G) Loans On Manufactured Home Dwelling (A B C & D)
Number
Average Value
Number
Average Value
Number
Average Value
Number
Average Value
Number
Average Value
Number
Average Value
LOANS ORIGINATED
12
$119,889
6
$105,713
52
$132,692
2
$36,665
2
$87,320
2
$51,785
APPLICATIONS APPROVED, NOT ACCEPTED
0
$0
0
$0
6
$162,288
0
$0
1
$72,580
0
$0
APPLICATIONS DENIED
3
$154,980
1
$30,240
20
$159,440
2
$34,400
0
$0
0
$0
APPLICATIONS WITHDRAWN
5
$115,970
1
$41,580
8
$159,138
1
$9,830
0
$0
1
$54,430
FILES CLOSED FOR INCOMPLETENESS
1
$100,550
0
$0
2
$188,245
0
$0
0
$0
0
$0
Aggregated Statistics For Year 2008 (Based on 2 partial tracts)
A) FHA, FSA/RHS & VA Home Purchase Loans
B) Conventional Home Purchase Loans
C) Refinancings
D) Home Improvement Loans
F) Non-occupant Loans on < 5 Family Dwellings (A B C & D)
G) Loans On Manufactured Home Dwelling (A B C & D)
Number
Average Value
Number
Average Value
Number
Average Value
Number
Average Value
Number
Average Value
Number
Average Value
LOANS ORIGINATED
8
$101,682
12
$111,951
26
$130,846
5
$59,422
2
$119,070
2
$84,295
APPLICATIONS APPROVED, NOT ACCEPTED
0
$0
1
$58,970
4
$179,928
0
$0
0
$0
0
$0
APPLICATIONS DENIED
4
$105,650
2
$167,075
26
$160,999
2
$51,410
0
$0
1
$95,260
APPLICATIONS WITHDRAWN
1
$75,600
2
$82,405
7
$170,316
0
$0
1
$37,800
0
$0
FILES CLOSED FOR INCOMPLETENESS
1
$207,140
1
$105,840
7
$186,409
0
$0
0
$0
0
$0
Aggregated Statistics For Year 2007 (Based on 2 partial tracts)
A) FHA, FSA/RHS & VA Home Purchase Loans
B) Conventional Home Purchase Loans
C) Refinancings
D) Home Improvement Loans
F) Non-occupant Loans on < 5 Family Dwellings (A B C & D)
G) Loans On Manufactured Home Dwelling (A B C & D)
Number
Average Value
Number
Average Value
Number
Average Value
Number
Average Value
Number
Average Value
Number
Average Value
LOANS ORIGINATED
1
$181,440
21
$133,740
51
$159,575
8
$58,685
3
$99,287
2
$154,225
APPLICATIONS APPROVED, NOT ACCEPTED
0
$0
3
$119,953
11
$162,540
1
$75,600
0
$0
1
$24,950
APPLICATIONS DENIED
0
$0
2
$175,015
40
$146,758
7
$23,760
0
$0
1
$21,170
APPLICATIONS WITHDRAWN
0
$0
2
$74,845
12
$164,052
0
$0
0
$0
1
$98,280
FILES CLOSED FOR INCOMPLETENESS
0
$0
0
$0
5
$208,808
1
$30,240
1
$142,130
0
$0
Aggregated Statistics For Year 2006 (Based on 2 partial tracts)
A) FHA, FSA/RHS & VA Home Purchase Loans
B) Conventional Home Purchase Loans
C) Refinancings
D) Home Improvement Loans
F) Non-occupant Loans on < 5 Family Dwellings (A B C & D)
G) Loans On Manufactured Home Dwelling (A B C & D)
Number
Average Value
Number
Average Value
Number
Average Value
Number
Average Value
Number
Average Value
Number
Average Value
LOANS ORIGINATED
2
$94,120
29
$144,161
72
$118,766
6
$41,832
3
$99,037
5
$117,482
APPLICATIONS APPROVED, NOT ACCEPTED
0
$0
3
$104,327
23
$127,896
3
$46,117
0
$0
1
$128,520
APPLICATIONS DENIED
1
$55,190
12
$111,006
48
$149,058
4
$24,380
2
$113,780
4
$81,648
APPLICATIONS WITHDRAWN
1
$63,500
8
$173,219
26
$172,077
2
$79,760
2
$99,415
2
$151,200
FILES CLOSED FOR INCOMPLETENESS
0
$0
1
$102,060
6
$154,602
1
$26,460
0
$0
0
$0
Aggregated Statistics For Year 2005 (Based on 2 partial tracts)
A) FHA, FSA/RHS & VA Home Purchase Loans
B) Conventional Home Purchase Loans
C) Refinancings
D) Home Improvement Loans
F) Non-occupant Loans on < 5 Family Dwellings (A B C & D)
G) Loans On Manufactured Home Dwelling (A B C & D)
Number
Average Value
Number
Average Value
Number
Average Value
Number
Average Value
Number
Average Value
Number
Average Value
LOANS ORIGINATED
2
$150,065
29
$135,585
99
$147,962
14
$42,228
5
$144,698
2
$150,445
APPLICATIONS APPROVED, NOT ACCEPTED
1
$117,940
10
$123,455
17
$155,247
2
$5,670
2
$63,505
0
$0
APPLICATIONS DENIED
1
$120,200
4
$221,508
54
$134,652
3
$123,983
0
$0
2
$130,790
APPLICATIONS WITHDRAWN
0
$0
4
$177,282
42
$176,562
5
$52,618
1
$186,730
2
$124,740
FILES CLOSED FOR INCOMPLETENESS
0
$0
0
$0
10
$171,234
1
$117,940
0
$0
0
$0
Aggregated Statistics For Year 2004 (Based on 2 partial tracts)
A) FHA, FSA/RHS & VA Home Purchase Loans
B) Conventional Home Purchase Loans
C) Refinancings
D) Home Improvement Loans
F) Non-occupant Loans on < 5 Family Dwellings (A B C & D)
G) Loans On Manufactured Home Dwelling (A B C & D)
Number
Average Value
Number
Average Value
Number
Average Value
Number
Average Value
Number
Average Value
Number
Average Value
LOANS ORIGINATED
1
$118,690
29
$172,133
93
$143,136
11
$64,329
2
$190,510
2
$92,610
APPLICATIONS APPROVED, NOT ACCEPTED
1
$43,850
10
$157,777
17
$165,964
3
$128,520
0
$0
2
$61,990
APPLICATIONS DENIED
0
$0
6
$131,670
53
$156,264
7
$58,644
1
$125,500
2
$65,770
APPLICATIONS WITHDRAWN
1
$104,330
2
$156,870
35
$147,787
1
$23,440
1
$111,130
2
$92,990
FILES CLOSED FOR INCOMPLETENESS
0
$0
2
$142,130
15
$158,357
1
$75,600
0
$0
0
$0
Aggregated Statistics For Year 2003 (Based on 2 partial tracts)
A) FHA, FSA/RHS & VA Home Purchase Loans
B) Conventional Home Purchase Loans
C) Refinancings
D) Home Improvement Loans
F) Non-occupant Loans on < 5 Family Dwellings (A B C & D)
Number
Average Value
Number
Average Value
Number
Average Value
Number
Average Value
Number
Average Value
LOANS ORIGINATED
3
$155,483
41
$148,729
229
$136,281
10
$17,161
7
$103,571
APPLICATIONS APPROVED, NOT ACCEPTED
3
$140,867
5
$166,924
25
$127,190
2
$12,475
2
$111,890
APPLICATIONS DENIED
2
$102,440
5
$108,260
53
$142,841
8
$22,775
1
$39,310
APPLICATIONS WITHDRAWN
0
$0
2
$192,025
31
$118,473
0
$0
2
$71,440
FILES CLOSED FOR INCOMPLETENESS
1
$80,140
2
$96,010
5
$165,262
0
$0
0
$0
Aggregated Statistics For Year 1999 (Based on 1 partial tract)
A) FHA, FSA/RHS & VA Home Purchase Loans
B) Conventional Home Purchase Loans
C) Refinancings
D) Home Improvement Loans
F) Non-occupant Loans on < 5 Family Dwellings (A B C & D)
Detailed PMIC statistics for the following Tracts:0130.01
2002 - 2018 National Fire Incident Reporting System (NFIRS) incidents
According to the data from the years 2002 - 2018 the average number of fires per year is 24. The highest number of fires - 39 took place in 2011, and the least - 8 in 2016. The data has a dropping trend.
When looking into fire subcategories, the most reports belonged to: Structure Fires (61.1%), and Outside Fires (29.2%).
Fire incident types reported to NFIRS in Zip Code 48418


 Nearest zip codes: 48816, 48429, 48436, 48414, 48855, 48451.


 According to the data from the years 2002 - 2018 the average number of fires per year is 24. The highest number of fires - 39 took place in 2011, and the least - 8 in 2016. The data has a dropping trend.
 When looking into fire subcategories, the most reports belonged to: Structure Fires (61.1%), and Outside Fires (29.2%).