Estimated zip code population in 2022: 13,232 Zip code population in 2010: 11,569 Zip code population in 2000: 10,420
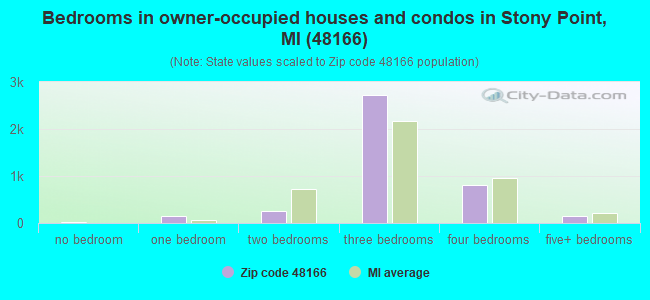
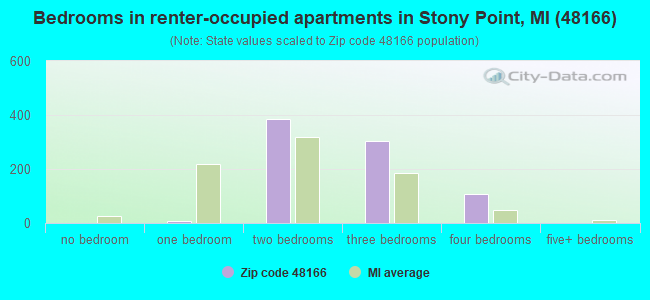
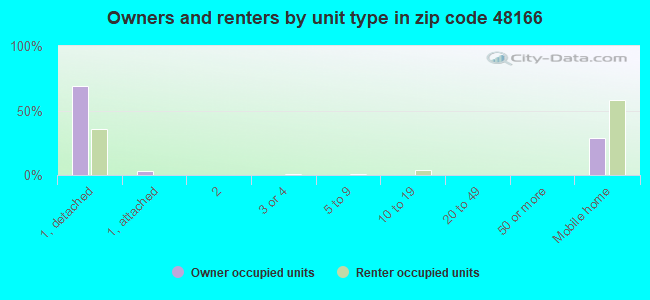
Houses and condos: 5,233 Renter-occupied apartments: 811
% of renters here:
16%
State:
27%
March 2022 cost of living index in zip code 48166: 96.5 (near average, U.S. average is 100)
Land area: 26.6 sq. mi. Water area: 1.2 sq. mi.
Population density: 498 people per square mile
(low).
OSM Map
General Map
Google Map
MSN Map
OSM Map
General Map
Google Map
MSN Map
OSM Map
General Map
Google Map
MSN Map
OSM Map
General Map
Google Map
MSN Map
Please wait while loading the map...
Real estate property taxes paid for housing units in 2022:
This zip code:
1.0% ($2,360)
Michigan:
1.2% ($2,746)
Median real estate property taxes paid for housing units with mortgages in 2022: $2,522 (0.9%) Median real estate property taxes paid for housing units with no mortgage in 2022: $1,513 (1.0%)
Business Search- 14 Million verified businesses
Males: 6,559
(49.6%)
Females: 6,672
(50.4%)
For population 25 years and over in 48166:
High school or higher: 87.5%
Bachelor's degree or higher: 17.7%
Graduate or professional degree: 6.3%
Unemployed: 3.5%
Mean travel time to work (commute): 27.6 minutes
For population 15 years and over in 48166:
Never married: 33.9%
Now married: 47.7%
Separated: 1.2%
Widowed: 4.6%
Divorced: 12.7%
Zip code 48166 compared to state average:
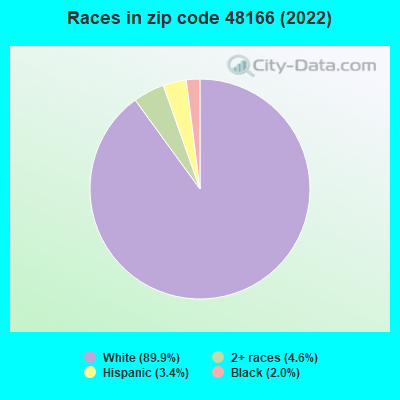
Black race population percentage significantly below state average.
Foreign-born population percentage below state average.
Renting percentage below state average.
House age below state average.
Percentage of population with a bachelor's degree or higher below state average.
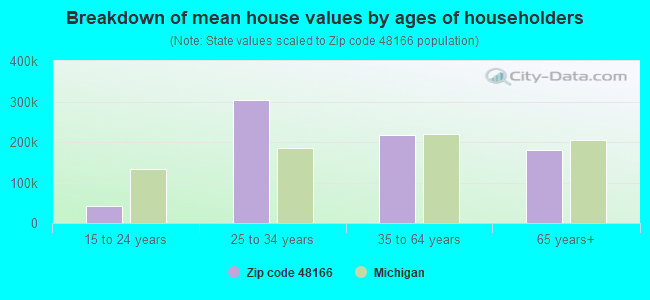
Estimated median house/condo value in 2022: $225,404
48166:
$225,404
Michigan:
$224,400
According to our research of Michigan and other state lists, there were 22 registered sex offenders living in 48166 zip code as of May 23, 2024. The ratio of all residents to sex offenders in zip code 48166 is 529 to 1. The ratio of registered sex offenders to all residents in this zip code is lower than the state average.
Median resident age:
This zip code:
38.2 years
Michigan median age:
40.3 years
Average household size:
This zip code:
2.7 people
Michigan:
2.4 people
Averages for the 2020 tax year for zip code 48166, filed in 2021:
Average Adjusted Gross Income (AGI) in 2020: $59,231 (Individual Income Tax Returns)
Here:
$59,231
State:
$68,945
Salary/wage: $54,518 (reported on 83.9% of returns)
Here:
$54,518
State:
$57,142
(% of AGI for various income ranges: 1021.1% for AGIs below $25k, 3180.3% for AGIs $25k-50k, 6215.0% for AGIs $50k-75k, 9268.7% for AGIs $75k-100k, 16004.2% for AGIs $100k-200k, 52931.4% for AGIs over 200k)
Taxable interest for individuals: $787 (reported on 22.4% of returns)
This zip code:
$787
Michigan:
$1,630
(% of AGI for various income ranges: 9.4% for AGIs below $25k, 9.9% for AGIs $25k-50k, 16.1% for AGIs $50k-75k, 47.2% for AGIs $75k-100k, 39.2% for AGIs $100k-200k, 361.4% for AGIs over 200k)
Ordinary dividends: $2,543 (reported on 12.4% of returns)
Here:
$2,543
State:
$6,972
(% of AGI for various income ranges: 12.1% for AGIs below $25k, 15.7% for AGIs $25k-50k, 45.3% for AGIs $50k-75k, 58.3% for AGIs $75k-100k, 90.6% for AGIs $100k-200k, 598.6% for AGIs over 200k)
Net capital gain/loss in AGI: +$7,330 (reported on 10.6% of returns)
Here:
+$7,330
State:
+$20,064
(% of AGI for various income ranges: 3.2% for AGIs below $25k, 17.8% for AGIs $25k-50k, 39.7% for AGIs $50k-75k, 61.9% for AGIs $75k-100k, 230.0% for AGIs $100k-200k, 3651.4% for AGIs over 200k)
Profit/loss from business: +$7,583 (reported on 10.6% of returns)
Here:
+$7,583
State:
+$11,172
(% of AGI for various income ranges: 46.1% for AGIs below $25k, 62.1% for AGIs $25k-50k, 73.7% for AGIs $50k-75k, 138.3% for AGIs $75k-100k, 203.2% for AGIs $100k-200k, 1487.1% for AGIs over 200k)
Taxable individual retirement arrangement distribution: $17,580 (reported on 6.3% of returns)
48166:
$17,580
Michigan:
$19,803
(% of AGI for various income ranges: 29.7% for AGIs below $25k, 56.5% for AGIs $25k-50k, 203.3% for AGIs $50k-75k, 204.5% for AGIs $75k-100k, 503.2% for AGIs $100k-200k)
Total itemized deductions: $24,641 (reported on 4.4% of returns)
Here:
$24,641
State:
$34,117
(% of AGI for various income ranges: 60.0% for AGIs $25k-50k, 97.4% for AGIs $50k-75k, 252.3% for AGIs $75k-100k, 389.9% for AGIs $100k-200k, 2377.1% for AGIs over 200k)
Charity contributions: $6,754 (reported on 3.7% of returns)
Here:
$6,754
State:
$13,548
(% of AGI for various income ranges: 9.2% for AGIs $25k-50k, 13.1% for AGIs $50k-75k, 43.0% for AGIs $75k-100k, 97.2% for AGIs $100k-200k, 724.3% for AGIs over 200k)
Taxes paid: $7,659 (reported on 4.4% of returns)
48166:
$7,659
State:
$7,972
(% of AGI for various income ranges: 13.3% for AGIs $25k-50k, 27.1% for AGIs $50k-75k, 86.4% for AGIs $75k-100k, 129.9% for AGIs $100k-200k, 735.7% for AGIs over 200k)
Earned income credit: $2,162 (reported on 15.8% of returns)
Here:
$2,162
State:
$2,251
(% of AGI for various income ranges: 82.8% for AGIs below $25k, 67.2% for AGIs $25k-50k, 1.9% for AGIs $50k-75k)
Percentage of individuals using paid preparers for their 2020 taxes: 94.3%
Here:
94%
State:
93%
(% for various income ranges: 93.8% for AGIs below $25k, 95.3% for AGIs $25k-50k, 93.5% for AGIs $50k-75k, 95.2% for AGIs $75k-100k, 94.2% for AGIs $100k-200k, 94.1% for AGIs over 200k)
Averages for the 2012 tax year for zip code 48166, filed in 2013:
Average Adjusted Gross Income (AGI) in 2012: $52,485 (Individual Income Tax Returns)
Here:
$52,485
State:
$55,609
Salary/wage: $47,198 (reported on 87.8% of returns)
Here:
$47,198
State:
$46,782
(% of AGI for various income ranges: 70.3% for AGIs below $25k, 73.0% for AGIs $25k-50k, 79.4% for AGIs $50k-75k, 84.0% for AGIs $75k-100k, 87.1% for AGIs $100k-200k, 55.9% for AGIs over 200k)
Taxable interest for individuals: $692 (reported on 27.1% of returns)
This zip code:
$692
Michigan:
$1,491
(% of AGI for various income ranges: 0.5% for AGIs below $25k, 0.5% for AGIs $25k-50k, 0.4% for AGIs $50k-75k, 0.3% for AGIs $75k-100k, 0.2% for AGIs $100k-200k, 0.6% for AGIs over 200k)
Ordinary dividends: $3,119 (reported on 14.1% of returns)
Here:
$3,119
State:
$6,225
(% of AGI for various income ranges: 1.0% for AGIs below $25k, 1.0% for AGIs $25k-50k, 0.5% for AGIs $50k-75k, 0.5% for AGIs $75k-100k, 0.4% for AGIs $100k-200k, 3.5% for AGIs over 200k)
Net capital gain/loss in AGI: +$873 (reported on 9.2% of returns)
Here:
+$873
State:
+$9,326
(% of AGI for various income ranges: 0.2% for AGIs $75k-100k, 0.1% for AGIs $100k-200k, 1.2% for AGIs over 200k)
Profit/loss from business: +$6,437 (reported on 9.8% of returns)
Here:
+$6,437
State:
+$11,523
(% of AGI for various income ranges: 5.4% for AGIs below $25k, 1.7% for AGIs $25k-50k, 0.5% for AGIs $50k-75k, 0.8% for AGIs $75k-100k, 0.8% for AGIs $100k-200k)
Taxable individual retirement arrangement distribution: $13,817 (reported on 6.8% of returns)
48166:
$13,817
Michigan:
$15,298
(% of AGI for various income ranges: 1.8% for AGIs below $25k, 2.2% for AGIs $25k-50k, 2.0% for AGIs $50k-75k, 1.7% for AGIs $75k-100k, 2.0% for AGIs $100k-200k)
Total itemized deductions: $18,858 (19% of AGI, reported on 29.9% of returns)
Here:
$18,858
State:
$21,628
Here:
19.4% of AGI
State:
18.4% of AGI
(% of AGI for various income ranges: 5.9% for AGIs below $25k, 7.3% for AGIs $25k-50k, 9.8% for AGIs $50k-75k, 11.9% for AGIs $75k-100k, 13.8% for AGIs $100k-200k, 10.0% for AGIs over 200k)
Charity contributions: $2,628 (reported on 25.6% of returns)
Here:
$2,628
State:
$4,225
(% of AGI for various income ranges: 0.5% for AGIs below $25k, 0.8% for AGIs $25k-50k, 1.0% for AGIs $50k-75k, 1.3% for AGIs $75k-100k, 1.8% for AGIs $100k-200k, 1.5% for AGIs over 200k)
Taxes paid: $6,499 (reported on 29.9% of returns)
48166:
$6,499
State:
$8,327
(% of AGI for various income ranges: 1.1% for AGIs below $25k, 1.7% for AGIs $25k-50k, 2.8% for AGIs $50k-75k, 3.8% for AGIs $75k-100k, 5.4% for AGIs $100k-200k, 5.5% for AGIs over 200k)
Earned income credit: $2,279 (reported on 17.3% of returns)
Here:
$2,279
State:
$2,306
(% of AGI for various income ranges: 6.6% for AGIs below $25k, 1.2% for AGIs $25k-50k)
Percentage of individuals using paid preparers for their 2012 taxes: 58.5%
Here:
58%
State:
57%
(% for various income ranges: 54.6% for AGIs below $25k, 57.1% for AGIs $25k-50k, 61.4% for AGIs $50k-75k, 62.1% for AGIs $75k-100k, 63.2% for AGIs $100k-200k, 83.3% for AGIs over 200k)
Averages for the 2004 tax year for zip code 48166, filed in 2005:
Average Adjusted Gross Income (AGI) in 2004: $46,579 (Individual Income Tax Returns)
Here:
$46,579
State:
$48,204
Salary/wage: $43,942 (reported on 91.9% of returns)
Here:
$43,942
State:
$42,791
(% of AGI for various income ranges: 104.0% for AGIs below $10k, 73.4% for AGIs $10k-25k, 84.3% for AGIs $25k-50k, 88.0% for AGIs $50k-75k, 91.0% for AGIs $75k-100k, 86.1% for AGIs over 100k)
Taxable interest for individuals: $856 (reported on 38.1% of returns)
This zip code:
$856
Michigan:
$1,725
(% of AGI for various income ranges: 3.0% for AGIs below $10k, 1.4% for AGIs $10k-25k, 0.8% for AGIs $25k-50k, 0.5% for AGIs $50k-75k, 0.6% for AGIs $75k-100k, 0.5% for AGIs over 100k)
Taxable dividends: $1,592 (reported on 17.4% of returns)
Here:
$1,592
State:
$3,420
(% of AGI for various income ranges: 1.8% for AGIs below $10k, 0.6% for AGIs $10k-25k, 0.4% for AGIs $25k-50k, 0.6% for AGIs $50k-75k, 0.5% for AGIs $75k-100k, 0.7% for AGIs over 100k)
Net capital gain/loss: +$5,660 (reported on 10.7% of returns)
Here:
+$5,660
State:
+$8,532
(% of AGI for various income ranges: -0.5% for AGIs below $10k, -0.1% for AGIs $10k-25k, 0.2% for AGIs $25k-50k, 0.4% for AGIs $50k-75k, 0.4% for AGIs $75k-100k, 4.0% for AGIs over 100k)
Profit/loss from business: +$6,128 (reported on 9.4% of returns)
Here:
+$6,128
State:
+$9,547
(% of AGI for various income ranges: -0.2% for AGIs below $10k, 4.3% for AGIs $10k-25k, 1.1% for AGIs $25k-50k, 0.8% for AGIs $50k-75k, 0.6% for AGIs $75k-100k, 1.4% for AGIs over 100k)
IRA payment deduction: $2,967 (reported on 1.1% of returns)
48166:
$2,967
Michigan:
$2,875
(% of AGI for various income ranges: 0.6% for AGIs below $10k, 0.1% for AGIs $25k-50k, 0.1% for AGIs $50k-75k, 0.1% for AGIs $75k-100k)
Total itemized deductions: $16,336 (21% of AGI, reported on 36.9% of returns)
Here:
$16,336
State:
$18,509
Here:
20.8% of AGI
State:
20.7% of AGI
(% of AGI for various income ranges: 5.8% for AGIs below $10k, 5.6% for AGIs $10k-25k, 9.9% for AGIs $25k-50k, 14.1% for AGIs $50k-75k, 14.8% for AGIs $75k-100k, 14.8% for AGIs over 100k)
Charity contributions deductions: $2,072 (3% of AGI, reported on 33.4% of returns)
Here:
$2,072
State:
$3,365
Here:
2.6% of AGI
State:
3.6% of AGI
(% of AGI for various income ranges: 0.7% for AGIs below $10k, 0.6% for AGIs $10k-25k, 1.0% for AGIs $25k-50k, 1.5% for AGIs $50k-75k, 1.7% for AGIs $75k-100k, 1.9% for AGIs over 100k)
Total tax: $5,792 (reported on 78.0% of returns)
48166:
$5,792
State:
$7,691
(% of AGI for various income ranges: 2.3% for AGIs below $10k, 4.0% for AGIs $10k-25k, 6.5% for AGIs $25k-50k, 8.3% for AGIs $50k-75k, 10.3% for AGIs $75k-100k, 14.4% for AGIs over 100k)
Earned income credit: $1,672 (reported on 13.2% of returns)
Here:
$1,672
State:
$1,737
Percentage of individuals using paid preparers for their 2004 taxes: 59.2%
Here:
59%
State:
60%
(% for various income ranges: 48.3% for AGIs below $10k, 60.0% for AGIs $10k-25k, 58.8% for AGIs $25k-50k, 64.2% for AGIs $50k-75k, 62.0% for AGIs $75k-100k, 67.3% for AGIs over 100k)
Likely homosexual households (counted as self-reported same-sex unmarried-partner households)
Lesbian couples: 0.0% of all households
Gay men: 0.0% of all households
Household received Food Stamps/SNAP in the past 12 months: 899 Household did not receive Food Stamps/SNAP in the past 12 months: 4,059
Women who had a birth in the past 12 months: 115 (95 now married, 21 unmarried) Women who did not have a birth in the past 12 months: 3,559 (1,365 now married, 2,195 unmarried)
Housing units in zip code 48166 with a mortgage: 2,448 (85 second mortgage, 73 both second mortgage and home equity loan) Houses without a mortgage: 50
Median monthly owner costs for units with a mortgage: $1,548 Median monthly owner costs for units without a mortgage: $615
Residents with income below the poverty level in 2022:
This zip code:
14.3%
Whole state:
13.4%
Residents with income below 50% of the poverty level in 2022:
This zip code:
9.4%
Whole state:
6.9%
Median number of rooms in houses and condos:
Here:
6.4
State:
6.5
Median number of rooms in apartments:
Here:
4.9
State:
4.3
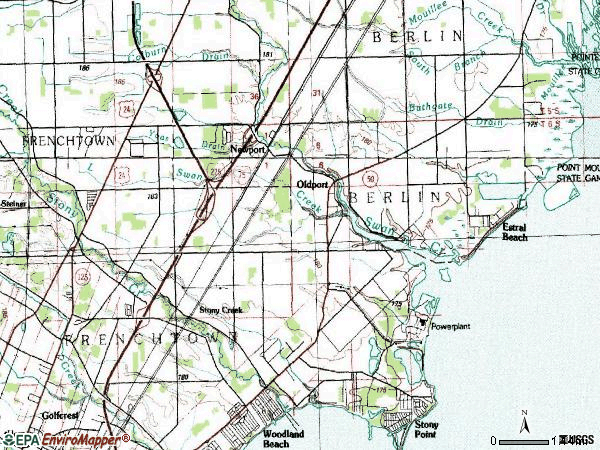
Notable locations in this zip code not listed on our city pages
Notable locations in zip code 48166: Enrico Fermi Powerplant (A), Berlin Township Library (B), Estral Beach Village Hall (C), Estral Beach Volunteer Fire Department (D), Berlin Charter Township Fire Department Station 1 (E). Display/hide their locations on the map
Churches in zip code 48166 include: Lakeside Church (A), Stony Point Church (B), Saint Charles Catholic Church (C), Newport Community Church (D), First Christian Baptist Church (E), Christ Our Shepherd Lutheran Church (F), Grace Baptist Church (G). Display/hide their locations on the map
Streams, rivers, and creeks: Yoas Drain (A), Blanchett Drain (B), Langton Drain (C), Little Swan Creek (D), Colburn Drain (E), Miller and Malosh Drain (F). Display/hide their locations on the map
2,150 married couples with children.
707 single-parent households (60 men, 647 women).
93.1% of residents of 48166 zip code speak English at home.
0.8% of residents speak Spanish at home (76% very well, 24% well).
2.7% of residents speak other Indo-European language at home (100% very well).
0.8% of residents speak Asian or Pacific Island language at home (100% very well).
1.6% of residents speak other language at home (100% very well).
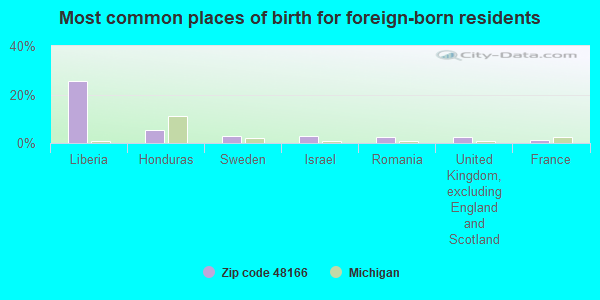
Foreign born population: 603 (4.6%) (48.6% of them are naturalized citizens)
This zip code:
4.6%
Whole state:
6.9%
26%Liberia
5%Honduras
3%Sweden
3%Israel
3%Romania
2%United Kingdom, excluding England and Scotland
1%France
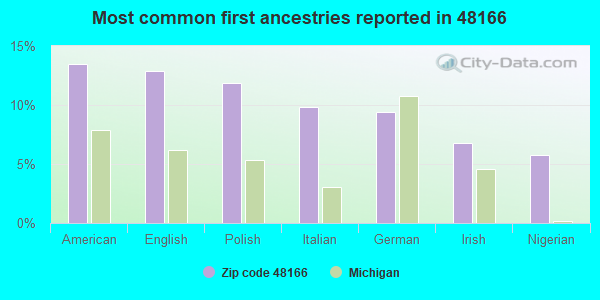
14%American
13%English
12%Polish
10%Italian
9%German
7%Irish
6%Nigerian
Year of entry for the foreign-born population
7032010 or later
862000 to 2009
141990 to 1999
54Before 1990
Facilities with environmental interests located in this zip code:
DETROIT EDISON FERMI II POWER PLANT (6400 DIXIE HIGHWAY in NEWPORT, MI)
AIR SYNTHETIC MINOR (AIRS/AFS) OIL CONTROL (Facility Response Plan for oil discharge) ENFORCEMENT/COMPLIANCE ACTIVITY (Integrated Compliance Information System) CRITERIA AND HAZARDOUS AIR POLLUTANT INVENTORY (Inventory of air pollution sources) National Pollutant Discharge Elimination System MAJOR (Tracking pollutant discharge elimination systems) - permit HAZARDOUS WASTE BIENNIAL REPORTER (Resource Conservation and Recovery Act (tracking hazardous waste)) Small Quantity Generators, between 100 kg and 1000 kg of hazardous waste/month (Resource Conservation and Recovery Act (tracking hazardous waste)) TSD (Resource Conservation and Recovery Act (tracking hazardous waste)) - notification USED OIL PROGRAM (Resource Conservation and Recovery Act (tracking hazardous waste)) (Resource Conservation and Recovery Act (tracking hazardous waste)) TRI REPORTER (Tracking of toxic chemicals releasing facilities) Business SIC classification: ELECTRIC SERVICES Business NAICS classification: FOSSIL FUEL ELECTRIC POWER GENERATION.; NUCLEAR ELECTRIC POWER GENERATION. Organizations: DETROIT EDISON CO, DTE ENERGY (CONTACT/GENERAL)
, DETROIT EDISON COMPANY (CONTACT/OPERATOR)
Alternative names: DECO-FERMI-2 PLT, DETROIT EDISON CO ENRICO FERMI I PWR PLT, DETROIT EDISON FERMI 2 PLANT, DETROIT EDISON FERMI 2 POWER PLANT, THE DETROIT EDISON CO.
DETROIT EDISON CO (8950 TELEGRAPH in NEWPORT, MI)
Conditionally Exempt Small Quantity Generators, less than 100 kg/month of hazardous waste (Resource Conservation and Recovery Act (tracking hazardous waste)) USED OIL PROGRAM (Resource Conservation and Recovery Act (tracking hazardous waste)) Business NAICS classification: ELECTRIC POWER DISTRIBUTION. Organizations: DETROIT EDISON COMPANY (CONTACT/OPERATOR)
Alternative names: DETROIT EDISON CO NEWPORT SERV CNTR
A AND T PARTS AND SVC (5090 N DIXIE HWY in NEWPORT, MI)
Conditionally Exempt Small Quantity Generators, less than 100 kg/month of hazardous waste (Resource Conservation and Recovery Act (tracking hazardous waste)) - notification Organizations: BESTE TERRY (CONTACT/OWNER)
MEIJER NEWPORT REGIONAL DISTRIBUTION CENTER (8857 SWAN CREEK ROAD in NEWPORT, MI)
Small Quantity Generators, between 100 kg and 1000 kg of hazardous waste/month (Resource Conservation and Recovery Act (tracking hazardous waste)) Organizations: MEIJER DISTRIBUTION INC (CONTACT/OPERATOR)
Alternative names: MEIJER NEWPORT REGIONAL DIST CENTER, NEWPORT REGIONAL DISTRIBUTION FACILITY
FRANKS AUTO BODY AND CAR MAINT INC (8563 N DIXIE HWY in NEWPORT, MI)
Conditionally Exempt Small Quantity Generators, less than 100 kg/month of hazardous waste (Resource Conservation and Recovery Act (tracking hazardous waste)) - notification Organizations: HALIBURDA FRANK (CONTACT/OWNER)
Housing units lacking complete plumbing facilities: 1.9% Housing units lacking complete kitchen facilities: 1.5%
88.1%Utility gas
6.7%Electricity
5.0%Bottled, tank, or LP gas
Population in 1990: 5,651. Population change in the 1990s: +4,769 (+84.4%).
Place of birth for U.S.-born residents:
This state: 10,489
Northeast: 173
Midwest: 1,139
South: 576
West: 50
50% of the 48166 zip code residents lived in the same house 5 years ago. Out of people who lived in different houses, 58% lived in this county. Out of people who lived in different counties, 50% lived in Michigan.
87% of the 48166 zip code residents lived in the same house 1 year ago. Out of people who lived in different houses, 52% moved from this county. Out of people who lived in different houses, 29% moved from different county within same state. Out of people who lived in different houses, 17% moved from different state. Out of people who lived in different houses, 1% moved from abroad.
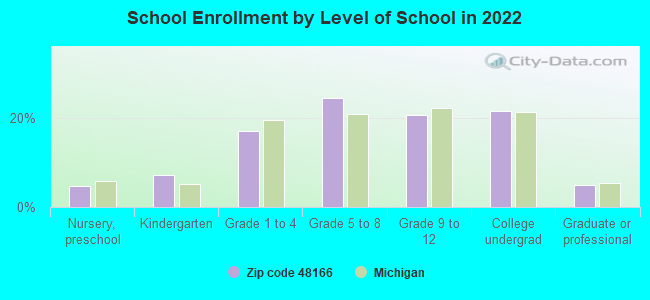
Private vs. public school enrollment:
Students in private schools in grades 1 to 8 (elementary and middle school): 331
Here:
23.5%
Michigan:
12.4%
Students in private schools in grades 9 to 12 (high school): 6
Here:
0.9%
Michigan:
9.8%
Students in private undergraduate colleges: 176
Here:
24.2%
Michigan:
14.9%
Occupation by median earnings in the past 12 months ($)
233,088Life, physical, and social science occupations
104,976Architecture and engineering occupations
96,400Health diagnosing and treating practitioners and other technical occupations
91,938Installation, maintenance, and repair occupations
86,136Community and social service occupations
86,135Computer and mathematical occupations
Top industries in this zip code by the number of employees in 2005:
Utilities: Electric Power Distribution (250-499 employees: 1 establishment, 100-249 employees: 3 establishments, 50-99 employees: 4 establishments, 10-19 employees: 1 establishment)
Accommodation and Food Services: Full-Service Restaurants (50-99: 1, 1-4: 3)
Construction: Industrial Building Construction (20-49: 2)
Educational Services: Elementary and Secondary Schools (20-49: 1, 5-9: 1)
Administrative and Support and Waste Management and Remediation Services: Security Guards and Patrol Services (20-49: 1)
Arts, Entertainment, and Recreation: Marinas (10-19: 1, 1-4: 2)
Wholesale Trade: Farm and Garden Machinery and Equipment Merchant Wholesalers (10-19: 1, 1-4: 1)
People in group quarters in 2000:
5 people in other group homes
Fatal accident statistics in 2014:
Fatal accident count: 2
Vehicles involved in fatal accidents: 3
Fatal accidents caused by drunken drivers: 0
Fatalities: 2
Persons involved in fatal accidents: 3
Pedestrians involved in fatal accidents: 1
Fatal accident statistics in 2013:
Fatal accident count: 5
Vehicles involved in fatal accidents: 5
Fatal accidents caused by drunken drivers: 2
Fatalities: 5
Persons involved in fatal accidents: 6
Pedestrians involved in fatal accidents: 3
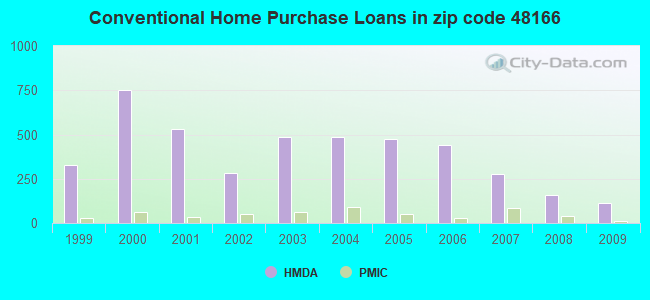
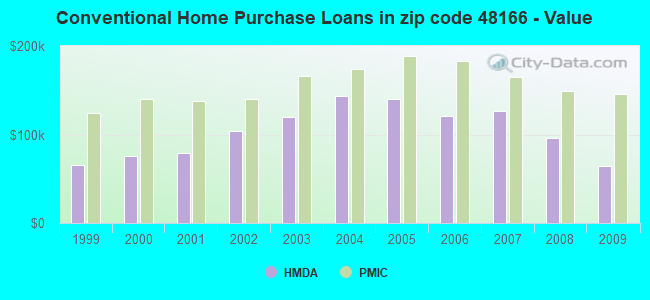
Home Mortgage Disclosure Act Aggregated Statistics For Year 2009 (Based on 4 partial tracts)
A) FHA, FSA/RHS & VA Home Purchase Loans
B) Conventional Home Purchase Loans
C) Refinancings
D) Home Improvement Loans
F) Non-occupant Loans on < 5 Family Dwellings (A B C & D)
G) Loans On Manufactured Home Dwelling (A B C & D)
Number
Average Value
Number
Average Value
Number
Average Value
Number
Average Value
Number
Average Value
Number
Average Value
LOANS ORIGINATED
64
$130,742
112
$64,755
250
$143,936
17
$36,181
25
$91,889
72
$30,447
APPLICATIONS APPROVED, NOT ACCEPTED
5
$116,036
34
$67,784
22
$134,766
3
$9,820
4
$53,992
28
$27,841
APPLICATIONS DENIED
21
$104,255
54
$50,042
153
$155,962
20
$29,472
7
$58,409
64
$36,575
APPLICATIONS WITHDRAWN
21
$111,801
8
$159,695
57
$159,166
3
$124,110
2
$92,965
3
$13,427
FILES CLOSED FOR INCOMPLETENESS
0
$0
12
$35,119
26
$125,348
2
$126,600
0
$0
12
$33,298
Aggregated Statistics For Year 2008 (Based on 4 partial tracts)
A) FHA, FSA/RHS & VA Home Purchase Loans
B) Conventional Home Purchase Loans
C) Refinancings
D) Home Improvement Loans
F) Non-occupant Loans on < 5 Family Dwellings (A B C & D)
G) Loans On Manufactured Home Dwelling (A B C & D)
Number
Average Value
Number
Average Value
Number
Average Value
Number
Average Value
Number
Average Value
Number
Average Value
LOANS ORIGINATED
56
$154,296
156
$95,881
165
$157,306
26
$21,518
23
$165,468
61
$39,169
APPLICATIONS APPROVED, NOT ACCEPTED
0
$0
43
$58,858
47
$127,488
12
$34,342
7
$111,784
35
$34,216
APPLICATIONS DENIED
22
$149,697
104
$73,613
169
$150,753
71
$17,806
8
$97,135
104
$40,502
APPLICATIONS WITHDRAWN
11
$124,629
15
$148,692
44
$147,047
0
$0
0
$0
10
$57,164
FILES CLOSED FOR INCOMPLETENESS
3
$220,773
0
$0
10
$162,170
0
$0
0
$0
0
$0
Aggregated Statistics For Year 2007 (Based on 4 partial tracts)
A) FHA, FSA/RHS & VA Home Purchase Loans
B) Conventional Home Purchase Loans
C) Refinancings
D) Home Improvement Loans
F) Non-occupant Loans on < 5 Family Dwellings (A B C & D)
G) Loans On Manufactured Home Dwelling (A B C & D)
Number
Average Value
Number
Average Value
Number
Average Value
Number
Average Value
Number
Average Value
Number
Average Value
LOANS ORIGINATED
16
$153,646
279
$126,167
303
$150,405
70
$49,354
28
$134,078
78
$49,759
APPLICATIONS APPROVED, NOT ACCEPTED
0
$0
59
$119,884
100
$134,490
6
$77,575
2
$268,100
29
$50,993
APPLICATIONS DENIED
9
$130,248
158
$89,601
357
$145,971
51
$28,357
20
$143,650
120
$49,823
APPLICATIONS WITHDRAWN
4
$177,338
37
$131,655
87
$171,129
11
$151,688
4
$230,398
11
$45,665
FILES CLOSED FOR INCOMPLETENESS
0
$0
24
$146,447
60
$163,937
3
$15,493
5
$110,006
2
$59,580
Aggregated Statistics For Year 2006 (Based on 4 partial tracts)
A) FHA, FSA/RHS & VA Home Purchase Loans
B) Conventional Home Purchase Loans
C) Refinancings
D) Home Improvement Loans
E) Loans on Dwellings For 5+ Families
F) Non-occupant Loans on < 5 Family Dwellings (A B C & D)
G) Loans On Manufactured Home Dwelling (A B C & D)
Number
Average Value
Number
Average Value
Number
Average Value
Number
Average Value
Number
Average Value
Number
Average Value
Number
Average Value
LOANS ORIGINATED
13
$166,607
441
$121,066
464
$119,260
76
$54,331
0
$0
33
$109,826
74
$56,007
APPLICATIONS APPROVED, NOT ACCEPTED
0
$0
81
$132,940
104
$107,580
17
$26,842
0
$0
5
$120,474
54
$61,225
APPLICATIONS DENIED
3
$124,983
164
$103,149
320
$126,466
61
$32,225
0
$0
31
$89,693
155
$58,088
APPLICATIONS WITHDRAWN
2
$133,120
52
$118,472
114
$162,490
11
$33,416
0
$0
3
$145,920
13
$65,246
FILES CLOSED FOR INCOMPLETENESS
0
$0
10
$271,874
67
$174,621
5
$120,426
2
$605,085
0
$0
0
$0
Aggregated Statistics For Year 2005 (Based on 4 partial tracts)
A) FHA, FSA/RHS & VA Home Purchase Loans
B) Conventional Home Purchase Loans
C) Refinancings
D) Home Improvement Loans
F) Non-occupant Loans on < 5 Family Dwellings (A B C & D)
G) Loans On Manufactured Home Dwelling (A B C & D)
Number
Average Value
Number
Average Value
Number
Average Value
Number
Average Value
Number
Average Value
Number
Average Value
LOANS ORIGINATED
2
$152,615
476
$139,835
551
$134,642
84
$45,251
26
$123,937
114
$52,852
APPLICATIONS APPROVED, NOT ACCEPTED
0
$0
83
$93,532
139
$126,102
28
$68,384
12
$101,990
92
$63,089
APPLICATIONS DENIED
10
$92,923
208
$64,669
456
$133,012
80
$29,681
14
$96,713
251
$51,417
APPLICATIONS WITHDRAWN
2
$87,505
74
$122,446
197
$149,172
35
$113,263
13
$83,799
29
$86,818
FILES CLOSED FOR INCOMPLETENESS
2
$61,440
25
$120,260
118
$174,341
0
$0
3
$113,293
0
$0
Aggregated Statistics For Year 2004 (Based on 4 partial tracts)
A) FHA, FSA/RHS & VA Home Purchase Loans
B) Conventional Home Purchase Loans
C) Refinancings
D) Home Improvement Loans
F) Non-occupant Loans on < 5 Family Dwellings (A B C & D)
G) Loans On Manufactured Home Dwelling (A B C & D)
Number
Average Value
Number
Average Value
Number
Average Value
Number
Average Value
Number
Average Value
Number
Average Value
LOANS ORIGINATED
20
$149,674
487
$143,305
551
$136,619
62
$78,503
20
$82,565
140
$57,967
APPLICATIONS APPROVED, NOT ACCEPTED
2
$122,405
120
$94,098
161
$105,861
6
$13,963
7
$87,249
139
$47,905
APPLICATIONS DENIED
5
$141,248
221
$61,209
342
$114,367
60
$20,807
25
$69,906
280
$51,970
APPLICATIONS WITHDRAWN
3
$168,367
45
$119,043
191
$131,123
5
$72,520
8
$128,894
16
$70,749
FILES CLOSED FOR INCOMPLETENESS
2
$136,840
12
$141,967
72
$153,483
0
$0
0
$0
0
$0
Aggregated Statistics For Year 2003 (Based on 4 partial tracts)
A) FHA, FSA/RHS & VA Home Purchase Loans
B) Conventional Home Purchase Loans
C) Refinancings
D) Home Improvement Loans
F) Non-occupant Loans on < 5 Family Dwellings (A B C & D)
Number
Average Value
Number
Average Value
Number
Average Value
Number
Average Value
Number
Average Value
LOANS ORIGINATED
19
$128,594
485
$119,419
1,159
$127,150
71
$23,197
61
$83,167
APPLICATIONS APPROVED, NOT ACCEPTED
0
$0
115
$69,092
211
$104,617
72
$44,820
11
$62,730
APPLICATIONS DENIED
8
$76,046
295
$48,688
489
$99,557
107
$33,695
15
$61,671
APPLICATIONS WITHDRAWN
5
$133,742
37
$138,138
226
$139,999
4
$7,448
10
$129,523
FILES CLOSED FOR INCOMPLETENESS
0
$0
9
$83,449
57
$110,822
5
$119,130
0
$0
Aggregated Statistics For Year 2002 (Based on 4 partial tracts)
A) FHA, FSA/RHS & VA Home Purchase Loans
B) Conventional Home Purchase Loans
C) Refinancings
D) Home Improvement Loans
F) Non-occupant Loans on < 5 Family Dwellings (A B C & D)
Number
Average Value
Number
Average Value
Number
Average Value
Number
Average Value
Number
Average Value
LOANS ORIGINATED
39
$124,694
282
$103,938
784
$125,974
73
$27,453
24
$87,332
APPLICATIONS APPROVED, NOT ACCEPTED
0
$0
136
$64,963
189
$96,952
51
$49,974
9
$52,760
APPLICATIONS DENIED
7
$133,524
399
$46,783
378
$84,647
77
$27,303
17
$101,535
APPLICATIONS WITHDRAWN
3
$156,393
12
$85,087
149
$126,638
14
$34,818
2
$27,890
FILES CLOSED FOR INCOMPLETENESS
0
$0
5
$144,734
56
$124,295
0
$0
0
$0
Aggregated Statistics For Year 2001 (Based on 4 partial tracts)
A) FHA, FSA/RHS & VA Home Purchase Loans
B) Conventional Home Purchase Loans
C) Refinancings
D) Home Improvement Loans
E) Loans on Dwellings For 5+ Families
F) Non-occupant Loans on < 5 Family Dwellings (A B C & D)
Number
Average Value
Number
Average Value
Number
Average Value
Number
Average Value
Number
Average Value
Number
Average Value
LOANS ORIGINATED
38
$120,370
533
$78,770
765
$117,224
102
$25,349
2
$197,550
39
$56,608
APPLICATIONS APPROVED, NOT ACCEPTED
0
$0
312
$52,475
102
$81,986
32
$26,413
0
$0
11
$37,335
APPLICATIONS DENIED
0
$0
1,043
$45,395
424
$81,675
79
$18,469
0
$0
25
$41,160
APPLICATIONS WITHDRAWN
3
$107,583
43
$101,027
118
$109,500
5
$36,634
0
$0
7
$78,621
FILES CLOSED FOR INCOMPLETENESS
2
$55,005
3
$146,677
34
$102,478
0
$0
0
$0
0
$0
Aggregated Statistics For Year 2000 (Based on 4 partial tracts)
A) FHA, FSA/RHS & VA Home Purchase Loans
B) Conventional Home Purchase Loans
C) Refinancings
D) Home Improvement Loans
F) Non-occupant Loans on < 5 Family Dwellings (A B C & D)
Number
Average Value
Number
Average Value
Number
Average Value
Number
Average Value
Number
Average Value
LOANS ORIGINATED
28
$118,398
751
$75,720
279
$84,784
127
$17,493
28
$50,189
APPLICATIONS APPROVED, NOT ACCEPTED
2
$45,705
434
$50,598
91
$71,707
34
$17,790
11
$42,383
APPLICATIONS DENIED
3
$91,413
1,581
$45,265
238
$66,486
66
$31,248
16
$44,840
APPLICATIONS WITHDRAWN
3
$97,097
37
$77,023
69
$88,738
15
$42,199
2
$9,310
FILES CLOSED FOR INCOMPLETENESS
0
$0
2
$77,470
23
$108,417
0
$0
0
$0
Aggregated Statistics For Year 1999 (Based on 2 partial tracts)
A) FHA, FSA/RHS & VA Home Purchase Loans
B) Conventional Home Purchase Loans
C) Refinancings
D) Home Improvement Loans
E) Loans on Dwellings For 5+ Families
F) Non-occupant Loans on < 5 Family Dwellings (A B C & D)
Detailed PMIC statistics for the following Tracts:8302.00
, 8312.00
2002 - 2018 National Fire Incident Reporting System (NFIRS) incidents
According to the data from the years 2002 - 2018 the average number of fires per year is 31. The highest number of reported fires - 41 took place in 2012, and the least - 13 in 2009. The data has an increasing trend.
When looking into fire subcategories, the most incidents belonged to: Outside Fires (42.6%), and Structure Fires (39.2%).
Fire incident types reported to NFIRS in Zip Code 48166


 Nearest zip codes: 48179, 48173, 48134, 48117, 48162, 48183.
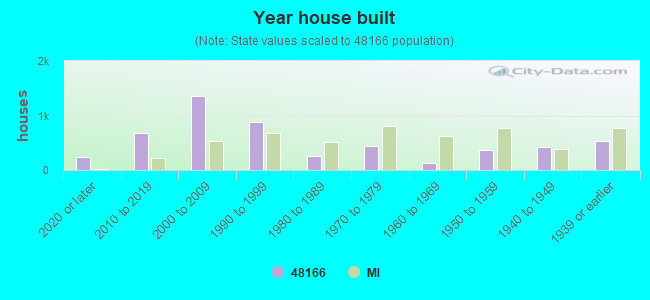


 According to the data from the years 2002 - 2018 the average number of fires per year is 31. The highest number of reported fires - 41 took place in 2012, and the least - 13 in 2009. The data has an increasing trend.
 When looking into fire subcategories, the most incidents belonged to: Outside Fires (42.6%), and Structure Fires (39.2%).