Estimated zip code population in 2022: 10,739 Zip code population in 2010: 7,548 Zip code population in 2000: 6,661
Houses and condos: 3,442 Renter-occupied apartments: 623
% of renters here:
19%
State:
27%
March 2022 cost of living index in zip code 48048: 96.0 (near average, U.S. average is 100)
Land area: 19.0 sq. mi. Water area: 0.2 sq. mi.
Population density: 565 people per square mile
(low).
OSM Map
General Map
Google Map
MSN Map
OSM Map
General Map
Google Map
MSN Map
OSM Map
General Map
Google Map
MSN Map
OSM Map
General Map
Google Map
MSN Map
Please wait while loading the map...
Real estate property taxes paid for housing units in 2022:
This zip code:
1.2% ($2,319)
Michigan:
1.2% ($2,746)
Median real estate property taxes paid for housing units with mortgages in 2022: $2,612 (1.2%) Median real estate property taxes paid for housing units with no mortgage in 2022: $1,311 (1.3%)
Estimated median house/condo value in 2022: $189,362
48048:
$189,362
Michigan:
$224,400
According to our research of Michigan and other state lists, there were 11 registered sex offenders living in 48048 zip code as of May 25, 2024. The ratio of all residents to sex offenders in zip code 48048 is 663 to 1. The ratio of registered sex offenders to all residents in this zip code is lower than the state average.
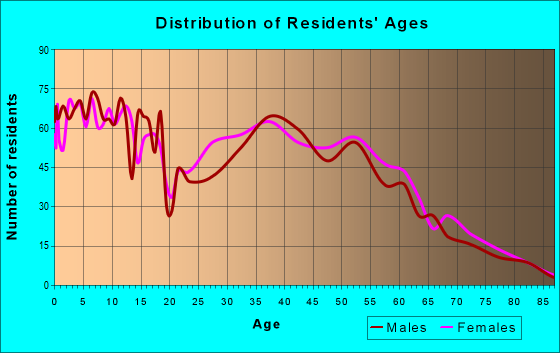
Median resident age:
This zip code:
35.4 years
Michigan median age:
40.3 years
Average household size:
This zip code:
2.8 people
Michigan:
2.4 people
Averages for the 2020 tax year for zip code 48048, filed in 2021:
Average Adjusted Gross Income (AGI) in 2020: $50,578 (Individual Income Tax Returns)
Here:
$50,578
State:
$68,945
Salary/wage: $44,823 (reported on 83.4% of returns)
Here:
$44,823
State:
$57,142
(% of AGI for various income ranges: 968.3% for AGIs below $25k, 3282.3% for AGIs $25k-50k, 6328.8% for AGIs $50k-75k, 9340.3% for AGIs $75k-100k, 15728.0% for AGIs $100k-200k, 40680.0% for AGIs over 200k)
Taxable interest for individuals: $535 (reported on 17.1% of returns)
This zip code:
$535
Michigan:
$1,630
(% of AGI for various income ranges: 7.7% for AGIs below $25k, 4.6% for AGIs $25k-50k, 7.4% for AGIs $50k-75k, 14.2% for AGIs $75k-100k, 32.0% for AGIs $100k-200k, 455.0% for AGIs over 200k)
Ordinary dividends: $1,450 (reported on 7.7% of returns)
Here:
$1,450
State:
$6,972
(% of AGI for various income ranges: 8.4% for AGIs below $25k, 6.1% for AGIs $25k-50k, 26.3% for AGIs $50k-75k, 23.9% for AGIs $75k-100k, 38.3% for AGIs $100k-200k)
Net capital gain/loss in AGI: +$4,562 (reported on 7.2% of returns)
Here:
+$4,562
State:
+$20,064
(% of AGI for various income ranges: 0.7% for AGIs below $25k, 13.5% for AGIs $25k-50k, 39.5% for AGIs $50k-75k, 60.3% for AGIs $75k-100k, 279.7% for AGIs $100k-200k)
Profit/loss from business: +$5,408 (reported on 13.0% of returns)
Here:
+$5,408
State:
+$11,172
(% of AGI for various income ranges: 71.8% for AGIs below $25k, 49.2% for AGIs $25k-50k, 89.1% for AGIs $50k-75k, 211.8% for AGIs $75k-100k, 217.7% for AGIs $100k-200k)
Taxable individual retirement arrangement distribution: $10,957 (reported on 4.9% of returns)
48048:
$10,957
Michigan:
$19,803
(% of AGI for various income ranges: 25.2% for AGIs below $25k, 42.3% for AGIs $25k-50k, 100.7% for AGIs $50k-75k, 115.8% for AGIs $75k-100k, 239.1% for AGIs $100k-200k)
Total itemized deductions: $24,207 (reported on 3.2% of returns)
Here:
$24,207
State:
$34,117
(% of AGI for various income ranges: 44.5% for AGIs below $25k, 133.0% for AGIs $50k-75k, 163.9% for AGIs $75k-100k, 521.4% for AGIs $100k-200k)
Charity contributions: $7,709 (reported on 2.3% of returns)
Here:
$7,709
State:
$13,548
(% of AGI for various income ranges: 39.1% for AGIs $50k-75k, 35.8% for AGIs $75k-100k, 144.9% for AGIs $100k-200k)
Taxes paid: $7,021 (reported on 3.0% of returns)
48048:
$7,021
State:
$7,972
(% of AGI for various income ranges: 7.7% for AGIs below $25k, 32.5% for AGIs $50k-75k, 47.6% for AGIs $75k-100k, 158.0% for AGIs $100k-200k)
Earned income credit: $2,248 (reported on 17.5% of returns)
Here:
$2,248
State:
$2,251
(% of AGI for various income ranges: 83.7% for AGIs below $25k, 85.5% for AGIs $25k-50k)
Percentage of individuals using paid preparers for their 2020 taxes: 90.2%
Here:
90%
State:
93%
(% for various income ranges: 81.0% for AGIs below $25k, 95.2% for AGIs $25k-50k, 95.8% for AGIs $50k-75k, 95.3% for AGIs $75k-100k, 96.1% for AGIs $100k-200k, 100.0% for AGIs over 200k)
Averages for the 2012 tax year for zip code 48048, filed in 2013:
Average Adjusted Gross Income (AGI) in 2012: $43,426 (Individual Income Tax Returns)
Here:
$43,426
State:
$55,609
Salary/wage: $40,182 (reported on 88.0% of returns)
Here:
$40,182
State:
$46,782
(% of AGI for various income ranges: 72.7% for AGIs below $25k, 80.2% for AGIs $25k-50k, 84.5% for AGIs $50k-75k, 86.4% for AGIs $75k-100k, 79.6% for AGIs $100k-200k)
Taxable interest for individuals: $483 (reported on 20.1% of returns)
This zip code:
$483
Michigan:
$1,491
(% of AGI for various income ranges: 0.5% for AGIs below $25k, 0.3% for AGIs $25k-50k, 0.3% for AGIs $75k-100k, 0.1% for AGIs $100k-200k)
Ordinary dividends: $1,548 (reported on 9.0% of returns)
Here:
$1,548
State:
$6,225
(% of AGI for various income ranges: 0.5% for AGIs below $25k, 0.3% for AGIs $25k-50k, 0.4% for AGIs $50k-75k, 0.2% for AGIs $75k-100k, 0.3% for AGIs $100k-200k)
Net capital gain/loss in AGI: +$138 (reported on 6.5% of returns)
Here:
+$138
State:
+$9,326
(% of AGI for various income ranges: 0.3% for AGIs $100k-200k)
Profit/loss from business: +$6,552 (reported on 12.3% of returns)
Here:
+$6,552
State:
+$11,523
(% of AGI for various income ranges: 7.2% for AGIs below $25k, 1.3% for AGIs $25k-50k, 1.5% for AGIs $50k-75k, 1.2% for AGIs $75k-100k, 0.8% for AGIs $100k-200k)
Taxable individual retirement arrangement distribution: $11,659 (reported on 6.8% of returns)
48048:
$11,659
Michigan:
$15,298
(% of AGI for various income ranges: 2.0% for AGIs below $25k, 1.8% for AGIs $25k-50k, 1.2% for AGIs $50k-75k, 1.7% for AGIs $75k-100k, 2.3% for AGIs $100k-200k)
Total itemized deductions: $16,869 (21% of AGI, reported on 27.5% of returns)
Here:
$16,869
State:
$21,628
Here:
21.5% of AGI
State:
18.4% of AGI
(% of AGI for various income ranges: 5.4% for AGIs below $25k, 9.0% for AGIs $25k-50k, 10.0% for AGIs $50k-75k, 13.5% for AGIs $75k-100k, 12.9% for AGIs $100k-200k)
Charity contributions: $2,267 (reported on 22.5% of returns)
Here:
$2,267
State:
$4,225
(% of AGI for various income ranges: 0.7% for AGIs below $25k, 0.8% for AGIs $25k-50k, 0.9% for AGIs $50k-75k, 1.5% for AGIs $75k-100k, 1.7% for AGIs $100k-200k)
Taxes paid: $5,675 (reported on 27.5% of returns)
48048:
$5,675
State:
$8,327
(% of AGI for various income ranges: 1.2% for AGIs below $25k, 2.5% for AGIs $25k-50k, 3.0% for AGIs $50k-75k, 4.6% for AGIs $75k-100k, 5.4% for AGIs $100k-200k)
Earned income credit: $2,275 (reported on 22.5% of returns)
Here:
$2,275
State:
$2,306
(% of AGI for various income ranges: 7.8% for AGIs below $25k, 1.4% for AGIs $25k-50k)
Percentage of individuals using paid preparers for their 2012 taxes: 55.6%
Here:
56%
State:
57%
(% for various income ranges: 52.2% for AGIs below $25k, 58.0% for AGIs $25k-50k, 57.7% for AGIs $50k-75k, 58.1% for AGIs $75k-100k, 57.7% for AGIs $100k-200k)
Averages for the 2004 tax year for zip code 48048, filed in 2005:
Average Adjusted Gross Income (AGI) in 2004: $40,816 (Individual Income Tax Returns)
Here:
$40,816
State:
$48,204
Salary/wage: $39,101 (reported on 89.9% of returns)
Here:
$39,101
State:
$42,791
(% of AGI for various income ranges: 105.9% for AGIs below $10k, 76.2% for AGIs $10k-25k, 83.4% for AGIs $25k-50k, 89.6% for AGIs $50k-75k, 91.5% for AGIs $75k-100k, 81.7% for AGIs over 100k)
Taxable interest for individuals: $774 (reported on 36.7% of returns)
This zip code:
$774
Michigan:
$1,725
(% of AGI for various income ranges: 2.4% for AGIs below $10k, 1.3% for AGIs $10k-25k, 0.9% for AGIs $25k-50k, 0.4% for AGIs $50k-75k, 0.2% for AGIs $75k-100k, 0.9% for AGIs over 100k)
Taxable dividends: $852 (reported on 14.0% of returns)
Here:
$852
State:
$3,420
(% of AGI for various income ranges: 2.6% for AGIs below $10k, 0.4% for AGIs $10k-25k, 0.3% for AGIs $25k-50k, 0.2% for AGIs $50k-75k, 0.1% for AGIs $75k-100k, 0.3% for AGIs over 100k)
Net capital gain/loss: +$3,239 (reported on 8.6% of returns)
Here:
+$3,239
State:
+$8,532
(% of AGI for various income ranges: -0.9% for AGIs below $10k, 0.1% for AGIs $10k-25k, 0.2% for AGIs $25k-50k, 0.2% for AGIs $50k-75k, 0.2% for AGIs $75k-100k, 3.2% for AGIs over 100k)
Profit/loss from business: +$5,190 (reported on 11.8% of returns)
Here:
+$5,190
State:
+$9,547
(% of AGI for various income ranges: 5.5% for AGIs below $10k, 5.4% for AGIs $10k-25k, 1.2% for AGIs $25k-50k, 1.3% for AGIs $50k-75k, 1.2% for AGIs $75k-100k, 0.1% for AGIs over 100k)
IRA payment deduction: $2,865 (reported on 1.8% of returns)
48048:
$2,865
Michigan:
$2,875
Total itemized deductions: $15,644 (24% of AGI, reported on 36.4% of returns)
Here:
$15,644
State:
$18,509
Here:
24.0% of AGI
State:
20.7% of AGI
(% of AGI for various income ranges: 12.9% for AGIs below $10k, 8.0% for AGIs $10k-25k, 13.6% for AGIs $25k-50k, 15.1% for AGIs $50k-75k, 15.9% for AGIs $75k-100k, 13.5% for AGIs over 100k)
Charity contributions deductions: $2,139 (3% of AGI, reported on 32.3% of returns)
Here:
$2,139
State:
$3,365
Here:
3.2% of AGI
State:
3.6% of AGI
(% of AGI for various income ranges: 0.8% for AGIs below $10k, 0.7% for AGIs $10k-25k, 1.5% for AGIs $25k-50k, 1.7% for AGIs $50k-75k, 2.0% for AGIs $75k-100k, 2.0% for AGIs over 100k)
Total tax: $4,780 (reported on 75.9% of returns)
48048:
$4,780
State:
$7,691
(% of AGI for various income ranges: 2.7% for AGIs below $10k, 4.1% for AGIs $10k-25k, 6.4% for AGIs $25k-50k, 8.4% for AGIs $50k-75k, 9.9% for AGIs $75k-100k, 14.8% for AGIs over 100k)
Earned income credit: $1,695 (reported on 15.4% of returns)
Here:
$1,695
State:
$1,737
Percentage of individuals using paid preparers for their 2004 taxes: 61.4%
Here:
61%
State:
60%
(% for various income ranges: 53.4% for AGIs below $10k, 64.1% for AGIs $10k-25k, 60.8% for AGIs $25k-50k, 64.7% for AGIs $50k-75k, 65.8% for AGIs $75k-100k, 61.6% for AGIs over 100k)
Likely homosexual households (counted as self-reported same-sex unmarried-partner households)
Lesbian couples: 1.4% of all households
Gay men: 0.0% of all households
Household received Food Stamps/SNAP in the past 12 months: 608 Household did not receive Food Stamps/SNAP in the past 12 months: 2,663
Women who had a birth in the past 12 months: 45 (47 now married, 0 unmarried) Women who did not have a birth in the past 12 months: 2,119 (898 now married, 1,219 unmarried)
Housing units in zip code 48048 with a mortgage: 1,573 (279 second mortgage, 39 home equity loan, 232 both second mortgage and home equity loan) Houses without a mortgage: 48
Median monthly owner costs for units with a mortgage: $1,607 Median monthly owner costs for units without a mortgage: $570
Residents with income below the poverty level in 2022:
This zip code:
18.2%
Whole state:
13.4%
Residents with income below 50% of the poverty level in 2022:
This zip code:
4.3%
Whole state:
6.9%
Median number of rooms in houses and condos:
Here:
6.2
State:
6.5
Median number of rooms in apartments:
Here:
5.3
State:
4.3
Notable locations in this zip code not listed on our city pages
Notable locations in zip code 48048: New Haven Station (A), New Haven Village Fire Department (B), Lenox Township Library (C), Richmond - Lenox Emergency Medical Services Ambulance Authority House 3 (D), Lenox Township Fire and Rescue Station 1 Headquarters (E), New Haven Village Fire Department (F). Display/hide their locations on the map
Churches in zip code 48048 include: Saint Francis Church (A), Saint Peters Church (B), First Congregational Church (C), Bethlehem Temple Church (D), New Haven Seventh Day Adventist Church (E). Display/hide their locations on the map
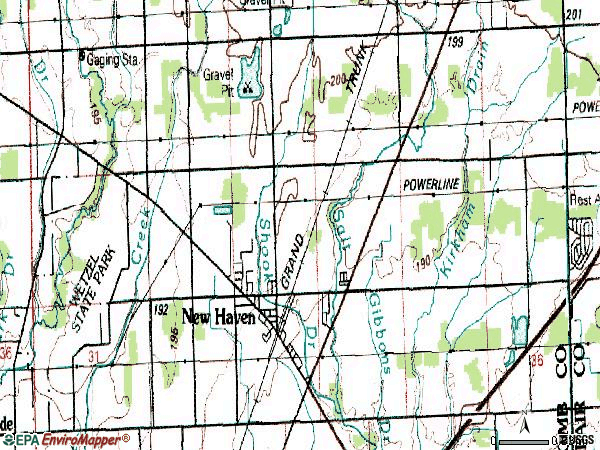
Streams, rivers, and creeks: Bark Drain (A), Warwick Drain (B), Hill Drain (C), Shook Drain (D), Ray-Lenox Drain (E). Display/hide their locations on the map
1,386 married couples with children.
1,093 single-parent households (395 men, 698 women).
96.0% of residents of 48048 zip code speak English at home.
1.3% of residents speak Spanish at home (76% very well, 10% well, 13% not well, 1% not at all).
1.0% of residents speak other Indo-European language at home (100% very well).
0.7% of residents speak other language at home (79% very well, 21% well).
Foreign born population: 140 (1.3%) (30.7% of them are naturalized citizens)
This zip code:
1.3%
Whole state:
6.9%
34%Croatia
25%Honduras
15%Guyana
11%North Macedonia (Macedonia)
8%Serbia
4%Georgia
4%Barbados
20%European
10%American
6%Italian
5%Polish
5%African
5%German
2%Irish
Year of entry for the foreign-born population
552010 or later
202000 to 2009
551990 to 1999
157Before 1990
Facilities with environmental interests located in this zip code:
MERRITT ACADEMY (59900 HAVENRIDGE ROAD in NEW HAVEN, MI)
(National Center for Education Statistics) - STATE ID-09077
AJAX MATERIALS CORPORATION (57295 IAFRATE DR in NEW HAVEN, MI)
CRITERIA AND HAZARDOUS AIR POLLUTANT INVENTORY (Inventory of air pollution sources) Small Quantity Generators, between 100 kg and 1000 kg of hazardous waste/month (Resource Conservation and Recovery Act (tracking hazardous waste)) Conditionally Exempt Small Quantity Generators, less than 100 kg/month of hazardous waste (Resource Conservation and Recovery Act (tracking hazardous waste)) Business SIC classification: CRUSHED AND BROKEN LIMESTONE Business NAICS classification: ASPHALT PAVING MIXTURE AND BLOCK MANUFACTURING. Organizations: ANGELO IAFRATE CONST CO (CONTACT/OPERATOR)
BLUEWATER GAS STORAGE (24336 29 MILE RD in NEW HAVEN, MI)
(Resource Conservation and Recovery Act (tracking hazardous waste)) Organizations: BLUEWATER GAS STORAGE LLC (CONTACT/OPERATOR)
GREAT LAKES DIESEL CAMPER AND COACH (30225 26 MILE RD in NEW HAVEN, MI)
(Resource Conservation and Recovery Act (tracking hazardous waste)) Organizations: CRAWFORD ALAN O (CONTACT/OPERATOR)
CERTIFIED CONTRACTING INC (57905 ROSELL SUITE 1 in NEW HAVEN, MI)
(Resource Conservation and Recovery Act (tracking hazardous waste))
DIRECT ENERGY MARKETING LTD (28 MILE RD in NEW HAVEN, MI)
(Resource Conservation and Recovery Act (tracking hazardous waste)) Business NAICS classification: CRUDE PETROLEUM AND NATURAL GAS EXTRACTION.
7-ELEVEN INC (35931 26 MILE ROAD in NEW HAVEN, MI)
Small Quantity Generators, between 100 kg and 1000 kg of hazardous waste/month (Resource Conservation and Recovery Act (tracking hazardous waste))
AMERICAN IRON & ALUMINUM LLC (58600 ROSELL in NEW HAVEN, MI)
Conditionally Exempt Small Quantity Generators, less than 100 kg/month of hazardous waste (Resource Conservation and Recovery Act (tracking hazardous waste)) Organizations: FRANK CUSUMANO (CONTACT/OPERATOR)
GENERAL PURPOSE VEHICLES LLC (31291 COMCAST DRIVE in NEW HAVEN, MI)
Small Quantity Generators, between 100 kg and 1000 kg of hazardous waste/month (Resource Conservation and Recovery Act (tracking hazardous waste)) Business NAICS classification: MOTOR VEHICLE BODY MANUFACTURING. Organizations: GRATIOT 26 MILE INDUSTRIAL 1 LLC (CONTACT/OWNER)
DETROIT WATER & SEWERAGE, LAKE HURON PLANT (3393 METCALF ROAD CITY=FORT GRATIOT; NOT ALLOWED in LAKEPORT, MI)
CRITERIA AND HAZARDOUS AIR POLLUTANT INVENTORY (Inventory of air pollution sources) Business SIC and NAICS classification: WATER SUPPLY
Housing units lacking complete plumbing facilities: 1.4% Housing units lacking complete kitchen facilities: 0.8%
86.0%Utility gas
8.1%Electricity
5.3%Bottled, tank, or LP gas
Population in 1990: 4,800. Population change in the 1990s: +1,861 (+38.8%).
Place of birth for U.S.-born residents:
This state: 8,957
Northeast: 252
Midwest: 416
South: 680
West: 116
54% of the 48048 zip code residents lived in the same house 5 years ago. Out of people who lived in different houses, 53% lived in this county. Out of people who lived in different counties, 50% lived in Michigan.
88% of the 48048 zip code residents lived in the same house 1 year ago. Out of people who lived in different houses, 36% moved from this county. Out of people who lived in different houses, 57% moved from different county within same state. Out of people who lived in different houses, 1% moved from different state. Out of people who lived in different houses, 3% moved from abroad.
Private vs. public school enrollment:
Students in private schools in grades 1 to 8 (elementary and middle school): 91
Here:
5.6%
Michigan:
12.4%
Students in private schools in grades 9 to 12 (high school): 19
Here:
3.6%
Michigan:
9.8%
Students in private undergraduate colleges: 25
Here:
9.8%
Michigan:
14.9%
Occupation by median earnings in the past 12 months ($)
245,889Legal occupations
107,237Computer and mathematical occupations
91,433Health diagnosing and treating practitioners and other technical occupations
72,010Business and financial operations occupations
71,039Architecture and engineering occupations
64,233Management occupations
Companies with federal contracts located in this zip code:
GENERAL PURPOSE VEHICLES LLC (31291 COMCAST DR in NEW HAVEN, MI; small business) : $5,200,918 in 8 contractsfrom 2004 to 2006
Contracts for Miscellaneous Vehicular Components, Other Research and Development -- Basic Research (R&D), Manufacturing Technology -- Advanced Development (R&D) by Army Signed by year:2000: $0; 2001: $0; 2002: $0; 2003: $0; 2004: $1,095,248; 2005: $2,202,421; 2006: $1,903,249.
Biggest contracts:
$1,900,000 with Army for Miscellaneous Vehicular Components. Signed on 2006-05-12. Completion date: 2007-12-31.
$1,822,000 with Army for Other Research and Development -- Basic Research (R&D). Signed on 2005-04-12. Completion date: 2005-12-31.
$1,561,425 with Army for Miscellaneous Vehicular Components. Signed on 2005-04-07. Completion date: 2005-07-29.
$1,095,248 with Army for Manufacturing Technology -- Advanced Development (R&D). Signed on 2004-06-04. Completion date: 2004-10-28.
PAMAR ENTERPRISES INC (58021 GRATIOT AVE in NEW HAVEN, MI; small business)
$3,805 with Army for Maintenance, Repair and Rebuilding of Equipment -- Pipe, Tubing, Hose, and Fittings. Signed on 2005-12-08. Completion date: 2005-11-30.
Top industries in this zip code by the number of employees in 2005:
Accommodation and Food Services: Limited-Service Restaurants (50-99 employees: 1 establishment)
Professional, Scientific, and Technical Services: Research and Development in the Physical, Engineering, and Life Sciences (50-99: 1)
Health Care and Social Assistance: All Other Outpatient Care Centers (20-49: 1)
Information: Cable and Other Program Distribution (20-49: 1)
Administrative and Support and Waste Management and Remediation Services: Solid Waste Landfill (20-49: 1)
Construction: Site Preparation Contractors (10-19: 1, 1-4: 1)
Health Care and Social Assistance: Services for the Elderly and Persons with Disabilities (10-19: 1, 1-4: 1)
People in group quarters in 2010:
46 people in group homes intended for adults
5 people in nursing facilities/skilled-nursing facilities
People in group quarters in 2000:
1,239 people in state prisons
25 people in other group homes
20 people in homes for the mentally retarded
6 people in other noninstitutional group quarters
Fatal accident statistics in 2014:
Fatal accident count: 3
Vehicles involved in fatal accidents: 4
Fatal accidents caused by drunken drivers: 1
Fatalities: 3
Persons involved in fatal accidents: 4
Pedestrians involved in fatal accidents: 1
Fatal accident statistics in 2012:
Fatal accident count: 3
Vehicles involved in fatal accidents: 5
Fatal accidents caused by drunken drivers: 2
Fatalities: 3
Persons involved in fatal accidents: 5
Pedestrians involved in fatal accidents: 0
Home Mortgage Disclosure Act Aggregated Statistics For Year 2009 (Based on 2 full and 2 partial tracts)
A) FHA, FSA/RHS & VA Home Purchase Loans
B) Conventional Home Purchase Loans
C) Refinancings
D) Home Improvement Loans
E) Loans on Dwellings For 5+ Families
F) Non-occupant Loans on < 5 Family Dwellings (A B C & D)
G) Loans On Manufactured Home Dwelling (A B C & D)
Number
Average Value
Number
Average Value
Number
Average Value
Number
Average Value
Number
Average Value
Number
Average Value
Number
Average Value
LOANS ORIGINATED
80
$106,082
57
$48,353
143
$149,694
4
$1,500
0
$0
5
$81,408
46
$37,217
APPLICATIONS APPROVED, NOT ACCEPTED
7
$82,630
7
$63,949
18
$116,767
1
$20,400
0
$0
3
$80,247
10
$49,200
APPLICATIONS DENIED
32
$114,375
28
$48,827
100
$138,485
12
$15,761
2
$103,000
6
$114,858
22
$44,000
APPLICATIONS WITHDRAWN
10
$96,400
4
$37,500
31
$177,378
1
$15,940
0
$0
0
$0
4
$37,500
FILES CLOSED FOR INCOMPLETENESS
0
$0
8
$52,750
13
$132,125
0
$0
0
$0
0
$0
4
$31,500
Aggregated Statistics For Year 2008 (Based on 2 full and 2 partial tracts)
A) FHA, FSA/RHS & VA Home Purchase Loans
B) Conventional Home Purchase Loans
C) Refinancings
D) Home Improvement Loans
F) Non-occupant Loans on < 5 Family Dwellings (A B C & D)
G) Loans On Manufactured Home Dwelling (A B C & D)
Number
Average Value
Number
Average Value
Number
Average Value
Number
Average Value
Number
Average Value
Number
Average Value
LOANS ORIGINATED
98
$153,653
138
$70,524
93
$143,406
15
$31,777
16
$75,953
88
$35,727
APPLICATIONS APPROVED, NOT ACCEPTED
24
$155,167
39
$80,924
23
$101,136
5
$13,188
2
$120,000
32
$52,000
APPLICATIONS DENIED
24
$155,250
43
$87,780
152
$135,114
37
$24,255
11
$57,612
57
$43,826
APPLICATIONS WITHDRAWN
20
$151,500
10
$112,961
44
$121,009
3
$25,430
4
$152,830
4
$50,000
FILES CLOSED FOR INCOMPLETENESS
2
$132,000
8
$180,750
13
$122,403
5
$16,150
0
$0
2
$57,000
Aggregated Statistics For Year 2007 (Based on 2 full and 2 partial tracts)
A) FHA, FSA/RHS & VA Home Purchase Loans
B) Conventional Home Purchase Loans
C) Refinancings
D) Home Improvement Loans
F) Non-occupant Loans on < 5 Family Dwellings (A B C & D)
G) Loans On Manufactured Home Dwelling (A B C & D)
Number
Average Value
Number
Average Value
Number
Average Value
Number
Average Value
Number
Average Value
Number
Average Value
LOANS ORIGINATED
69
$177,701
291
$123,093
190
$125,480
31
$36,852
24
$69,750
80
$46,400
APPLICATIONS APPROVED, NOT ACCEPTED
8
$208,500
53
$104,292
55
$139,964
11
$66,660
3
$149,753
28
$63,786
APPLICATIONS DENIED
35
$186,093
152
$129,555
242
$151,153
59
$81,848
18
$89,964
62
$46,120
APPLICATIONS WITHDRAWN
10
$192,200
19
$188,093
33
$149,495
6
$59,333
0
$0
0
$0
FILES CLOSED FOR INCOMPLETENESS
4
$211,500
10
$148,400
19
$140,136
2
$7,000
0
$0
0
$0
Aggregated Statistics For Year 2006 (Based on 2 full and 2 partial tracts)
A) FHA, FSA/RHS & VA Home Purchase Loans
B) Conventional Home Purchase Loans
C) Refinancings
D) Home Improvement Loans
F) Non-occupant Loans on < 5 Family Dwellings (A B C & D)
G) Loans On Manufactured Home Dwelling (A B C & D)
Number
Average Value
Number
Average Value
Number
Average Value
Number
Average Value
Number
Average Value
Number
Average Value
LOANS ORIGINATED
13
$125,020
393
$104,403
297
$119,401
41
$68,809
24
$106,638
62
$44,258
APPLICATIONS APPROVED, NOT ACCEPTED
2
$133,000
69
$92,625
62
$107,357
11
$20,519
0
$0
32
$60,250
APPLICATIONS DENIED
10
$81,200
165
$79,885
323
$141,054
71
$32,973
24
$151,988
112
$47,232
APPLICATIONS WITHDRAWN
1
$117,960
46
$116,150
149
$149,235
7
$79,189
4
$144,405
4
$56,500
FILES CLOSED FOR INCOMPLETENESS
0
$0
6
$108,667
65
$137,313
0
$0
2
$131,000
0
$0
Aggregated Statistics For Year 2005 (Based on 2 full and 2 partial tracts)
A) FHA, FSA/RHS & VA Home Purchase Loans
B) Conventional Home Purchase Loans
C) Refinancings
D) Home Improvement Loans
F) Non-occupant Loans on < 5 Family Dwellings (A B C & D)
G) Loans On Manufactured Home Dwelling (A B C & D)
Number
Average Value
Number
Average Value
Number
Average Value
Number
Average Value
Number
Average Value
Number
Average Value
LOANS ORIGINATED
14
$149,319
514
$117,310
362
$127,958
50
$33,600
20
$123,348
75
$49,491
APPLICATIONS APPROVED, NOT ACCEPTED
1
$143,460
85
$90,347
104
$120,678
10
$29,197
3
$122,947
55
$50,525
APPLICATIONS DENIED
6
$29,000
177
$62,088
330
$131,906
48
$41,634
29
$62,698
164
$46,582
APPLICATIONS WITHDRAWN
0
$0
53
$125,257
211
$160,779
20
$54,230
5
$18,928
18
$42,222
FILES CLOSED FOR INCOMPLETENESS
0
$0
27
$115,964
74
$137,814
1
$190,640
4
$110,000
2
$113,000
Aggregated Statistics For Year 2004 (Based on 2 full and 2 partial tracts)
A) FHA, FSA/RHS & VA Home Purchase Loans
B) Conventional Home Purchase Loans
C) Refinancings
D) Home Improvement Loans
E) Loans on Dwellings For 5+ Families
F) Non-occupant Loans on < 5 Family Dwellings (A B C & D)
G) Loans On Manufactured Home Dwelling (A B C & D)
Number
Average Value
Number
Average Value
Number
Average Value
Number
Average Value
Number
Average Value
Number
Average Value
Number
Average Value
LOANS ORIGINATED
16
$128,490
335
$113,356
353
$127,824
33
$85,724
1
$159,400
22
$98,776
93
$48,049
APPLICATIONS APPROVED, NOT ACCEPTED
0
$0
95
$75,033
77
$124,721
7
$12,626
0
$0
6
$50,000
83
$57,310
APPLICATIONS DENIED
5
$125,528
144
$73,434
252
$118,065
50
$14,640
1
$224,440
11
$51,301
125
$48,229
APPLICATIONS WITHDRAWN
2
$115,000
15
$102,811
112
$127,683
9
$27,790
0
$0
3
$130,147
6
$32,333
FILES CLOSED FOR INCOMPLETENESS
0
$0
14
$153,104
119
$130,187
1
$9,560
0
$0
4
$129,000
0
$0
Aggregated Statistics For Year 2003 (Based on 2 full and 2 partial tracts)
A) FHA, FSA/RHS & VA Home Purchase Loans
B) Conventional Home Purchase Loans
C) Refinancings
D) Home Improvement Loans
F) Non-occupant Loans on < 5 Family Dwellings (A B C & D)
Number
Average Value
Number
Average Value
Number
Average Value
Number
Average Value
Number
Average Value
LOANS ORIGINATED
35
$123,996
251
$110,730
693
$121,111
28
$35,808
31
$87,126
APPLICATIONS APPROVED, NOT ACCEPTED
0
$0
84
$75,259
154
$104,893
17
$42,356
7
$48,830
APPLICATIONS DENIED
10
$155,400
192
$61,418
445
$98,220
48
$24,613
19
$98,375
APPLICATIONS WITHDRAWN
0
$0
17
$183,544
122
$114,971
7
$22,873
4
$77,500
FILES CLOSED FOR INCOMPLETENESS
1
$95,640
3
$105,430
24
$132,487
0
$0
2
$91,000
Aggregated Statistics For Year 2002 (Based on 2 full and 2 partial tracts)
A) FHA, FSA/RHS & VA Home Purchase Loans
B) Conventional Home Purchase Loans
C) Refinancings
D) Home Improvement Loans
E) Loans on Dwellings For 5+ Families
F) Non-occupant Loans on < 5 Family Dwellings (A B C & D)
Number
Average Value
Number
Average Value
Number
Average Value
Number
Average Value
Number
Average Value
Number
Average Value
LOANS ORIGINATED
27
$137,727
372
$104,356
480
$120,561
25
$20,645
1
$158,760
39
$80,519
APPLICATIONS APPROVED, NOT ACCEPTED
7
$129,249
91
$64,690
109
$92,341
15
$47,583
0
$0
4
$25,500
APPLICATIONS DENIED
0
$0
224
$55,835
246
$79,571
51
$21,474
0
$0
13
$75,215
APPLICATIONS WITHDRAWN
0
$0
19
$166,164
102
$105,968
3
$35,043
0
$0
5
$53,588
FILES CLOSED FOR INCOMPLETENESS
4
$149,500
5
$149,384
63
$117,067
1
$31,880
0
$0
2
$70,000
Aggregated Statistics For Year 2001 (Based on 2 full and 2 partial tracts)
A) FHA, FSA/RHS & VA Home Purchase Loans
B) Conventional Home Purchase Loans
C) Refinancings
D) Home Improvement Loans
F) Non-occupant Loans on < 5 Family Dwellings (A B C & D)
Number
Average Value
Number
Average Value
Number
Average Value
Number
Average Value
Number
Average Value
LOANS ORIGINATED
31
$114,655
263
$68,998
453
$104,722
59
$32,098
40
$75,419
APPLICATIONS APPROVED, NOT ACCEPTED
0
$0
153
$50,515
99
$94,029
23
$33,505
10
$45,400
APPLICATIONS DENIED
7
$124,520
434
$45,613
276
$70,952
39
$15,539
5
$72,608
APPLICATIONS WITHDRAWN
0
$0
17
$116,306
79
$92,656
5
$112,078
5
$85,128
FILES CLOSED FOR INCOMPLETENESS
0
$0
2
$31,000
38
$97,794
1
$33,160
2
$50,000
Aggregated Statistics For Year 2000 (Based on 2 full and 2 partial tracts)
A) FHA, FSA/RHS & VA Home Purchase Loans
B) Conventional Home Purchase Loans
C) Refinancings
D) Home Improvement Loans
F) Non-occupant Loans on < 5 Family Dwellings (A B C & D)
Number
Average Value
Number
Average Value
Number
Average Value
Number
Average Value
Number
Average Value
LOANS ORIGINATED
43
$88,893
327
$64,745
112
$95,682
77
$21,501
8
$63,406
APPLICATIONS APPROVED, NOT ACCEPTED
2
$42,000
191
$48,757
56
$59,550
14
$21,216
0
$0
APPLICATIONS DENIED
2
$117,000
913
$45,660
124
$54,152
80
$18,088
11
$41,913
APPLICATIONS WITHDRAWN
1
$52,920
26
$69,847
35
$62,323
5
$26,718
1
$26,780
FILES CLOSED FOR INCOMPLETENESS
0
$0
1
$26,780
22
$117,135
1
$25,500
1
$26,780
Aggregated Statistics For Year 1999 (Based on 1 full and 1 partial tracts)
A) FHA, FSA/RHS & VA Home Purchase Loans
B) Conventional Home Purchase Loans
C) Refinancings
D) Home Improvement Loans
F) Non-occupant Loans on < 5 Family Dwellings (A B C & D)
Detailed PMIC statistics for the following Tracts:2170.00
, 2180.00
2002 - 2018 National Fire Incident Reporting System (NFIRS) incidents
Based on the data from the years 2002 - 2018 the average number of fires per year is 29. The highest number of fires - 48 took place in 2006, and the least - 8 in 2005. The data has a constant trend.
When looking into fire subcategories, the most reports belonged to: Structure Fires (37.5%), and Outside Fires (36.3%).
Fire incident types reported to NFIRS in Zip Code 48048


 Nearest zip codes: 48050, 48051, 48047, 48062, 48096, 48042.


 Based on the data from the years 2002 - 2018 the average number of fires per year is 29. The highest number of fires - 48 took place in 2006, and the least - 8 in 2005. The data has a constant trend.
 When looking into fire subcategories, the most reports belonged to: Structure Fires (37.5%), and Outside Fires (36.3%).