Estimated zip code population in 2022: 1,652 Zip code population in 2010: 1,332 Zip code population in 2000: 1,297
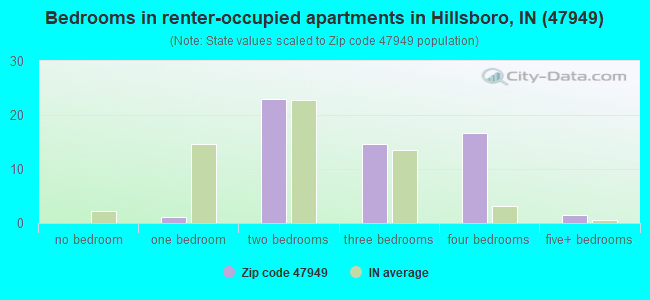
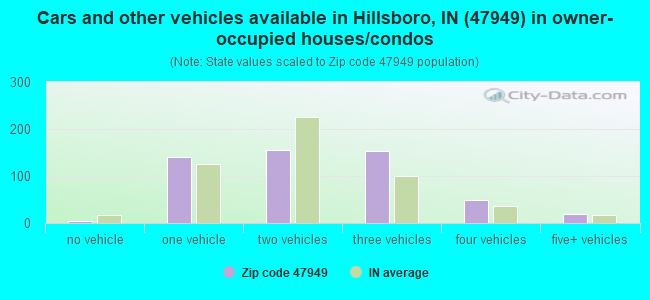
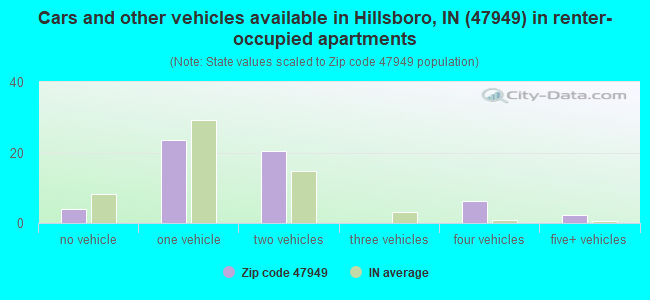
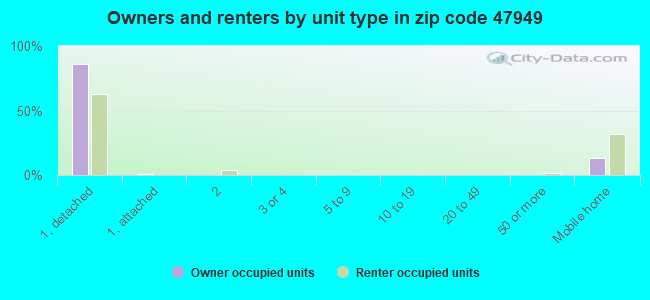
Houses and condos: 606 Renter-occupied apartments: 57
% of renters here:
10%
State:
29%
March 2022 cost of living index in zip code 47949: 84.9 (less than average, U.S. average is 100)
Land area: 41.9 sq. mi. Water area: 0.1 sq. mi.
Population density: 39 people per square mile
(very low).
OSM Map
General Map
Google Map
MSN Map
OSM Map
General Map
Google Map
MSN Map
OSM Map
General Map
Google Map
MSN Map
OSM Map
General Map
Google Map
MSN Map
Please wait while loading the map...
Real estate property taxes paid for housing units in 2022:
This zip code:
0.6% ($617)
Indiana:
0.7% ($1,467)
Median real estate property taxes paid for housing units with mortgages in 2022: $625 (0.5%) Median real estate property taxes paid for housing units with no mortgage in 2022: $620 (0.7%)
Business Search- 14 Million verified businesses
Males: 854
(51.7%)
Females: 798
(48.3%)
For population 25 years and over in 47949:
High school or higher: 92.5%
Bachelor's degree or higher: 12.7%
Graduate or professional degree: 3.1%
Unemployed: 4.1%
Mean travel time to work (commute): 30.1 minutes
For population 15 years and over in 47949:
Never married: 21.9%
Now married: 53.2%
Separated: 1.7%
Widowed: 2.9%
Divorced: 20.3%
Zip code 47949 compared to state average:
Median house value below state average.
Black race population percentage significantly below state average.
Hispanic race population percentage significantly below state average.
Median age below state average.
Foreign-born population percentage significantly below state average.
Renting percentage significantly below state average.
Length of stay since moving in significantly above state average.
House age above state average.
Number of college students significantly below state average.
Percentage of population with a bachelor's degree or higher significantly below state average.
Estimated median house/condo value in 2022: $108,328
47949:
$108,328
Indiana:
$208,700
Median resident age:
This zip code:
34.0 years
Indiana median age:
38.2 years
Average household size:
This zip code:
2.9 people
Indiana:
2.4 people
Averages for the 2020 tax year for zip code 47949, filed in 2021:
Average Adjusted Gross Income (AGI) in 2020: $53,758 (Individual Income Tax Returns)
Here:
$53,758
State:
$64,978
Salary/wage: $48,284 (reported on 79.0% of returns)
Here:
$48,284
State:
$55,245
(% of AGI for various income ranges: 1112.3% for AGIs below $25k, 3858.3% for AGIs $25k-50k, 6417.1% for AGIs $50k-75k, 8602.0% for AGIs $75k-100k, 21975.0% for AGIs $100k-200k)
Taxable interest for individuals: $753 (reported on 24.2% of returns)
This zip code:
$753
Indiana:
$1,351
(% of AGI for various income ranges: 12.3% for AGIs below $25k, 26.7% for AGIs $25k-50k, 40.0% for AGIs $75k-100k, 112.5% for AGIs $100k-200k)
Ordinary dividends: $1,667 (reported on 14.5% of returns)
Here:
$1,667
State:
$5,827
(% of AGI for various income ranges: 30.8% for AGIs below $25k, 52.9% for AGIs $50k-75k, 182.5% for AGIs $100k-200k)
Net capital gain/loss in AGI: +$2,288 (reported on 12.9% of returns)
Here:
+$2,288
State:
+$17,730
(% of AGI for various income ranges: 49.2% for AGIs below $25k, 111.4% for AGIs $50k-75k, 102.5% for AGIs $100k-200k)
Profit/loss from business: +$8,457 (reported on 11.3% of returns)
Here:
+$8,457
State:
+$12,144
(% of AGI for various income ranges: 123.1% for AGIs below $25k, 191.7% for AGIs $25k-50k, 404.0% for AGIs $75k-100k)
Taxable individual retirement arrangement distribution: $12,000 (reported on 8.1% of returns)
47949:
$12,000
Indiana:
$18,302
(% of AGI for various income ranges: 500.0% for AGIs $25k-50k)
Earned income credit: $2,280 (reported on 16.1% of returns)
Here:
$2,280
State:
$2,298
(% of AGI for various income ranges: 112.3% for AGIs below $25k, 68.3% for AGIs $25k-50k)
Percentage of individuals using paid preparers for their 2020 taxes: 93.5%
Here:
94%
State:
94%
(% for various income ranges: 95.0% for AGIs below $25k, 94.1% for AGIs $25k-50k, 88.9% for AGIs $50k-75k, 100.0% for AGIs $75k-100k, 88.9% for AGIs $100k-200k)
Averages for the 2012 tax year for zip code 47949, filed in 2013:
Average Adjusted Gross Income (AGI) in 2012: $47,312 (Individual Income Tax Returns)
Here:
$47,312
State:
$52,932
Salary/wage: $41,270 (reported on 80.7% of returns)
Here:
$41,270
State:
$45,173
(% of AGI for various income ranges: 66.7% for AGIs below $25k, 80.6% for AGIs $25k-50k, 75.5% for AGIs $50k-75k, 84.9% for AGIs $75k-100k, 54.6% for AGIs $100k-200k)
Taxable interest for individuals: $793 (reported on 26.3% of returns)
This zip code:
$793
Indiana:
$1,311
(% of AGI for various income ranges: 1.6% for AGIs below $25k, 0.7% for AGIs $25k-50k, 0.6% for AGIs $50k-75k, 0.1% for AGIs $100k-200k)
Ordinary dividends: $1,114 (reported on 12.3% of returns)
Here:
$1,114
State:
$4,690
Net capital gain/loss in AGI: +$13,400 (reported on 10.5% of returns)
Here:
+$13,400
State:
+$10,406
Profit/loss from business: +$5,514 (reported on 12.3% of returns)
Here:
+$5,514
State:
+$11,105
Taxable individual retirement arrangement distribution: $6,700 (reported on 8.8% of returns)
47949:
$6,700
Indiana:
$13,841
Total itemized deductions: $16,157 (18% of AGI, reported on 12.3% of returns)
Here:
$16,157
State:
$20,913
Here:
17.8% of AGI
State:
18.2% of AGI
Charity contributions: $4,060 (reported on 8.8% of returns)
Here:
$4,060
State:
$4,697
Taxes paid: $5,057 (reported on 12.3% of returns)
47949:
$5,057
State:
$7,456
Earned income credit: $2,080 (reported on 17.5% of returns)
Here:
$2,080
State:
$2,265
(% of AGI for various income ranges: 6.1% for AGIs below $25k, 1.3% for AGIs $25k-50k)
Percentage of individuals using paid preparers for their 2012 taxes: 64.9%
Here:
65%
State:
53%
(% for various income ranges: 61.9% for AGIs below $25k, 66.7% for AGIs $25k-50k, 66.7% for AGIs $50k-75k, 66.7% for AGIs $75k-100k, 66.7% for AGIs $100k-200k)
Averages for the 2004 tax year for zip code 47949, filed in 2005:
Average Adjusted Gross Income (AGI) in 2004: $37,156 (Individual Income Tax Returns)
Here:
$37,156
State:
$44,790
Salary/wage: $36,134 (reported on 83.5% of returns)
Here:
$36,134
State:
$39,615
(% of AGI for various income ranges: 77.8% for AGIs below $10k, 70.5% for AGIs $10k-25k, 88.5% for AGIs $25k-50k, 86.9% for AGIs $50k-75k, 85.5% for AGIs $75k-100k, 61.6% for AGIs over 100k)
Taxable interest for individuals: $1,143 (reported on 44.0% of returns)
This zip code:
$1,143
Indiana:
$1,535
(% of AGI for various income ranges: 13.0% for AGIs below $10k, 3.1% for AGIs $10k-25k, 1.0% for AGIs $25k-50k, 0.9% for AGIs $50k-75k, 0.4% for AGIs $75k-100k, 1.2% for AGIs over 100k)
Taxable dividends: $940 (reported on 17.5% of returns)
Here:
$940
State:
$2,998
(% of AGI for various income ranges: 3.8% for AGIs below $10k, 0.5% for AGIs $10k-25k, 0.2% for AGIs $25k-50k, 0.0% for AGIs $50k-75k, 0.1% for AGIs $75k-100k, 1.5% for AGIs over 100k)
Net capital gain/loss: +$2,987 (reported on 13.5% of returns)
Here:
+$2,987
State:
+$8,619
(% of AGI for various income ranges: 0.8% for AGIs below $10k, 0.1% for AGIs $10k-25k, 0.0% for AGIs $25k-50k, -0.1% for AGIs $50k-75k, 0.3% for AGIs $75k-100k, 6.6% for AGIs over 100k)
Profit/loss from business: +$2,567 (reported on 11.8% of returns)
Here:
+$2,567
State:
+$10,071
(% of AGI for various income ranges: 2.8% for AGIs below $10k, 1.8% for AGIs $10k-25k, 0.0% for AGIs $25k-50k, 1.2% for AGIs $50k-75k, 1.2% for AGIs $75k-100k)
IRA payment deduction: $2,250 (reported on 2.1% of returns)
47949:
$2,250
Indiana:
$2,840
Total itemized deductions: $13,687 (20% of AGI, reported on 17.4% of returns)
Here:
$13,687
State:
$17,065
Here:
19.8% of AGI
State:
19.5% of AGI
(% of AGI for various income ranges: 56.5% for AGIs below $10k, 5.2% for AGIs $25k-50k, 5.5% for AGIs $50k-75k, 8.1% for AGIs $75k-100k, 6.4% for AGIs over 100k)
Charity contributions deductions: $2,632 (3% of AGI, reported on 11.9% of returns)
Here:
$2,632
State:
$3,550
Here:
3.3% of AGI
State:
3.8% of AGI
(% of AGI for various income ranges: 0.8% for AGIs $25k-50k, 0.5% for AGIs $50k-75k, 1.3% for AGIs $75k-100k, 1.7% for AGIs over 100k)
Total tax: $4,943 (reported on 70.5% of returns)
47949:
$4,943
State:
$6,914
(% of AGI for various income ranges: 2.0% for AGIs below $10k, 3.0% for AGIs $10k-25k, 6.9% for AGIs $25k-50k, 8.9% for AGIs $50k-75k, 10.9% for AGIs $75k-100k, 18.0% for AGIs over 100k)
Earned income credit: $1,540 (reported on 15.3% of returns)
Here:
$1,540
State:
$1,685
Percentage of individuals using paid preparers for their 2004 taxes: 70.4%
Here:
70%
State:
59%
(% for various income ranges: 68.0% for AGIs below $10k, 70.5% for AGIs $10k-25k, 66.9% for AGIs $25k-50k, 69.8% for AGIs $50k-75k, 82.2% for AGIs $75k-100k, 85.7% for AGIs over 100k)
Likely homosexual households (counted as self-reported same-sex unmarried-partner households)
Lesbian couples: 1.2% of all households
Gay men: 0.0% of all households
Household received Food Stamps/SNAP in the past 12 months: 87 Household did not receive Food Stamps/SNAP in the past 12 months: 493
Women who had a birth in the past 12 months: 44 (30 now married, 13 unmarried) Women who did not have a birth in the past 12 months: 333 (136 now married, 196 unmarried)
Housing units in zip code 47949 with a mortgage: 289 (31 second mortgage, 1 home equity loan, 29 both second mortgage and home equity loan) Houses without a mortgage: 4
Median monthly owner costs for units with a mortgage: $959 Median monthly owner costs for units without a mortgage: $401
Residents with income below the poverty level in 2022:
This zip code:
7.1%
Whole state:
12.6%
Residents with income below 50% of the poverty level in 2022:
This zip code:
4.5%
Whole state:
6.3%
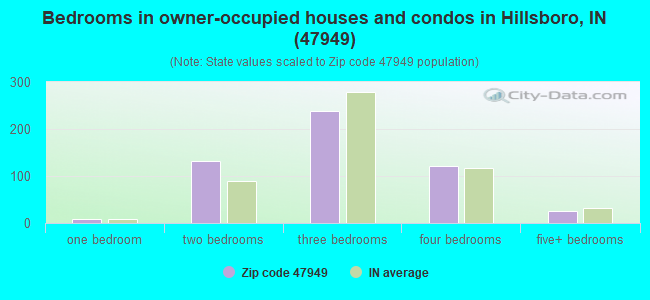
Median number of rooms in houses and condos:
Here:
6.2
State:
6.6
Median number of rooms in apartments:
Here:
5.8
State:
4.3
Notable locations in this zip code not listed on our city pages
Size of family households: 147 2-persons, 225 3-persons, 29 4-persons, 30 5-persons, 41 6-persons, 9 7-or-more-persons
Size of nonfamily households: 88 1-person, 9 2-persons
276 married couples with children.
118 single-parent households (47 men, 71 women).
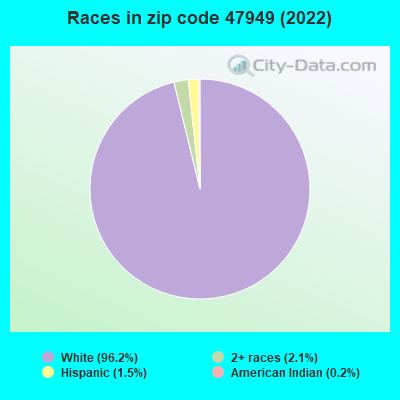
98.6% of residents of 47949 zip code speak English at home.
0.1% of residents speak other Indo-European language at home (100% very well).
0.1% of residents speak Asian or Pacific Island language at home (100% very well).
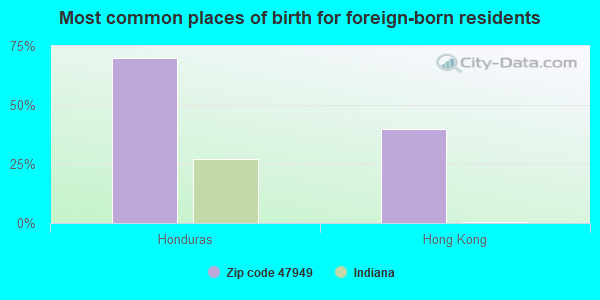
Foreign born population: 10 (0.7%) (31.1% of them are naturalized citizens)
This zip code:
0.7%
Whole state:
6.1%
70%Honduras
40%Hong Kong
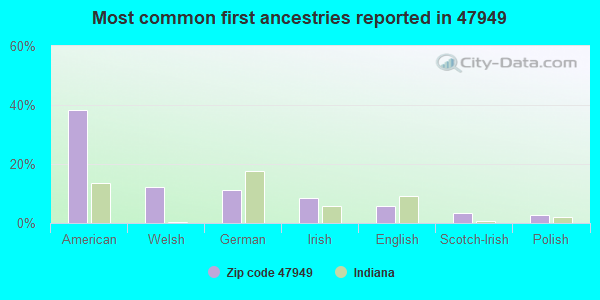
38%American
12%Welsh
11%German
8%Irish
6%English
3%Scotch-Irish
3%Polish
Year of entry for the foreign-born population
52010 or later
102000 to 2009
01990 to 1999
4Before 1990
Facilities with environmental interests located in this zip code:
MCGRADY HOG FARM #1 (TWIN LAKES ROAD in HILLSBORO, IN)
STATE MASTER (Indiana facility tracking) National Pollutant Discharge Elimination System NON-MAJOR (Tracking pollutant discharge elimination systems) - permit Business SIC classification: HOGS Organizations: MR. FRANCIS MCGRADY (CONTACT/OWNER)
Housing units lacking complete plumbing facilities: 1.5% Housing units lacking complete kitchen facilities: 5.1%
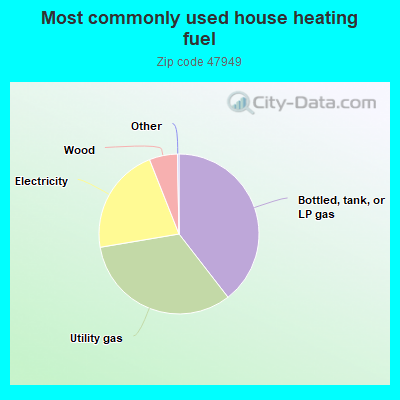
39.6%Bottled, tank, or LP gas
32.9%Utility gas
21.7%Electricity
5.7%Wood
Population in 1990: 2,318.
Place of birth for U.S.-born residents:
This state: 1,144
Northeast: 13
Midwest: 377
South: 76
West: 14
63% of the 47949 zip code residents lived in the same house 5 years ago. Out of people who lived in different houses, 47% lived in this county. Out of people who lived in different counties, 50% lived in Indiana.
84% of the 47949 zip code residents lived in the same house 1 year ago. Out of people who lived in different houses, 16% moved from this county. Out of people who lived in different houses, 60% moved from different county within same state. Out of people who lived in different houses, 23% moved from different state.
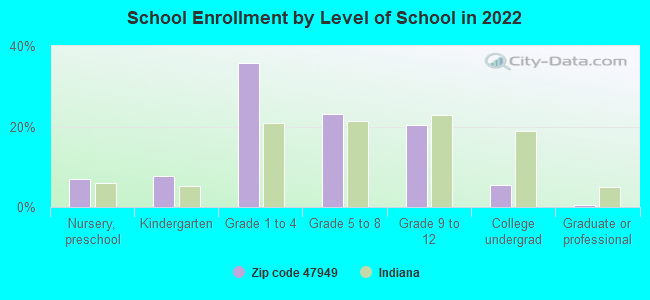
Private vs. public school enrollment:
Students in private schools in grades 1 to 8 (elementary and middle school): 11
Here:
5.4%
Indiana:
14.9%
Students in private schools in grades 9 to 12 (high school):
Here:
0.0%
Indiana:
11.4%
Students in private undergraduate colleges:
Here:
0.0%
Indiana:
22.3%
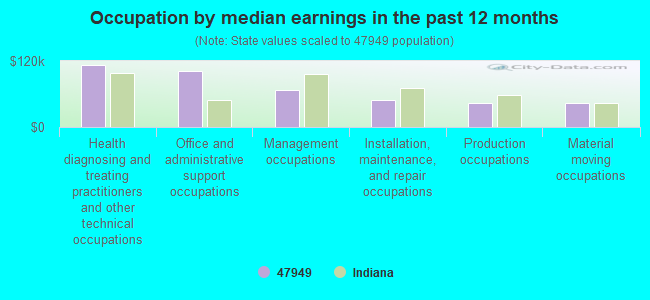
Occupation by median earnings in the past 12 months ($)
111,882Health diagnosing and treating practitioners and other technical occupations
101,379Office and administrative support occupations
66,990Management occupations
49,334Installation, maintenance, and repair occupations
43,381Production occupations
42,854Material moving occupations
Top industries in this zip code by the number of employees in 2005:
Accommodation and Food Services: Limited-Service Restaurants (10-19 employees: 1 establishment)
Utilities: Water Supply and Irrigation Systems (5-9: 1)
Accommodation and Food Services: Recreational and Vacation Camps (except Campgrounds) (5-9: 1)
Other Services (except Public Administration): General Automotive Repair (1-4: 1)
Arts, Entertainment, and Recreation: Fitness and Recreational Sports Centers (1-4: 1)
Finance and Insurance: Commercial Banking (1-4: 1)
Wholesale Trade: Recyclable Material Merchant Wholesalers (1-4: 1)
Fatal accident statistics in 2014:
Fatal accident count: 1
Vehicles involved in fatal accidents: 1
Fatal accidents caused by drunken drivers: 0
Fatalities: 1
Persons involved in fatal accidents: 2
Pedestrians involved in fatal accidents: 0
Fatal accident statistics in 2012:
Fatal accident count: 1
Vehicles involved in fatal accidents: 2
Fatal accidents caused by drunken drivers: 0
Fatalities: 1
Persons involved in fatal accidents: 6
Pedestrians involved in fatal accidents: 0
2002 - 2018 National Fire Incident Reporting System (NFIRS) incidents
Based on the data from the years 2002 - 2018 the average number of fires per year is 8. The highest number of reported fire incidents - 24 took place in 2010, and the least - 0 in 2016. The data has a decreasing trend.
When looking into fire subcategories, the most incidents belonged to: Outside Fires (40.6%), and Structure Fires (38.5%).
Fire incident types reported to NFIRS in Zip Code 47949


 Nearest zip codes: 47990, 47958, 47916, 47987, 47994, 47969.
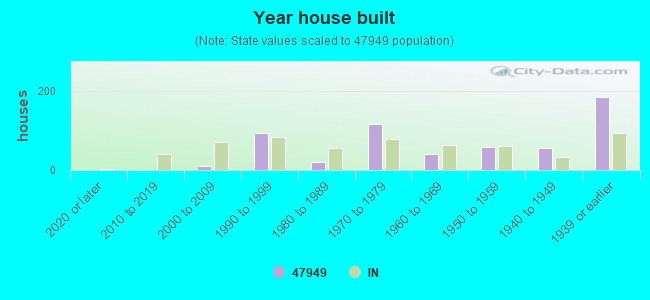


 Based on the data from the years 2002 - 2018 the average number of fires per year is 8. The highest number of reported fire incidents - 24 took place in 2010, and the least - 0 in 2016. The data has a decreasing trend.
 When looking into fire subcategories, the most incidents belonged to: Outside Fires (40.6%), and Structure Fires (38.5%).