Estimated zip code population in 2022: 2,822 Zip code population in 2010: 2,414 Zip code population in 2000: 2,149
Houses and condos: 1,103 Renter-occupied apartments: 115
% of renters here:
11%
State:
29%
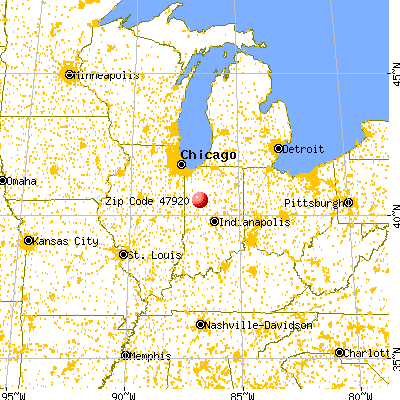
March 2022 cost of living index in zip code 47920: 84.9 (less than average, U.S. average is 100)
Land area: 28.4 sq. mi. Water area: 0.5 sq. mi.
Population density: 99 people per square mile
(very low).
OSM Map
General Map
Google Map
MSN Map
OSM Map
General Map
Google Map
MSN Map
OSM Map
General Map
Google Map
MSN Map
OSM Map
General Map
Google Map
MSN Map
Please wait while loading the map...
Real estate property taxes paid for housing units in 2022:
This zip code:
0.6% ($1,429)
Indiana:
0.7% ($1,467)
Median real estate property taxes paid for housing units with mortgages in 2022: $1,689 (0.6%) Median real estate property taxes paid for housing units with no mortgage in 2022: $1,202 (0.6%)
Business Search- 14 Million verified businesses
Males: 1,451
(51.4%)
Females: 1,371
(48.6%)
For population 25 years and over in 47920:
High school or higher: 93.3%
Bachelor's degree or higher: 36.5%
Graduate or professional degree: 10.5%
Unemployed: 0.9%
Mean travel time to work (commute): 27.3 minutes
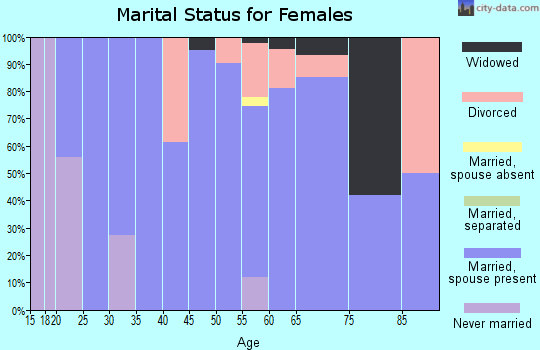
For population 15 years and over in 47920:
Never married: 25.9%
Now married: 59.7%
Separated: 0.9%
Widowed: 3.8%
Divorced: 9.7%
Zip code 47920 compared to state average:
Median household income above state average.
Unemployed percentage significantly below state average.
Black race population percentage significantly below state average.
Foreign-born population percentage significantly below state average.
Renting percentage significantly below state average.
Length of stay since moving in significantly above state average.
Estimated median house/condo value in 2022: $255,191
47920:
$255,191
Indiana:
$208,700
Median resident age:
This zip code:
40.6 years
Indiana median age:
38.2 years
Average household size:
This zip code:
2.7 people
Indiana:
2.4 people
Averages for the 2020 tax year for zip code 47920, filed in 2021:
Average Adjusted Gross Income (AGI) in 2020: $78,226 (Individual Income Tax Returns)
Here:
$78,226
State:
$64,978
Salary/wage: $65,305 (reported on 82.7% of returns)
Here:
$65,305
State:
$55,245
(% of AGI for various income ranges: 1030.8% for AGIs below $25k, 3706.1% for AGIs $25k-50k, 6223.6% for AGIs $50k-75k, 10126.7% for AGIs $75k-100k, 19750.0% for AGIs $100k-200k, 66415.0% for AGIs over 200k)
Taxable interest for individuals: $1,158 (reported on 36.1% of returns)
This zip code:
$1,158
Indiana:
$1,351
(% of AGI for various income ranges: 15.6% for AGIs below $25k, 14.3% for AGIs $25k-50k, 67.1% for AGIs $50k-75k, 94.4% for AGIs $75k-100k, 96.0% for AGIs $100k-200k, 805.0% for AGIs over 200k)
Ordinary dividends: $3,076 (reported on 21.8% of returns)
Here:
$3,076
State:
$5,827
(% of AGI for various income ranges: 12.4% for AGIs below $25k, 12.6% for AGIs $25k-50k, 44.3% for AGIs $50k-75k, 134.4% for AGIs $75k-100k, 240.7% for AGIs $100k-200k, 1440.0% for AGIs over 200k)
Net capital gain/loss in AGI: +$9,023 (reported on 19.5% of returns)
Here:
+$9,023
State:
+$17,730
(% of AGI for various income ranges: 8.8% for AGIs below $25k, 17.0% for AGIs $25k-50k, 123.6% for AGIs $50k-75k, 40.0% for AGIs $75k-100k, 636.7% for AGIs $100k-200k, 5605.0% for AGIs over 200k)
Profit/loss from business: +$11,047 (reported on 14.3% of returns)
Here:
+$11,047
State:
+$12,144
(% of AGI for various income ranges: 107.2% for AGIs below $25k, 47.4% for AGIs $25k-50k, 97.9% for AGIs $50k-75k, 597.8% for AGIs $75k-100k, 396.0% for AGIs $100k-200k, 2265.0% for AGIs over 200k)
Taxable individual retirement arrangement distribution: $25,200 (reported on 10.5% of returns)
47920:
$25,200
Indiana:
$18,302
(% of AGI for various income ranges: 145.2% for AGIs below $25k, 595.0% for AGIs $50k-75k, 1554.7% for AGIs $100k-200k)
Total itemized deductions: $32,789 (reported on 6.8% of returns)
Here:
$32,789
State:
$35,601
(% of AGI for various income ranges: 212.4% for AGIs below $25k, 672.7% for AGIs $100k-200k, 7055.0% for AGIs over 200k)
Charity contributions: $11,212 (reported on 6.0% of returns)
Here:
$11,212
State:
$15,596
(% of AGI for various income ranges: 254.0% for AGIs $100k-200k, 2580.0% for AGIs over 200k)
Taxes paid: $7,556 (reported on 6.8% of returns)
47920:
$7,556
State:
$7,542
(% of AGI for various income ranges: 43.2% for AGIs below $25k, 198.7% for AGIs $100k-200k, 1370.0% for AGIs over 200k)
Earned income credit: $2,258 (reported on 9.0% of returns)
Here:
$2,258
State:
$2,298
(% of AGI for various income ranges: 62.4% for AGIs below $25k, 50.0% for AGIs $25k-50k)
Percentage of individuals using paid preparers for their 2020 taxes: 95.5%
Here:
95%
State:
94%
(% for various income ranges: 91.7% for AGIs below $25k, 96.4% for AGIs $25k-50k, 94.7% for AGIs $50k-75k, 100.0% for AGIs $75k-100k, 96.6% for AGIs $100k-200k, 100.0% for AGIs over 200k)
Averages for the 2012 tax year for zip code 47920, filed in 2013:
Average Adjusted Gross Income (AGI) in 2012: $61,377 (Individual Income Tax Returns)
Here:
$61,377
State:
$52,932
Salary/wage: $50,374 (reported on 86.7% of returns)
Here:
$50,374
State:
$45,173
(% of AGI for various income ranges: 74.8% for AGIs below $25k, 76.1% for AGIs $25k-50k, 79.5% for AGIs $50k-75k, 76.3% for AGIs $75k-100k, 79.8% for AGIs $100k-200k, 38.9% for AGIs over 200k)
Taxable interest for individuals: $933 (reported on 35.0% of returns)
This zip code:
$933
Indiana:
$1,311
(% of AGI for various income ranges: 0.7% for AGIs below $25k, 0.8% for AGIs $25k-50k, 0.3% for AGIs $50k-75k, 0.8% for AGIs $75k-100k, 0.5% for AGIs $100k-200k, 0.3% for AGIs over 200k)
Ordinary dividends: $3,017 (reported on 19.2% of returns)
Here:
$3,017
State:
$4,690
(% of AGI for various income ranges: 0.4% for AGIs below $25k, 1.0% for AGIs $25k-50k, 0.2% for AGIs $50k-75k, 1.0% for AGIs $75k-100k, 2.0% for AGIs $100k-200k)
Net capital gain/loss in AGI: +$6,813 (reported on 12.5% of returns)
Here:
+$6,813
State:
+$10,406
(% of AGI for various income ranges: 1.3% for AGIs $75k-100k, 1.1% for AGIs $100k-200k, 4.8% for AGIs over 200k)
Profit/loss from business: +$7,522 (reported on 15.0% of returns)
Here:
+$7,522
State:
+$11,105
(% of AGI for various income ranges: 2.8% for AGIs below $25k, 5.4% for AGIs $25k-50k, 1.5% for AGIs $50k-75k, 2.3% for AGIs $75k-100k, 1.2% for AGIs $100k-200k)
Taxable individual retirement arrangement distribution: $14,693 (reported on 12.5% of returns)
47920:
$14,693
Indiana:
$13,841
(% of AGI for various income ranges: 2.3% for AGIs below $25k, 6.4% for AGIs $25k-50k, 3.4% for AGIs $75k-100k, 5.0% for AGIs $100k-200k)
Total itemized deductions: $21,494 (18% of AGI, reported on 28.3% of returns)
Here:
$21,494
State:
$20,913
Here:
17.9% of AGI
State:
18.2% of AGI
(% of AGI for various income ranges: 4.5% for AGIs below $25k, 7.1% for AGIs $25k-50k, 5.8% for AGIs $50k-75k, 10.5% for AGIs $75k-100k, 14.0% for AGIs $100k-200k, 10.5% for AGIs over 200k)
Charity contributions: $5,166 (reported on 24.2% of returns)
Here:
$5,166
State:
$4,697
(% of AGI for various income ranges: 1.2% for AGIs $25k-50k, 0.7% for AGIs $50k-75k, 2.1% for AGIs $75k-100k, 2.7% for AGIs $100k-200k, 3.5% for AGIs over 200k)
Taxes paid: $7,518 (reported on 28.3% of returns)
47920:
$7,518
State:
$7,456
(% of AGI for various income ranges: 1.6% for AGIs $25k-50k, 1.7% for AGIs $50k-75k, 3.0% for AGIs $75k-100k, 5.2% for AGIs $100k-200k, 5.3% for AGIs over 200k)
Earned income credit: $1,933 (reported on 12.5% of returns)
Here:
$1,933
State:
$2,265
(% of AGI for various income ranges: 4.1% for AGIs below $25k, 1.0% for AGIs $25k-50k)
Percentage of individuals using paid preparers for their 2012 taxes: 48.3%
Here:
48%
State:
53%
(% for various income ranges: 35.7% for AGIs below $25k, 52.0% for AGIs $25k-50k, 55.0% for AGIs $50k-75k, 53.8% for AGIs $75k-100k, 58.8% for AGIs $100k-200k, 66.7% for AGIs over 200k)
Averages for the 2004 tax year for zip code 47920, filed in 2005:
Average Adjusted Gross Income (AGI) in 2004: $48,031 (Individual Income Tax Returns)
Here:
$48,031
State:
$44,790
Salary/wage: $41,413 (reported on 88.1% of returns)
Here:
$41,413
State:
$39,615
(% of AGI for various income ranges: 221.4% for AGIs below $10k, 76.2% for AGIs $10k-25k, 85.5% for AGIs $25k-50k, 84.0% for AGIs $50k-75k, 83.3% for AGIs $75k-100k, 56.5% for AGIs over 100k)
Taxable interest for individuals: $1,223 (reported on 51.1% of returns)
This zip code:
$1,223
Indiana:
$1,535
(% of AGI for various income ranges: 11.6% for AGIs below $10k, 2.5% for AGIs $10k-25k, 1.0% for AGIs $25k-50k, 1.0% for AGIs $50k-75k, 1.0% for AGIs $75k-100k, 1.4% for AGIs over 100k)
Taxable dividends: $2,064 (reported on 23.0% of returns)
Here:
$2,064
State:
$2,998
(% of AGI for various income ranges: 4.9% for AGIs below $10k, 0.7% for AGIs $10k-25k, 0.4% for AGIs $25k-50k, 0.4% for AGIs $50k-75k, 0.6% for AGIs $75k-100k, 2.0% for AGIs over 100k)
Net capital gain/loss: +$7,681 (reported on 17.7% of returns)
Here:
+$7,681
State:
+$8,619
(% of AGI for various income ranges: -3.6% for AGIs below $10k, 1.4% for AGIs $10k-25k, -0.0% for AGIs $25k-50k, 1.6% for AGIs $50k-75k, 0.9% for AGIs $75k-100k, 7.1% for AGIs over 100k)
Profit/loss from business: +$6,068 (reported on 14.0% of returns)
Here:
+$6,068
State:
+$10,071
(% of AGI for various income ranges: -11.6% for AGIs below $10k, 4.6% for AGIs $10k-25k, 2.3% for AGIs $25k-50k, 2.3% for AGIs $50k-75k, 0.4% for AGIs $75k-100k, 1.6% for AGIs over 100k)
IRA payment deduction: $3,000 (reported on 3.4% of returns)
47920:
$3,000
Indiana:
$2,840
Total itemized deductions: $16,859 (20% of AGI, reported on 34.4% of returns)
Here:
$16,859
State:
$17,065
Here:
20.3% of AGI
State:
19.5% of AGI
(% of AGI for various income ranges: 12.9% for AGIs $10k-25k, 11.1% for AGIs $25k-50k, 11.5% for AGIs $50k-75k, 13.8% for AGIs $75k-100k, 12.0% for AGIs over 100k)
Charity contributions deductions: $2,916 (3% of AGI, reported on 29.0% of returns)
Here:
$2,916
State:
$3,550
Here:
3.3% of AGI
State:
3.8% of AGI
(% of AGI for various income ranges: 1.0% for AGIs $10k-25k, 1.3% for AGIs $25k-50k, 1.7% for AGIs $50k-75k, 2.0% for AGIs $75k-100k, 2.1% for AGIs over 100k)
Total tax: $6,549 (reported on 75.8% of returns)
47920:
$6,549
State:
$6,914
(% of AGI for various income ranges: 4.9% for AGIs below $10k, 3.9% for AGIs $10k-25k, 6.4% for AGIs $25k-50k, 8.3% for AGIs $50k-75k, 9.9% for AGIs $75k-100k, 15.9% for AGIs over 100k)
Earned income credit: $1,646 (reported on 11.3% of returns)
Here:
$1,646
State:
$1,685
Percentage of individuals using paid preparers for their 2004 taxes: 51.6%
Here:
52%
State:
59%
(% for various income ranges: 38.8% for AGIs below $10k, 52.6% for AGIs $10k-25k, 55.8% for AGIs $25k-50k, 54.0% for AGIs $50k-75k, 50.0% for AGIs $75k-100k, 63.7% for AGIs over 100k)
Household received Food Stamps/SNAP in the past 12 months: 18 Household did not receive Food Stamps/SNAP in the past 12 months: 1,022
Women who had a birth in the past 12 months: 43 (38 now married, 6 unmarried) Women who did not have a birth in the past 12 months: 629 (301 now married, 328 unmarried)
Housing units in zip code 47920 with a mortgage: 607 (91 second mortgage, 94 both second mortgage and home equity loan) Median monthly owner costs for units with a mortgage: $1,488 Median monthly owner costs for units without a mortgage: $519
Residents with income below the poverty level in 2022:
This zip code:
3.2%
Whole state:
12.6%
Residents with income below 50% of the poverty level in 2022:
This zip code:
2.3%
Whole state:
6.3%
Median number of rooms in houses and condos:
Here:
7.1
State:
6.6
Median number of rooms in apartments:
Here:
5.1
State:
4.3
Notable locations in this zip code not listed on our city pages
Size of family households: 395 2-persons, 166 3-persons, 142 4-persons, 81 5-persons, 61 6-persons, 3 7-or-more-persons
Size of nonfamily households: 188 1-person, 2 2-persons, 3 3-persons
500 married couples with children.
156 single-parent households (65 men, 91 women).
87.0% of residents of 47920 zip code speak English at home.
11.7% of residents speak Spanish at home (66% very well, 30% well, 4% not at all).
0.4% of residents speak other Indo-European language at home (100% very well).
Foreign born population: 20 (0.7%) (43.3% of them are naturalized citizens)
This zip code:
0.7%
Whole state:
6.1%
60%Chile
55%Honduras
32%American
25%German
16%English
7%Irish
2%European
2%Scottish
1%French
Year of entry for the foreign-born population
102010 or later
112000 to 2009
01990 to 1999
0Before 1990
Facilities with environmental interests located in this zip code:
BATTLE GROUND MUNICIPAL WWTP (6301 PROPHETS ROCK RD in BATTLE GROUND, IN)
STATE MASTER (Indiana facility tracking) - CRTK-1362, EPCRA National Pollutant Discharge Elimination System NON-MAJOR (Tracking pollutant discharge elimination systems) - permit Business SIC classification: SEWERAGE SYSTEMS Organizations: JON MCMILLIN 6922 (CONTACT/OPERATOR)
, TOWN COUNCIL PRESIDENT (CONTACT/OWNER)
Alternative names: BATTLEGROUND MUNICIPAL STP, BATTLEGROUND STP
BATTLE GROUND MIDDLE SCHOOL (511 MAIN ST in BATTLE GROUND, IN)
(National Center for Education Statistics) - STATE ID-8025 Organizations: TIPPECANOE SCHOOL CORP (SCHOOL DISTRICT)
ASH GROVE (3452 EAST 900 N in BATTLE GROUND, IN)
ENFORCEMENT/COMPLIANCE ACTIVITY (Integrated Compliance Information System)
Housing units lacking complete plumbing facilities: 0.6%
43.9%Utility gas
35.1%Bottled, tank, or LP gas
18.5%Electricity
2.7%Wood
Population in 1990: 1,646. Population change in the 1990s: +503 (+30.6%).
Place of birth for U.S.-born residents:
This state: 2,340
Northeast: 35
Midwest: 318
South: 68
West: 20
70% of the 47920 zip code residents lived in the same house 5 years ago. Out of people who lived in different houses, 60% lived in this county. Out of people who lived in different counties, 50% lived in Indiana.
94% of the 47920 zip code residents lived in the same house 1 year ago. Out of people who lived in different houses, 79% moved from this county. Out of people who lived in different houses, 23% moved from different county within same state.
Private vs. public school enrollment:
Students in private schools in grades 1 to 8 (elementary and middle school): 2
Here:
0.9%
Indiana:
14.9%
Students in private schools in grades 9 to 12 (high school): 17
Here:
8.0%
Indiana:
11.4%
Students in private undergraduate colleges: 9
Here:
9.3%
Indiana:
22.3%
Occupation by median earnings in the past 12 months ($)
114,603Management occupations
91,077Architecture and engineering occupations
87,999Business and financial operations occupations
78,538Law enforcement workers including supervisors
75,345Health technologists and technicians
68,888Community and social service occupations
Top industries in this zip code by the number of employees in 2005:
Construction: New Single-Family Housing Construction (except Operative Builders) (20-49 employees: 1 establishment)
Accommodation and Food Services: Full-Service Restaurants (10-19: 1)
Construction: Commercial and Institutional Building Construction (10-19: 1)
Administrative and Support and Waste Management and Remediation Services: Janitorial Services (10-19: 1)
Arts, Entertainment, and Recreation: Zoos and Botanical Gardens (10-19: 1)
Other Services (except Public Administration): Religious Organizations (5-9: 1)
Finance and Insurance: Commercial Banking (5-9: 1)
Fatal accident statistics in 2012:
Fatal accident count: 1
Vehicles involved in fatal accidents: 2
Fatal accidents caused by drunken drivers: 1
Fatalities: 1
Persons involved in fatal accidents: 6
Pedestrians involved in fatal accidents: 0
Fatal accident statistics in 2011:
Fatal accident count: 1
Vehicles involved in fatal accidents: 1
Fatal accidents caused by drunken drivers: 1
Fatalities: 1
Persons involved in fatal accidents: 1
Pedestrians involved in fatal accidents: 0
Home Mortgage Disclosure Act Aggregated Statistics For Year 2009 (Based on 2 partial tracts)
A) FHA, FSA/RHS & VA Home Purchase Loans
B) Conventional Home Purchase Loans
C) Refinancings
D) Home Improvement Loans
F) Non-occupant Loans on < 5 Family Dwellings (A B C & D)
G) Loans On Manufactured Home Dwelling (A B C & D)
Number
Average Value
Number
Average Value
Number
Average Value
Number
Average Value
Number
Average Value
Number
Average Value
LOANS ORIGINATED
23
$136,702
31
$161,461
144
$142,160
9
$11,347
2
$80,235
1
$63,730
APPLICATIONS APPROVED, NOT ACCEPTED
0
$0
2
$24,570
6
$169,683
0
$0
1
$26,110
0
$0
APPLICATIONS DENIED
6
$159,318
5
$178,744
43
$128,455
5
$48,832
4
$61,808
1
$80,620
APPLICATIONS WITHDRAWN
2
$110,180
2
$49,905
31
$165,696
2
$34,165
0
$0
1
$52,210
FILES CLOSED FOR INCOMPLETENESS
2
$121,695
0
$0
4
$171,412
1
$11,520
0
$0
0
$0
Aggregated Statistics For Year 2008 (Based on 2 partial tracts)
A) FHA, FSA/RHS & VA Home Purchase Loans
B) Conventional Home Purchase Loans
C) Refinancings
D) Home Improvement Loans
E) Loans on Dwellings For 5+ Families
F) Non-occupant Loans on < 5 Family Dwellings (A B C & D)
G) Loans On Manufactured Home Dwelling (A B C & D)
Number
Average Value
Number
Average Value
Number
Average Value
Number
Average Value
Number
Average Value
Number
Average Value
Number
Average Value
LOANS ORIGINATED
15
$156,119
31
$138,476
78
$123,429
8
$79,659
1
$251,840
7
$59,560
4
$88,105
APPLICATIONS APPROVED, NOT ACCEPTED
1
$91,370
6
$131,933
10
$133,674
1
$19,200
0
$0
2
$59,120
2
$46,450
APPLICATIONS DENIED
5
$101,656
4
$94,822
54
$111,032
8
$36,950
0
$0
2
$71,020
2
$113,635
APPLICATIONS WITHDRAWN
2
$113,250
8
$153,176
22
$128,990
2
$95,590
0
$0
2
$27,640
0
$0
FILES CLOSED FOR INCOMPLETENESS
0
$0
2
$39,925
2
$124,000
0
$0
0
$0
0
$0
0
$0
Aggregated Statistics For Year 2007 (Based on 2 partial tracts)
A) FHA, FSA/RHS & VA Home Purchase Loans
B) Conventional Home Purchase Loans
C) Refinancings
D) Home Improvement Loans
F) Non-occupant Loans on < 5 Family Dwellings (A B C & D)
G) Loans On Manufactured Home Dwelling (A B C & D)
Number
Average Value
Number
Average Value
Number
Average Value
Number
Average Value
Number
Average Value
Number
Average Value
LOANS ORIGINATED
8
$104,038
61
$134,227
73
$126,361
16
$38,678
9
$87,870
3
$70,637
APPLICATIONS APPROVED, NOT ACCEPTED
2
$99,815
7
$161,567
17
$80,077
2
$15,740
2
$117,475
2
$60,270
APPLICATIONS DENIED
0
$0
12
$82,282
48
$109,204
16
$54,562
4
$47,602
3
$73,197
APPLICATIONS WITHDRAWN
0
$0
6
$115,042
17
$115,079
5
$42,690
2
$110,565
2
$34,550
FILES CLOSED FOR INCOMPLETENESS
0
$0
2
$174,675
7
$99,814
1
$169,680
0
$0
0
$0
Aggregated Statistics For Year 2006 (Based on 2 partial tracts)
A) FHA, FSA/RHS & VA Home Purchase Loans
B) Conventional Home Purchase Loans
C) Refinancings
D) Home Improvement Loans
F) Non-occupant Loans on < 5 Family Dwellings (A B C & D)
G) Loans On Manufactured Home Dwelling (A B C & D)
Number
Average Value
Number
Average Value
Number
Average Value
Number
Average Value
Number
Average Value
Number
Average Value
LOANS ORIGINATED
5
$116,706
68
$113,171
74
$96,380
18
$32,119
8
$55,858
5
$86,608
APPLICATIONS APPROVED, NOT ACCEPTED
0
$0
2
$117,855
17
$118,332
5
$45,454
1
$39,930
1
$66,030
APPLICATIONS DENIED
1
$102,120
15
$92,289
60
$103,333
10
$46,913
3
$71,917
4
$81,770
APPLICATIONS WITHDRAWN
0
$0
4
$94,822
31
$134,860
5
$89,526
1
$106,720
0
$0
FILES CLOSED FOR INCOMPLETENESS
0
$0
2
$64,110
16
$120,641
0
$0
0
$0
0
$0
Aggregated Statistics For Year 2005 (Based on 2 partial tracts)
A) FHA, FSA/RHS & VA Home Purchase Loans
B) Conventional Home Purchase Loans
C) Refinancings
D) Home Improvement Loans
F) Non-occupant Loans on < 5 Family Dwellings (A B C & D)
G) Loans On Manufactured Home Dwelling (A B C & D)
Number
Average Value
Number
Average Value
Number
Average Value
Number
Average Value
Number
Average Value
Number
Average Value
LOANS ORIGINATED
7
$98,937
63
$113,269
88
$119,637
5
$49,446
11
$73,360
4
$65,070
APPLICATIONS APPROVED, NOT ACCEPTED
2
$106,725
8
$107,012
12
$97,702
4
$39,925
0
$0
2
$72,555
APPLICATIONS DENIED
2
$115,940
8
$106,340
59
$123,798
11
$41,531
8
$182,832
7
$97,401
APPLICATIONS WITHDRAWN
1
$94,440
6
$86,377
31
$105,238
3
$102,373
2
$82,540
2
$125,920
FILES CLOSED FOR INCOMPLETENESS
0
$0
6
$86,122
21
$133,085
0
$0
0
$0
0
$0
Aggregated Statistics For Year 2004 (Based on 2 partial tracts)
A) FHA, FSA/RHS & VA Home Purchase Loans
B) Conventional Home Purchase Loans
C) Refinancings
D) Home Improvement Loans
F) Non-occupant Loans on < 5 Family Dwellings (A B C & D)
G) Loans On Manufactured Home Dwelling (A B C & D)
Number
Average Value
Number
Average Value
Number
Average Value
Number
Average Value
Number
Average Value
Number
Average Value
LOANS ORIGINATED
10
$105,649
68
$133,021
131
$110,968
10
$69,332
8
$74,956
3
$94,950
APPLICATIONS APPROVED, NOT ACCEPTED
4
$100,775
8
$95,782
15
$135,337
2
$45,300
2
$48,755
0
$0
APPLICATIONS DENIED
4
$92,328
12
$147,098
72
$89,491
14
$44,532
6
$147,290
5
$50,522
APPLICATIONS WITHDRAWN
1
$66,030
5
$110,716
28
$112,483
4
$145,498
2
$91,370
2
$75,630
FILES CLOSED FOR INCOMPLETENESS
0
$0
1
$138,200
16
$117,761
1
$36,850
1
$66,030
0
$0
Aggregated Statistics For Year 2003 (Based on 2 partial tracts)
A) FHA, FSA/RHS & VA Home Purchase Loans
B) Conventional Home Purchase Loans
C) Refinancings
D) Home Improvement Loans
F) Non-occupant Loans on < 5 Family Dwellings (A B C & D)
Number
Average Value
Number
Average Value
Number
Average Value
Number
Average Value
Number
Average Value
LOANS ORIGINATED
9
$130,100
72
$128,297
325
$114,757
10
$49,600
15
$74,118
APPLICATIONS APPROVED, NOT ACCEPTED
1
$66,800
3
$106,213
31
$87,802
1
$23,030
1
$46,070
APPLICATIONS DENIED
1
$120,540
9
$106,383
81
$96,942
5
$20,884
2
$65,265
APPLICATIONS WITHDRAWN
2
$135,900
11
$105,398
48
$105,876
0
$0
3
$140,507
FILES CLOSED FOR INCOMPLETENESS
0
$0
3
$101,350
8
$85,514
1
$7,680
0
$0
Aggregated Statistics For Year 2002 (Based on 2 partial tracts)
A) FHA, FSA/RHS & VA Home Purchase Loans
B) Conventional Home Purchase Loans
C) Refinancings
D) Home Improvement Loans
F) Non-occupant Loans on < 5 Family Dwellings (A B C & D)
Number
Average Value
Number
Average Value
Number
Average Value
Number
Average Value
Number
Average Value
LOANS ORIGINATED
9
$109,113
49
$130,636
233
$111,786
8
$24,090
13
$88,179
APPLICATIONS APPROVED, NOT ACCEPTED
0
$0
1
$107,490
16
$97,799
2
$15,740
0
$0
APPLICATIONS DENIED
1
$66,030
8
$93,768
73
$88,413
2
$74,475
2
$107,490
APPLICATIONS WITHDRAWN
0
$0
2
$174,675
34
$116,502
0
$0
0
$0
FILES CLOSED FOR INCOMPLETENESS
0
$0
1
$38,390
11
$122,918
0
$0
0
$0
Aggregated Statistics For Year 2001 (Based on 2 partial tracts)
A) FHA, FSA/RHS & VA Home Purchase Loans
B) Conventional Home Purchase Loans
C) Refinancings
D) Home Improvement Loans
F) Non-occupant Loans on < 5 Family Dwellings (A B C & D)
Number
Average Value
Number
Average Value
Number
Average Value
Number
Average Value
Number
Average Value
LOANS ORIGINATED
16
$88,825
62
$152,817
188
$103,363
28
$24,515
12
$64,431
APPLICATIONS APPROVED, NOT ACCEPTED
1
$57,590
9
$116,193
18
$83,178
6
$20,987
0
$0
APPLICATIONS DENIED
0
$0
17
$69,464
62
$94,799
12
$19,067
5
$83,998
APPLICATIONS WITHDRAWN
0
$0
7
$111,550
38
$97,874
3
$18,683
3
$116,450
FILES CLOSED FOR INCOMPLETENESS
0
$0
0
$0
9
$89,748
0
$0
0
$0
Aggregated Statistics For Year 2000 (Based on 2 partial tracts)
A) FHA, FSA/RHS & VA Home Purchase Loans
B) Conventional Home Purchase Loans
C) Refinancings
D) Home Improvement Loans
F) Non-occupant Loans on < 5 Family Dwellings (A B C & D)
Number
Average Value
Number
Average Value
Number
Average Value
Number
Average Value
Number
Average Value
LOANS ORIGINATED
12
$93,223
73
$125,046
36
$71,811
36
$27,278
3
$149,977
APPLICATIONS APPROVED, NOT ACCEPTED
0
$0
12
$65,455
13
$87,352
4
$20,538
2
$44,530
APPLICATIONS DENIED
3
$79,340
30
$74,656
29
$71,061
9
$22,010
3
$56,817
APPLICATIONS WITHDRAWN
0
$0
5
$130,986
21
$81,240
2
$17,275
0
$0
FILES CLOSED FOR INCOMPLETENESS
0
$0
0
$0
6
$77,292
0
$0
1
$42,230
Aggregated Statistics For Year 1999 (Based on 1 partial tract)
A) FHA, FSA/RHS & VA Home Purchase Loans
B) Conventional Home Purchase Loans
C) Refinancings
D) Home Improvement Loans
F) Non-occupant Loans on < 5 Family Dwellings (A B C & D)
Detailed PMIC statistics for the following Tracts:0101.00
2002 - 2018 National Fire Incident Reporting System (NFIRS) incidents
Based on the data from the years 2002 - 2018 the average number of fires per year is 25. The highest number of reported fire incidents - 53 took place in 2012, and the least - 2 in 2014. The data has a dropping trend.
When looking into fire subcategories, the most reports belonged to: Outside Fires (41.4%), and Structure Fires (32.4%).
Fire incident types reported to NFIRS in Zip Code 47920


 Nearest zip codes: 47924, 47904, 47923, 47901, 47905, 47907.


 Based on the data from the years 2002 - 2018 the average number of fires per year is 25. The highest number of reported fire incidents - 53 took place in 2012, and the least - 2 in 2014. The data has a dropping trend.
 When looking into fire subcategories, the most reports belonged to: Outside Fires (41.4%), and Structure Fires (32.4%).