Estimated zip code population in 2022: 2,929 Zip code population in 2010: 3,267 Zip code population in 2000: 2,968
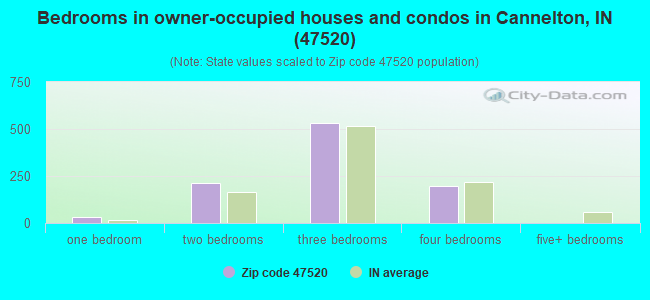
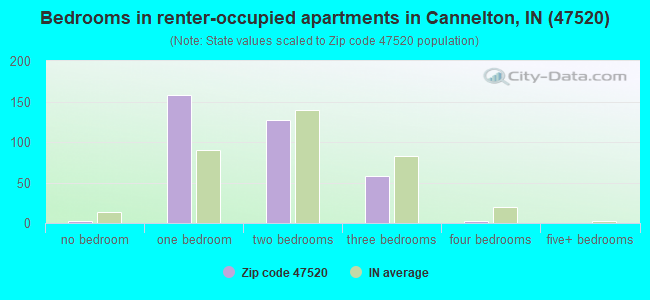
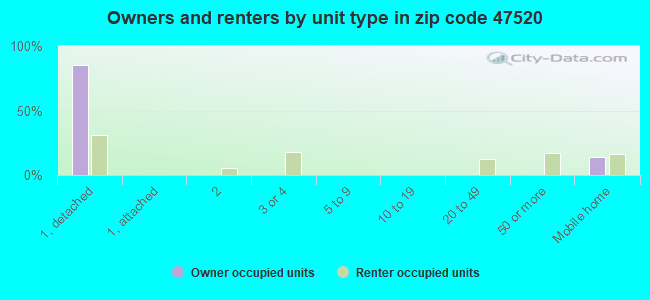
Houses and condos: 1,570 Renter-occupied apartments: 344
% of renters here:
26%
State:
29%
March 2022 cost of living index in zip code 47520: 84.9 (less than average, U.S. average is 100)
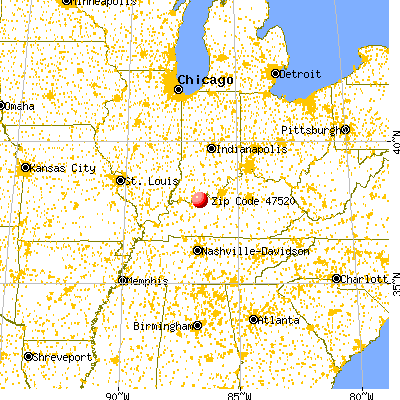
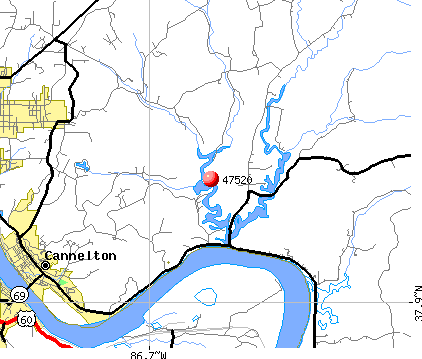
Land area: 81.5 sq. mi. Water area: 2.2 sq. mi.
Population density: 36 people per square mile
(very low).
OSM Map
General Map
Google Map
MSN Map
OSM Map
General Map
Google Map
MSN Map
OSM Map
General Map
Google Map
MSN Map
OSM Map
General Map
Google Map
MSN Map
Please wait while loading the map...
Real estate property taxes paid for housing units in 2022:
This zip code:
0.6% ($960)
Indiana:
0.7% ($1,467)
Median real estate property taxes paid for housing units with mortgages in 2022: $1,358 (0.8%) Median real estate property taxes paid for housing units with no mortgage in 2022: $610 (0.6%)
Business Search- 14 Million verified businesses
Males: 1,551
(53.0%)
Females: 1,378
(47.0%)
For population 25 years and over in 47520:
High school or higher: 90.5%
Bachelor's degree or higher: 11.2%
Graduate or professional degree: 4.6%
Unemployed: 5.5%
Mean travel time to work (commute): 24.8 minutes
For population 15 years and over in 47520:
Never married: 23.9%
Now married: 52.8%
Separated: 2.2%
Widowed: 5.0%
Divorced: 16.0%
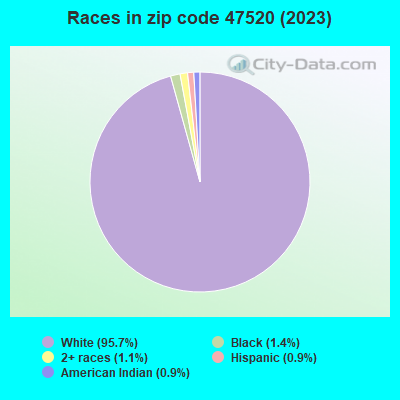
Zip code 47520 compared to state average:
Black race population percentage significantly below state average.
Hispanic race population percentage significantly below state average.
Median age above state average.
Foreign-born population percentage significantly below state average.
Length of stay since moving in significantly above state average.
Number of college students below state average.
Percentage of population with a bachelor's degree or higher significantly below state average.
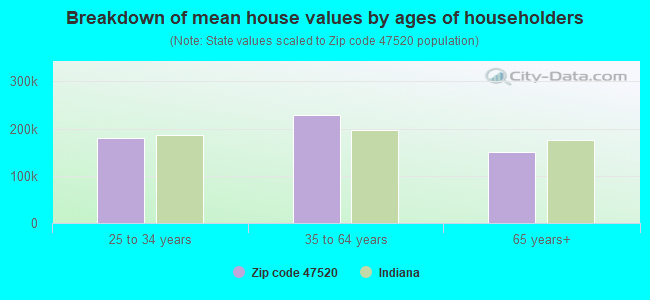
Estimated median house/condo value in 2022: $150,159
47520:
$150,159
Indiana:
$208,700
According to our research of Indiana and other state lists, there was 1 registered sex offender living in 47520 zip code as of June 05, 2024. The ratio of all residents to sex offenders in zip code 47520 is 3,075 to 1. The ratio of registered sex offenders to all residents in this zip code is much lower than the state average.
Median resident age:
This zip code:
43.7 years
Indiana median age:
38.2 years
Average household size:
This zip code:
2.2 people
Indiana:
2.4 people
Averages for the 2020 tax year for zip code 47520, filed in 2021:
Average Adjusted Gross Income (AGI) in 2020: $47,805 (Individual Income Tax Returns)
Here:
$47,805
State:
$64,978
Salary/wage: $42,927 (reported on 80.4% of returns)
Here:
$42,927
State:
$55,245
(% of AGI for various income ranges: 974.8% for AGIs below $25k, 3237.9% for AGIs $25k-50k, 5798.3% for AGIs $50k-75k, 9132.7% for AGIs $75k-100k, 14116.4% for AGIs $100k-200k)
Taxable interest for individuals: $564 (reported on 19.6% of returns)
This zip code:
$564
Indiana:
$1,351
(% of AGI for various income ranges: 15.5% for AGIs below $25k, 10.7% for AGIs $25k-50k, 11.1% for AGIs $50k-75k, 16.4% for AGIs $75k-100k, 20.0% for AGIs $100k-200k)
Ordinary dividends: $1,906 (reported on 11.2% of returns)
Here:
$1,906
State:
$5,827
(% of AGI for various income ranges: 17.0% for AGIs below $25k, 21.4% for AGIs $25k-50k, 15.0% for AGIs $50k-75k, 57.3% for AGIs $75k-100k, 72.7% for AGIs $100k-200k)
Net capital gain/loss in AGI: +$5,383 (reported on 8.4% of returns)
Here:
+$5,383
State:
+$17,730
(% of AGI for various income ranges: 7.0% for AGIs below $25k, 90.0% for AGIs $50k-75k, 68.2% for AGIs $75k-100k, 343.6% for AGIs $100k-200k)
Profit/loss from business: +$7,838 (reported on 11.2% of returns)
Here:
+$7,838
State:
+$12,144
(% of AGI for various income ranges: 70.0% for AGIs below $25k, 95.7% for AGIs $25k-50k, 61.1% for AGIs $50k-75k, 166.4% for AGIs $75k-100k, 350.0% for AGIs $100k-200k)
Taxable individual retirement arrangement distribution: $13,015 (reported on 9.1% of returns)
47520:
$13,015
Indiana:
$18,302
(% of AGI for various income ranges: 60.2% for AGIs below $25k, 123.6% for AGIs $25k-50k, 220.6% for AGIs $50k-75k, 621.8% for AGIs $75k-100k)
Earned income credit: $2,211 (reported on 18.9% of returns)
Here:
$2,211
State:
$2,298
(% of AGI for various income ranges: 88.0% for AGIs below $25k, 75.0% for AGIs $25k-50k)
Percentage of individuals using paid preparers for their 2020 taxes: 95.1%
Here:
95%
State:
94%
(% for various income ranges: 94.7% for AGIs below $25k, 94.1% for AGIs $25k-50k, 95.5% for AGIs $50k-75k, 93.3% for AGIs $75k-100k, 100.0% for AGIs $100k-200k)
Averages for the 2012 tax year for zip code 47520, filed in 2013:
Average Adjusted Gross Income (AGI) in 2012: $39,084 (Individual Income Tax Returns)
Here:
$39,084
State:
$52,932
Salary/wage: $37,031 (reported on 84.6% of returns)
Here:
$37,031
State:
$45,173
(% of AGI for various income ranges: 70.2% for AGIs below $25k, 85.5% for AGIs $25k-50k, 84.0% for AGIs $50k-75k, 82.3% for AGIs $75k-100k, 74.0% for AGIs $100k-200k)
Taxable interest for individuals: $943 (reported on 21.0% of returns)
This zip code:
$943
Indiana:
$1,311
(% of AGI for various income ranges: 1.6% for AGIs below $25k, 0.5% for AGIs $25k-50k, 0.4% for AGIs $50k-75k, 0.3% for AGIs $75k-100k, 0.2% for AGIs $100k-200k)
Ordinary dividends: $1,422 (reported on 12.6% of returns)
Here:
$1,422
State:
$4,690
(% of AGI for various income ranges: 0.8% for AGIs below $25k, 0.2% for AGIs $25k-50k, 0.5% for AGIs $50k-75k, 0.5% for AGIs $75k-100k, 0.4% for AGIs $100k-200k)
Net capital gain/loss in AGI: +$2,045 (reported on 7.7% of returns)
Here:
+$2,045
State:
+$10,406
(% of AGI for various income ranges: 0.9% for AGIs below $25k, 0.7% for AGIs $50k-75k, 0.6% for AGIs $75k-100k)
Profit/loss from business: +$4,112 (reported on 11.2% of returns)
Here:
+$4,112
State:
+$11,105
(% of AGI for various income ranges: 5.3% for AGIs below $25k, 1.2% for AGIs $25k-50k, 0.8% for AGIs $50k-75k, 0.1% for AGIs $75k-100k)
Taxable individual retirement arrangement distribution: $9,650 (reported on 7.0% of returns)
47520:
$9,650
Indiana:
$13,841
(% of AGI for various income ranges: 6.0% for AGIs below $25k, 1.3% for AGIs $50k-75k, 3.2% for AGIs $75k-100k)
Total itemized deductions: $16,065 (20% of AGI, reported on 11.9% of returns)
Here:
$16,065
State:
$20,913
Here:
19.6% of AGI
State:
18.2% of AGI
(% of AGI for various income ranges: 5.0% for AGIs $25k-50k, 5.0% for AGIs $50k-75k, 4.3% for AGIs $75k-100k, 8.3% for AGIs $100k-200k)
Charity contributions: $2,025 (reported on 5.6% of returns)
Here:
$2,025
State:
$4,697
Taxes paid: $5,500 (reported on 11.9% of returns)
47520:
$5,500
State:
$7,456
(% of AGI for various income ranges: 0.8% for AGIs $25k-50k, 1.4% for AGIs $50k-75k, 1.6% for AGIs $75k-100k, 4.1% for AGIs $100k-200k)
Earned income credit: $2,171 (reported on 21.7% of returns)
Here:
$2,171
State:
$2,265
(% of AGI for various income ranges: 7.3% for AGIs below $25k, 1.2% for AGIs $25k-50k)
Percentage of individuals using paid preparers for their 2012 taxes: 64.3%
Here:
64%
State:
53%
(% for various income ranges: 61.5% for AGIs below $25k, 61.8% for AGIs $25k-50k, 70.8% for AGIs $50k-75k, 66.7% for AGIs $75k-100k, 75.0% for AGIs $100k-200k)
Averages for the 2004 tax year for zip code 47520, filed in 2005:
Average Adjusted Gross Income (AGI) in 2004: $33,080 (Individual Income Tax Returns)
Here:
$33,080
State:
$44,790
Salary/wage: $31,947 (reported on 86.8% of returns)
Here:
$31,947
State:
$39,615
(% of AGI for various income ranges: 91.8% for AGIs below $10k, 73.3% for AGIs $10k-25k, 88.1% for AGIs $25k-50k, 90.4% for AGIs $50k-75k, 87.0% for AGIs $75k-100k, 58.3% for AGIs over 100k)
Taxable interest for individuals: $1,360 (reported on 32.9% of returns)
This zip code:
$1,360
Indiana:
$1,535
(% of AGI for various income ranges: 4.3% for AGIs below $10k, 3.6% for AGIs $10k-25k, 1.4% for AGIs $25k-50k, 0.6% for AGIs $50k-75k, 0.3% for AGIs $75k-100k, 1.1% for AGIs over 100k)
Taxable dividends: $967 (reported on 14.7% of returns)
Here:
$967
State:
$2,998
(% of AGI for various income ranges: 0.6% for AGIs below $10k, 0.6% for AGIs $10k-25k, 0.5% for AGIs $25k-50k, 0.2% for AGIs $50k-75k, 0.2% for AGIs $75k-100k, 0.9% for AGIs over 100k)
Net capital gain/loss: +$2,936 (reported on 9.9% of returns)
Here:
+$2,936
State:
+$8,619
(% of AGI for various income ranges: 1.6% for AGIs below $10k, 0.1% for AGIs $10k-25k, 0.1% for AGIs $25k-50k, 0.2% for AGIs $50k-75k, 1.5% for AGIs $75k-100k, 4.8% for AGIs over 100k)
Profit/loss from business: +$4,438 (reported on 10.8% of returns)
Here:
+$4,438
State:
+$10,071
(% of AGI for various income ranges: 3.6% for AGIs below $10k, 4.9% for AGIs $10k-25k, 1.1% for AGIs $25k-50k, 0.0% for AGIs $50k-75k, 0.1% for AGIs $75k-100k, 3.7% for AGIs over 100k)
IRA payment deduction: $2,300 (reported on 1.4% of returns)
47520:
$2,300
Indiana:
$2,840
Total itemized deductions: $13,683 (21% of AGI, reported on 14.7% of returns)
Here:
$13,683
State:
$17,065
Here:
21.2% of AGI
State:
19.5% of AGI
(% of AGI for various income ranges: 3.2% for AGIs $10k-25k, 5.7% for AGIs $25k-50k, 6.4% for AGIs $50k-75k, 9.0% for AGIs $75k-100k, 7.2% for AGIs over 100k)
Charity contributions deductions: $1,779 (3% of AGI, reported on 9.9% of returns)
Here:
$1,779
State:
$3,550
Here:
2.6% of AGI
State:
3.8% of AGI
(% of AGI for various income ranges: 0.3% for AGIs below $10k, 0.5% for AGIs $25k-50k, 0.4% for AGIs $50k-75k, 0.8% for AGIs $75k-100k, 1.3% for AGIs over 100k)
Total tax: $3,999 (reported on 70.4% of returns)
47520:
$3,999
State:
$6,914
(% of AGI for various income ranges: 2.2% for AGIs below $10k, 4.2% for AGIs $10k-25k, 7.0% for AGIs $25k-50k, 8.5% for AGIs $50k-75k, 9.8% for AGIs $75k-100k, 17.8% for AGIs over 100k)
Earned income credit: $1,621 (reported on 17.8% of returns)
Here:
$1,621
State:
$1,685
Percentage of individuals using paid preparers for their 2004 taxes: 68.8%
Here:
69%
State:
59%
(% for various income ranges: 63.1% for AGIs below $10k, 70.6% for AGIs $10k-25k, 69.1% for AGIs $25k-50k, 70.5% for AGIs $50k-75k, 72.9% for AGIs $75k-100k, 81.8% for AGIs over 100k)
Household received Food Stamps/SNAP in the past 12 months: 210 Household did not receive Food Stamps/SNAP in the past 12 months: 1,111
Women who had a birth in the past 12 months: 8 (4 now married, 3 unmarried) Women who did not have a birth in the past 12 months: 637 (315 now married, 322 unmarried)
Housing units in zip code 47520 with a mortgage: 580 (55 second mortgage, 4 home equity loan, 53 both second mortgage and home equity loan) Houses without a mortgage: 3
Median monthly owner costs for units with a mortgage: $1,087 Median monthly owner costs for units without a mortgage: $346
Residents with income below the poverty level in 2022:
This zip code:
16.4%
Whole state:
12.6%
Residents with income below 50% of the poverty level in 2022:
This zip code:
9.6%
Whole state:
6.3%
Median number of rooms in houses and condos:
Here:
6.1
State:
6.6
Median number of rooms in apartments:
Here:
4.0
State:
4.3
Notable locations in this zip code not listed on our city pages
Notable locations in zip code 47520: German Ridge Recreation Area (A), Rome Volunteer Fire Department (B), Cannelton Volunteer Fire Department (C). Display/hide their locations on the map
Churches in zip code 47520 include: Gospel Tabernacle (A), Millstone Church (B), Harris Memorial Church (C), Mount Zion Church (D). Display/hide their locations on the map
Cemeteries: Schraner Cemetery (1), Saint Peters Cemetery (2), Saint Michaels Cemetery (3), Log Church Cemetery (4), Maier Cemetery (5), Saint Johns Cemetery (6), German Ridge Cemetery (7). Display/hide their locations on the map
Streams, rivers, and creeks: Sample Run (A), Sandy Branch (B), Pond Run (C), Kingley Creek (D), Deer Creek (E), Adams Run (F), Miller Branch (G), Millstone Creek (H), Murmer Creek (I). Display/hide their locations on the map
In group quarters: 37 (-1 institutionalized population)
Size of family households: 446 2-persons, 139 3-persons, 118 4-persons, 45 5-persons, 20 6-persons, 5 7-or-more-persons
Size of nonfamily households: 462 1-person, 78 2-persons, 3 3-persons
505 married couples with children.
92 single-parent households (13 men, 79 women).
98.6% of residents of 47520 zip code speak English at home.
0.4% of residents speak Spanish at home (100% very well).
0.3% of residents speak other Indo-European language at home (100% very well).
Foreign born population: 6 (0.2%) (0.0% of them are naturalized citizens)
:
0.2%
Whole state:
6.1%
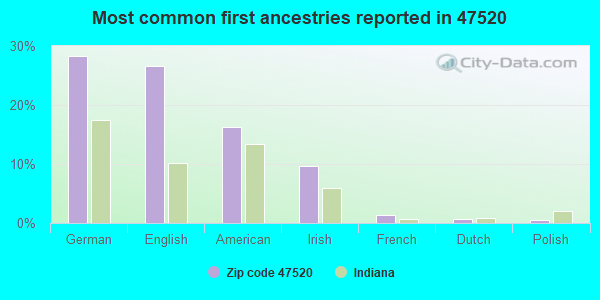
32%English
26%German
19%American
12%Irish
1%French
1%Scottish
0%Dutch
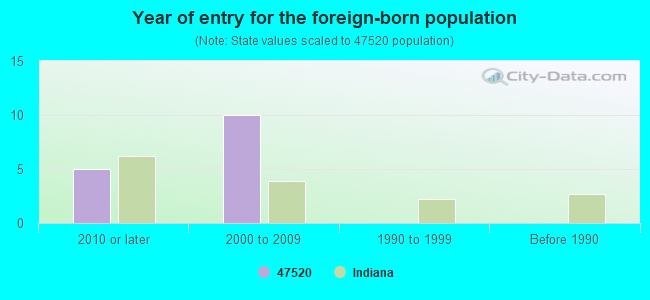
Year of entry for the foreign-born population
52010 or later
102000 to 2009
01990 to 1999
0Before 1990
Facilities with environmental interests located in this zip code:
COUNTY LINE DIV OF BEST CHAIRS INC (SR 66 in CANNELTON, IN)
AIR MAJOR (AIRS/AFS) STATE MASTER (Indiana facility tracking) - ACES-OP-12300013, AIR PROGRAM CRITERIA AND HAZARDOUS AIR POLLUTANT INVENTORY (Inventory of air pollution sources) Conditionally Exempt Small Quantity Generators, less than 100 kg/month of hazardous waste (Resource Conservation and Recovery Act (tracking hazardous waste)) TRI REPORTER (Tracking of toxic chemicals releasing facilities) Business SIC classification: WOOD HOUSEHOLD FURNITURE, EXCEPT UPHOLSTERED; WOOD HOUSEHOLD FURNITURE, UPHOLSTERED Business NAICS classification: UPHOLSTERED HOUSEHOLD FURNITURE MANUFACTURING. Organizations: BEST CHAIRS INC COUNTYLINE DIV (CONTACT/OPERATOR)
Alternative names: BEST CHAIRS INCorporated, BEST CHAIRS INC. COUNTY LINE DIV., BEST CHAIRS INC COUNTYLINE DIV, COUNTY LINE DIVISION, FISCHER CHAIR CO.
SCHWAB CORPORATION (4630 E SR 66 in CANNELTON, IN)
AIR MAJOR (AIRS/AFS) STATE MASTER (Indiana facility tracking) - CRTK-7259, EPCRA CRITERIA AND HAZARDOUS AIR POLLUTANT INVENTORY (Inventory of air pollution sources) Small Quantity Generators, between 100 kg and 1000 kg of hazardous waste/month (Resource Conservation and Recovery Act (tracking hazardous waste)) - notification TRI REPORTER (Tracking of toxic chemicals releasing facilities) Business SIC classification: FABRICATED METAL PRODUCTS Business NAICS classification: ALL OTHER MISCELLANEOUS FABRICATED METAL PRODUCT MANUFACTURING. Alternative names: SCHWAB CORP.
CAN CLAY CORPORATION (401 WASHINGTON ST in CANNELTON, IN)
AIR MINOR (AIRS/AFS) STATE MASTER (Indiana facility tracking) - ACES-OP-12300001, AIR PROGRAM, UST-10265, UNDERGROUND STORAGE TANK PROGRAM Business SIC classification: STRUCTURAL CLAY PRODUCTS
CANNELTON ELEM & HIGH SCHOOL (3RD/TAYLOR STS in CANNELTON, IN)
(National Center for Education Statistics) - STATE ID-6733 Organizations: CANNELTON CITY SCHOOLS (SCHOOL DISTRICT)
CAN-CLAY CORPORATION (4TH & WASHINGTON STS in CANNELTON, IN)
STATE MASTER (Indiana facility tracking) CRITERIA AND HAZARDOUS AIR POLLUTANT INVENTORY (Inventory of air pollution sources) Business SIC classification: STRUCTURAL CLAY PRODUCTS Business NAICS classification: OTHER STRUCTURAL CLAY PRODUCT MANUFACTURING.
Housing units lacking complete plumbing facilities: 5.8% Housing units lacking complete kitchen facilities: 4.3%
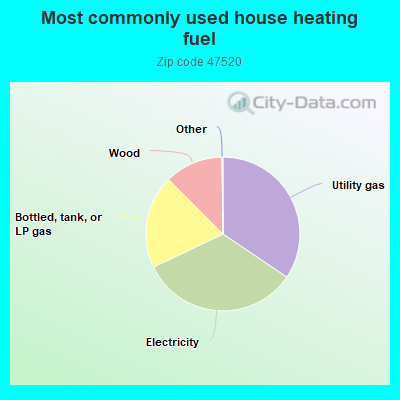
36.7%Utility gas
29.0%Electricity
22.5%Bottled, tank, or LP gas
11.7%Wood
Population in 1990: 2,290. Population change in the 1990s: +678 (+29.6%).
Place of birth for U.S.-born residents:
This state: 2,234
Northeast: 14
Midwest: 158
South: 406
West: 75
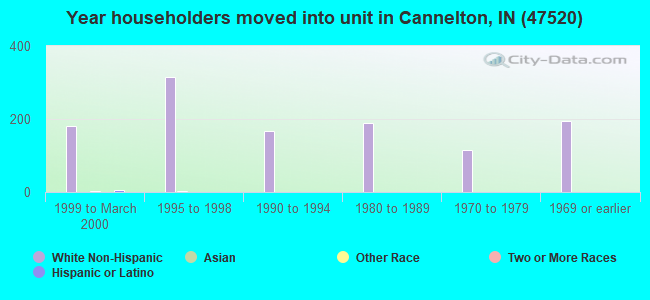
64% of the 47520 zip code residents lived in the same house 5 years ago. Out of people who lived in different houses, 66% lived in this county. Out of people who lived in different counties, 50% lived in Indiana.
93% of the 47520 zip code residents lived in the same house 1 year ago. Out of people who lived in different houses, 46% moved from this county. Out of people who lived in different houses, 25% moved from different county within same state. Out of people who lived in different houses, 33% moved from different state.
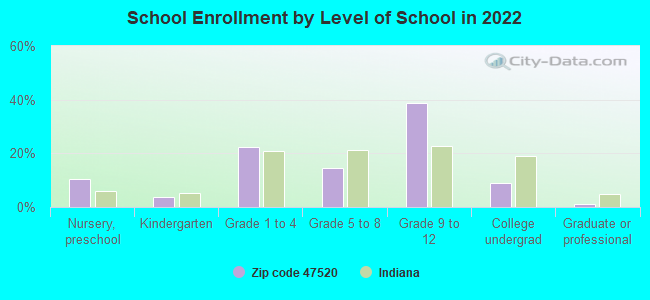
Private vs. public school enrollment:
Students in private schools in grades 1 to 8 (elementary and middle school): 8
Here:
3.4%
Indiana:
14.9%
Students in private schools in grades 9 to 12 (high school): 19
Here:
7.8%
Indiana:
11.4%
Students in private undergraduate colleges: 27
Here:
48.3%
Indiana:
22.3%
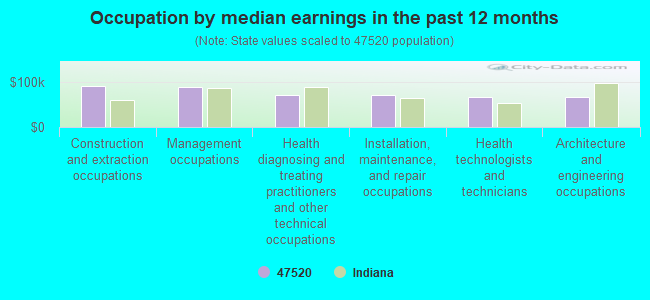
Occupation by median earnings in the past 12 months ($)
87,819Construction and extraction occupations
87,482Management occupations
76,584Health diagnosing and treating practitioners and other technical occupations
59,201Installation, maintenance, and repair occupations
54,162Transportation occupations
52,696Community and social service occupations
Companies with federal contracts located in this zip code:
LANDERS EXPLOSIVES, INC (16785 N STATE RD 66 in MAGNET, IN; small business) : $5,000 in 2 contractsfrom 2003 to 2004
$2,622 with Navy for Demolition Materials. Signed on 2004-03-23. Completion date: 2004-04-16.
$2,378 with Navy for Demolition Materials. Taking place in IL. Signed on 2003-05-09. Completion date: 2003-06-09.
Top industries in this zip code by the number of employees in 2005:
Construction: Site Preparation Contractors (10-19: 1)
Accommodation and Food Services: Limited-Service Restaurants (5-9: 1, 1-4: 1)
Utilities: Electric Power Distribution (5-9: 1)
People in group quarters in 2010:
29 people in local jails and other municipal confinement facilities
People in group quarters in 2000:
36 people in local jails and other confinement facilities (including police lockups)
Fatal accident statistics in 2014:
Fatal accident count: 1
Vehicles involved in fatal accidents: 1
Fatal accidents caused by drunken drivers: 0
Fatalities: 2
Persons involved in fatal accidents: 4
Pedestrians involved in fatal accidents: 0
Fatal accident statistics in 2013:
Fatal accident count: 2
Vehicles involved in fatal accidents: 2
Fatal accidents caused by drunken drivers: 0
Fatalities: 2
Persons involved in fatal accidents: 3
Pedestrians involved in fatal accidents: 1
2003 - 2018 National Fire Incident Reporting System (NFIRS) incidents
Based on the data from the years 2003 - 2018 the average number of fire incidents per year is 13. The highest number of reported fires - 38 took place in 2007, and the least - 0 in 2014. The data has a rising trend.
When looking into fire subcategories, the most incidents belonged to: Structure Fires (38.1%), and Outside Fires (32.1%).
Fire incident types reported to NFIRS in Zip Code 47520


 Nearest zip codes: 47586, 47574, 47525, 42348, 40170, 47588.


 Based on the data from the years 2003 - 2018 the average number of fire incidents per year is 13. The highest number of reported fires - 38 took place in 2007, and the least - 0 in 2014. The data has a rising trend.
 When looking into fire subcategories, the most incidents belonged to: Structure Fires (38.1%), and Outside Fires (32.1%).