Estimated zip code population in 2022: 4,350 Zip code population in 2010: 4,134 Zip code population in 2000: 4,336
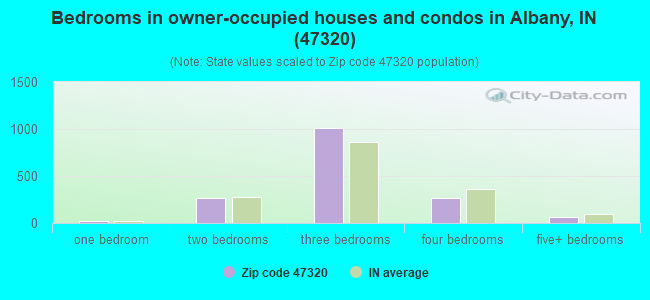
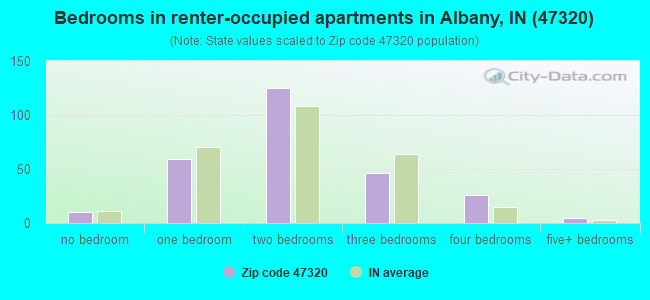
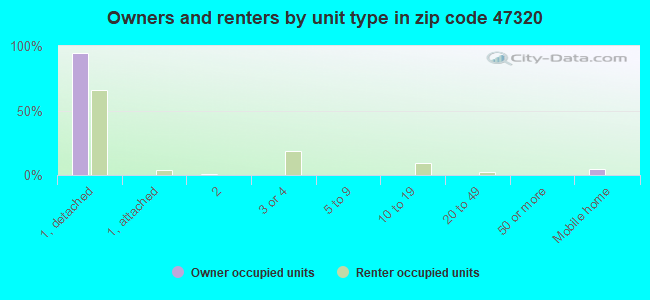
Houses and condos: 2,061 Renter-occupied apartments: 270
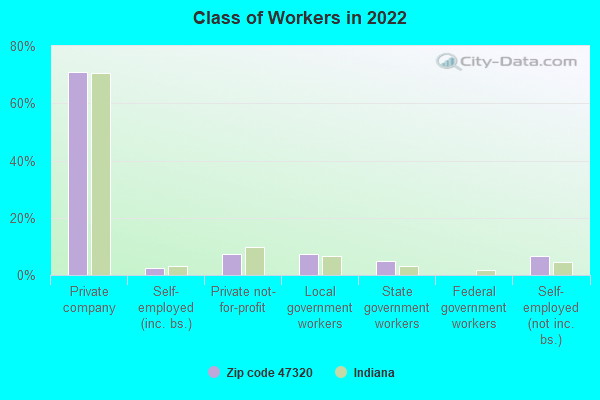
% of renters here:
14%
State:
29%
March 2022 cost of living index in zip code 47320: 84.5 (less than average, U.S. average is 100)
Land area: 33.5 sq. mi. Water area: 0.3 sq. mi.
Population density: 130 people per square mile
(very low).
OSM Map
General Map
Google Map
MSN Map
OSM Map
General Map
Google Map
MSN Map
OSM Map
General Map
Google Map
MSN Map
OSM Map
General Map
Google Map
MSN Map
Please wait while loading the map...
Real estate property taxes paid for housing units in 2022:
This zip code:
0.7% ($908)
Indiana:
0.7% ($1,467)
Median real estate property taxes paid for housing units with mortgages in 2022: $882 (0.7%) Median real estate property taxes paid for housing units with no mortgage in 2022: $1,052 (0.8%)
Estimated median house/condo value in 2022: $126,743
47320:
$126,743
Indiana:
$208,700
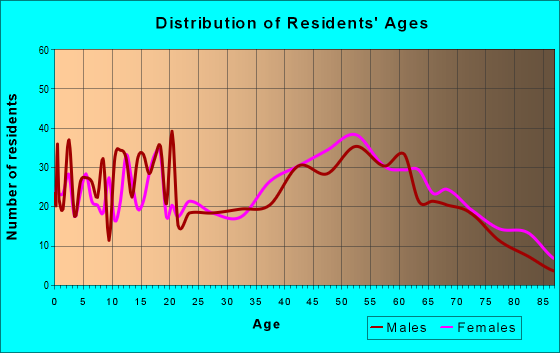
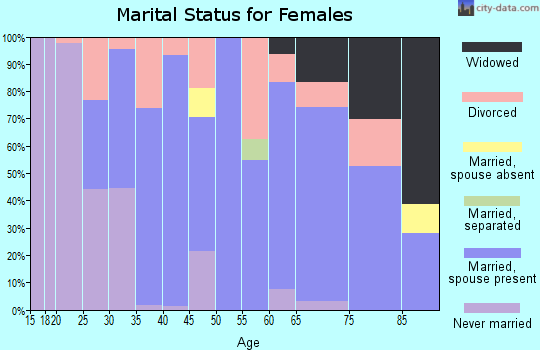
Median resident age:
This zip code:
49.4 years
Indiana median age:
38.2 years
Average household size:
This zip code:
2.3 people
Indiana:
2.4 people
Averages for the 2020 tax year for zip code 47320, filed in 2021:
Average Adjusted Gross Income (AGI) in 2020: $57,191 (Individual Income Tax Returns)
Here:
$57,191
State:
$64,978
Salary/wage: $48,556 (reported on 79.8% of returns)
Here:
$48,556
State:
$55,245
(% of AGI for various income ranges: 973.0% for AGIs below $25k, 3364.0% for AGIs $25k-50k, 5944.3% for AGIs $50k-75k, 8796.4% for AGIs $75k-100k, 15572.0% for AGIs $100k-200k)
Taxable interest for individuals: $1,390 (reported on 24.2% of returns)
This zip code:
$1,390
Indiana:
$1,351
(% of AGI for various income ranges: 10.2% for AGIs below $25k, 19.1% for AGIs $25k-50k, 28.3% for AGIs $50k-75k, 39.3% for AGIs $75k-100k, 138.0% for AGIs $100k-200k)
Ordinary dividends: $2,645 (reported on 14.6% of returns)
Here:
$2,645
State:
$5,827
(% of AGI for various income ranges: 14.0% for AGIs below $25k, 21.9% for AGIs $25k-50k, 45.7% for AGIs $50k-75k, 64.3% for AGIs $75k-100k, 174.0% for AGIs $100k-200k)
Net capital gain/loss in AGI: +$17,060 (reported on 12.6% of returns)
Here:
+$17,060
State:
+$17,730
(% of AGI for various income ranges: 27.7% for AGIs $25k-50k, 65.2% for AGIs $50k-75k, 135.0% for AGIs $75k-100k, 352.7% for AGIs $100k-200k)
Profit/loss from business: +$8,473 (reported on 11.1% of returns)
Here:
+$8,473
State:
+$12,144
(% of AGI for various income ranges: 45.5% for AGIs below $25k, 82.8% for AGIs $25k-50k, 140.9% for AGIs $50k-75k, 105.0% for AGIs $75k-100k, 530.7% for AGIs $100k-200k)
Taxable individual retirement arrangement distribution: $14,675 (reported on 12.1% of returns)
47320:
$14,675
Indiana:
$18,302
(% of AGI for various income ranges: 73.0% for AGIs below $25k, 97.2% for AGIs $25k-50k, 392.2% for AGIs $50k-75k, 483.6% for AGIs $75k-100k, 758.7% for AGIs $100k-200k)
Total itemized deductions: $33,940 (reported on 2.5% of returns)
Here:
$33,940
State:
$35,601
(% of AGI for various income ranges: 1131.3% for AGIs $100k-200k)
Charity contributions: $16,250 (reported on 2.0% of returns)
Here:
$16,250
State:
$15,596
(% of AGI for various income ranges: 433.3% for AGIs $100k-200k)
Taxes paid: $8,140 (reported on 2.5% of returns)
47320:
$8,140
State:
$7,542
(% of AGI for various income ranges: 271.3% for AGIs $100k-200k)
Earned income credit: $2,403 (reported on 15.2% of returns)
Here:
$2,403
State:
$2,298
(% of AGI for various income ranges: 75.1% for AGIs below $25k, 75.1% for AGIs $25k-50k)
Percentage of individuals using paid preparers for their 2020 taxes: 94.9%
Here:
95%
State:
94%
(% for various income ranges: 92.6% for AGIs below $25k, 96.1% for AGIs $25k-50k, 96.8% for AGIs $50k-75k, 100.0% for AGIs $75k-100k, 95.8% for AGIs $100k-200k, 80.0% for AGIs over 200k)
Averages for the 2012 tax year for zip code 47320, filed in 2013:
Average Adjusted Gross Income (AGI) in 2012: $43,887 (Individual Income Tax Returns)
Here:
$43,887
State:
$52,932
Salary/wage: $39,399 (reported on 82.9% of returns)
Here:
$39,399
State:
$45,173
(% of AGI for various income ranges: 66.9% for AGIs below $25k, 77.3% for AGIs $25k-50k, 77.1% for AGIs $50k-75k, 82.4% for AGIs $75k-100k, 88.6% for AGIs $100k-200k)
Taxable interest for individuals: $1,393 (reported on 27.6% of returns)
This zip code:
$1,393
Indiana:
$1,311
(% of AGI for various income ranges: 1.4% for AGIs below $25k, 1.0% for AGIs $25k-50k, 0.3% for AGIs $50k-75k, 0.7% for AGIs $75k-100k, 1.5% for AGIs $100k-200k)
Ordinary dividends: $1,760 (reported on 15.1% of returns)
Here:
$1,760
State:
$4,690
(% of AGI for various income ranges: 0.8% for AGIs below $25k, 0.7% for AGIs $25k-50k, 0.4% for AGIs $50k-75k, 0.4% for AGIs $75k-100k, 1.0% for AGIs $100k-200k)
Net capital gain/loss in AGI: +$5,730 (reported on 10.1% of returns)
Here:
+$5,730
State:
+$10,406
(% of AGI for various income ranges: 0.5% for AGIs $25k-50k, 5.7% for AGIs $100k-200k)
Profit/loss from business: +$8,570 (reported on 11.6% of returns)
Here:
+$8,570
State:
+$11,105
(% of AGI for various income ranges: 4.3% for AGIs below $25k, 1.6% for AGIs $25k-50k, 2.4% for AGIs $50k-75k, 3.2% for AGIs $75k-100k, 1.6% for AGIs $100k-200k)
Taxable individual retirement arrangement distribution: $10,112 (reported on 12.6% of returns)
47320:
$10,112
Indiana:
$13,841
(% of AGI for various income ranges: 3.8% for AGIs below $25k, 3.1% for AGIs $25k-50k, 3.3% for AGIs $50k-75k, 2.9% for AGIs $75k-100k, 2.7% for AGIs $100k-200k)
Total itemized deductions: $18,100 (21% of AGI, reported on 19.6% of returns)
Here:
$18,100
State:
$20,913
Here:
21.1% of AGI
State:
18.2% of AGI
(% of AGI for various income ranges: 4.8% for AGIs below $25k, 5.6% for AGIs $25k-50k, 5.8% for AGIs $50k-75k, 8.7% for AGIs $75k-100k, 16.5% for AGIs $100k-200k)
Charity contributions: $3,631 (reported on 14.6% of returns)
Here:
$3,631
State:
$4,697
(% of AGI for various income ranges: 0.6% for AGIs below $25k, 0.7% for AGIs $25k-50k, 1.1% for AGIs $50k-75k, 1.2% for AGIs $75k-100k, 2.5% for AGIs $100k-200k)
Taxes paid: $5,267 (reported on 19.6% of returns)
47320:
$5,267
State:
$7,456
(% of AGI for various income ranges: 0.6% for AGIs below $25k, 1.2% for AGIs $25k-50k, 1.6% for AGIs $50k-75k, 2.9% for AGIs $75k-100k, 5.4% for AGIs $100k-200k)
Earned income credit: $2,181 (reported on 16.1% of returns)
Here:
$2,181
State:
$2,265
(% of AGI for various income ranges: 5.1% for AGIs below $25k, 1.0% for AGIs $25k-50k)
Percentage of individuals using paid preparers for their 2012 taxes: 55.3%
Here:
55%
State:
53%
(% for various income ranges: 50.0% for AGIs below $25k, 54.2% for AGIs $25k-50k, 61.3% for AGIs $50k-75k, 63.2% for AGIs $75k-100k, 60.0% for AGIs $100k-200k, 100.0% for AGIs over 200k)
Averages for the 2004 tax year for zip code 47320, filed in 2005:
Average Adjusted Gross Income (AGI) in 2004: $42,327 (Individual Income Tax Returns)
Here:
$42,327
State:
$44,790
Salary/wage: $36,872 (reported on 85.4% of returns)
Here:
$36,872
State:
$39,615
(% of AGI for various income ranges: 94.4% for AGIs below $10k, 70.8% for AGIs $10k-25k, 79.4% for AGIs $25k-50k, 85.3% for AGIs $50k-75k, 86.3% for AGIs $75k-100k, 54.6% for AGIs over 100k)
Taxable interest for individuals: $1,395 (reported on 44.8% of returns)
This zip code:
$1,395
Indiana:
$1,535
(% of AGI for various income ranges: 6.0% for AGIs below $10k, 2.9% for AGIs $10k-25k, 1.5% for AGIs $25k-50k, 0.6% for AGIs $50k-75k, 0.8% for AGIs $75k-100k, 1.8% for AGIs over 100k)
Taxable dividends: $1,226 (reported on 21.2% of returns)
Here:
$1,226
State:
$2,998
(% of AGI for various income ranges: 2.1% for AGIs below $10k, 0.8% for AGIs $10k-25k, 0.5% for AGIs $25k-50k, 0.6% for AGIs $50k-75k, 0.2% for AGIs $75k-100k, 0.8% for AGIs over 100k)
Net capital gain/loss: +$4,874 (reported on 13.5% of returns)
Here:
+$4,874
State:
+$8,619
(% of AGI for various income ranges: -1.4% for AGIs below $10k, 0.2% for AGIs $10k-25k, 0.2% for AGIs $25k-50k, 0.9% for AGIs $50k-75k, 0.4% for AGIs $75k-100k, 4.5% for AGIs over 100k)
Profit/loss from business: +$10,460 (reported on 13.7% of returns)
Here:
+$10,460
State:
+$10,071
(% of AGI for various income ranges: 6.0% for AGIs below $10k, 4.1% for AGIs $10k-25k, 2.8% for AGIs $25k-50k, 4.4% for AGIs $50k-75k, 0.8% for AGIs $75k-100k, 3.8% for AGIs over 100k)
IRA payment deduction: $2,212 (reported on 2.7% of returns)
47320:
$2,212
Indiana:
$2,840
Total itemized deductions: $15,755 (19% of AGI, reported on 24.8% of returns)
Here:
$15,755
State:
$17,065
Here:
19.1% of AGI
State:
19.5% of AGI
(% of AGI for various income ranges: 10.8% for AGIs below $10k, 8.9% for AGIs $10k-25k, 7.6% for AGIs $25k-50k, 9.0% for AGIs $50k-75k, 10.9% for AGIs $75k-100k, 9.8% for AGIs over 100k)
Charity contributions deductions: $3,003 (3% of AGI, reported on 19.5% of returns)
Here:
$3,003
State:
$3,550
Here:
3.3% of AGI
State:
3.8% of AGI
(% of AGI for various income ranges: 0.9% for AGIs $10k-25k, 1.3% for AGIs $25k-50k, 1.1% for AGIs $50k-75k, 1.5% for AGIs $75k-100k, 1.9% for AGIs over 100k)
Total tax: $6,087 (reported on 74.7% of returns)
47320:
$6,087
State:
$6,914
(% of AGI for various income ranges: 2.5% for AGIs below $10k, 4.0% for AGIs $10k-25k, 6.2% for AGIs $25k-50k, 8.9% for AGIs $50k-75k, 10.8% for AGIs $75k-100k, 18.9% for AGIs over 100k)
Earned income credit: $1,596 (reported on 13.2% of returns)
Here:
$1,596
State:
$1,685
Percentage of individuals using paid preparers for their 2004 taxes: 59.8%
Here:
60%
State:
59%
(% for various income ranges: 48.5% for AGIs below $10k, 59.1% for AGIs $10k-25k, 59.4% for AGIs $25k-50k, 67.7% for AGIs $50k-75k, 64.1% for AGIs $75k-100k, 71.9% for AGIs over 100k)
Household received Food Stamps/SNAP in the past 12 months: 167 Household did not receive Food Stamps/SNAP in the past 12 months: 1,716
Women who had a birth in the past 12 months: 66 (36 now married, 27 unmarried) Women who did not have a birth in the past 12 months: 873 (444 now married, 429 unmarried)
Housing units in zip code 47320 with a mortgage: 978 (170 second mortgage, 153 both second mortgage and home equity loan) Houses without a mortgage: 8
Median monthly owner costs for units with a mortgage: $1,036 Median monthly owner costs for units without a mortgage: $411
Residents with income below the poverty level in 2022:
This zip code:
6.9%
Whole state:
12.6%
Residents with income below 50% of the poverty level in 2022:
This zip code:
2.0%
Whole state:
6.3%
Median number of rooms in houses and condos:
Here:
6.2
State:
6.6
Median number of rooms in apartments:
Here:
4.9
State:
4.3
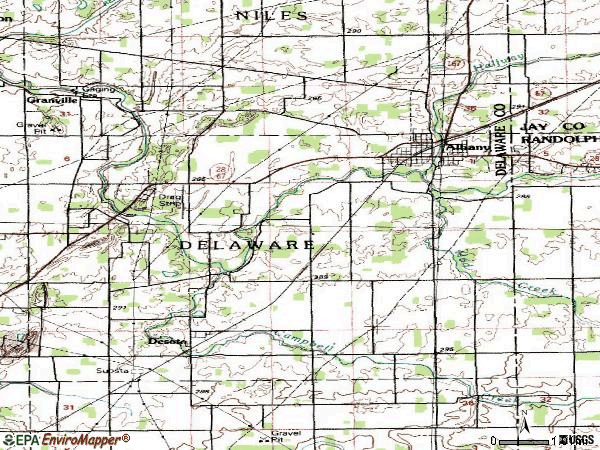
Notable locations in this zip code not listed on our city pages
Notable locations in zip code 47320: Albany - Delaware Township Volunteer Fire Department (A), Albany Fire Department (B). Display/hide their locations on the map
Cemeteries: Sparr Cemetery (1), Black Cemetery (2), Union Cemetery (3), Strong Cemetery (4), Godlove Cemetery (5), Orr Cemetery (6). Display/hide their locations on the map
In group quarters: 87 (-1 institutionalized population)
Size of family households: 896 2-persons, 275 3-persons, 203 4-persons, 41 5-persons, 30 6-persons, 5 7-or-more-persons
Size of nonfamily households: 355 1-person, 74 2-persons, 3 3-persons
483 married couples with children.
118 single-parent households (9 men, 109 women).
98.5% of residents of 47320 zip code speak English at home.
0.6% of residents speak Spanish at home (56% very well, 20% well, 24% not well).
0.5% of residents speak other Indo-European language at home (100% very well).
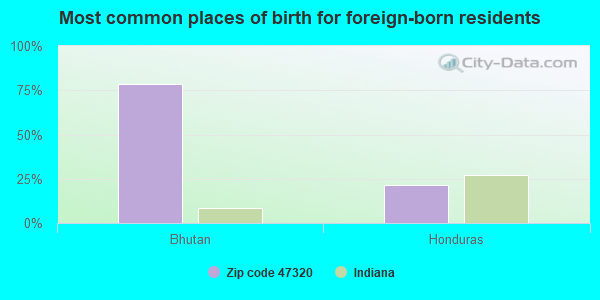
Foreign born population: 28 (0.6%) (24.0% of them are naturalized citizens)
This zip code:
0.6%
Whole state:
6.1%
79%Bhutan
21%Honduras
29%German
28%American
15%English
6%Irish
4%European
2%Swedish
1%Scottish
Year of entry for the foreign-born population
202010 or later
102000 to 2009
01990 to 1999
0Before 1990
Facilities with environmental interests located in this zip code:
ALBANY MUNICIPAL WWTP (555 S DOWDEN AVE in ALBANY, IN)
STATE MASTER (Indiana facility tracking) - CRTK-502, EPCRA, UST-1260, UNDERGROUND STORAGE TANK PROGRAM National Pollutant Discharge Elimination System NON-MAJOR (Tracking pollutant discharge elimination systems) - permit Business SIC classification: SEWERAGE SYSTEMS Organizations: DEWAYNE STEVENS JIM MARCUM (CONTACT/OPERATOR)
, ALBANY TOWN COUNCIL (CONTACT/OWNER)
Alternative names: ALBANY MUNICIPAL STP, ALBANY SEWAGE TREATMENT PLANT
PAWS INCORPORATED WASTE WATER TREATMENT PLANT (5440 EAST COUNTY ROUTE 450 NORTH in ALBANY, IN)
STATE MASTER (Indiana facility tracking) - IN-NPDES-IN0055271, National Pollutant Discharge Elimination System Permit National Pollutant Discharge Elimination System NON-MAJOR (Tracking pollutant discharge elimination systems) - permit Business SIC classification: EATING PLACES Organizations: HARRY VERNON 11335 090102 (CONTACT/OPERATOR)
Alternative names: PAWS, INC. WWTP
ALBANY ELEMENTARY SCHOOL (700 WEST STATE STREET in ALBANY, IN)
(Geographic Names Information System) (National Center for Education Statistics) - STATE ID-1520 Organizations: DELAWARE COMMUNITY SCHOOL CORP (SCHOOL DISTRICT)
LITTLER DIECAST CORPORATION (500 W. WALNUT ST. in ALBANY, IN)
STATE MASTER (Indiana facility tracking) - ACES-OP-03500050, AIR PROGRAM, CRTK-3063, EPCRA TRI REPORTER (Tracking of toxic chemicals releasing facilities) Business SIC classification: ALUMINUM DIE-CASTINGS Alternative names: LITTLER DIECAST CORP.
ALBANY PLATING WORKS INC (STATE AND MANOR ST in ALBANY, IN)
STATE MASTER (Indiana facility tracking) (Resource Conservation and Recovery Act (tracking hazardous waste))
BLACKBURNS AUTO BODY (993 W STATE ST in ALBANY, IN)
STATE MASTER (Indiana facility tracking) Conditionally Exempt Small Quantity Generators, less than 100 kg/month of hazardous waste (Resource Conservation and Recovery Act (tracking hazardous waste)) - notification Organizations: CHARLES STEPHEN BLACKBURN (CONTACT/OWNER)
ALBANY METAL TREATING INCORPORATED (400 SOUTH DOWDEN AVENUE in ALBANY, IN)
STATE MASTER (Indiana facility tracking) TRI REPORTER (Tracking of toxic chemicals releasing facilities) Business SIC classification: METAL HEAT TREATING Alternative names: ALBANY METAL TREATING INC.
Housing units lacking complete plumbing facilities: 5.8% Housing units lacking complete kitchen facilities: 1.9%
55.5%Utility gas
30.6%Electricity
9.9%Bottled, tank, or LP gas
2.7%Wood
1.1%Fuel oil, kerosene, etc.
Population in 1990: 4,625.
Place of birth for U.S.-born residents:
This state: 3,545
Northeast: 42
Midwest: 352
South: 234
West: 121
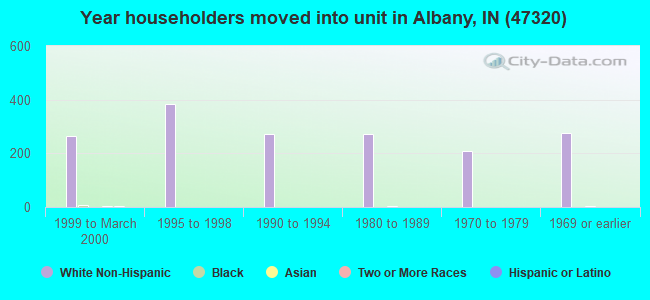
65% of the 47320 zip code residents lived in the same house 5 years ago. Out of people who lived in different houses, 59% lived in this county. Out of people who lived in different counties, 50% lived in Indiana.
91% of the 47320 zip code residents lived in the same house 1 year ago. Out of people who lived in different houses, 47% moved from this county. Out of people who lived in different houses, 27% moved from different county within same state. Out of people who lived in different houses, 26% moved from different state. Out of people who lived in different houses, 2% moved from abroad.
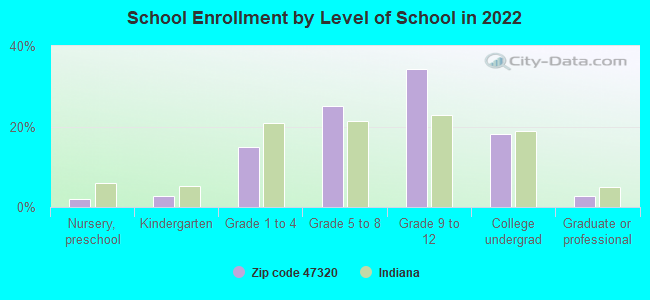
Private vs. public school enrollment:
Students in private schools in grades 1 to 8 (elementary and middle school): 24
Here:
7.8%
Indiana:
14.9%
Students in private schools in grades 9 to 12 (high school): 32
Here:
12.3%
Indiana:
11.4%
Students in private undergraduate colleges:
Here:
0.0%
Indiana:
22.3%
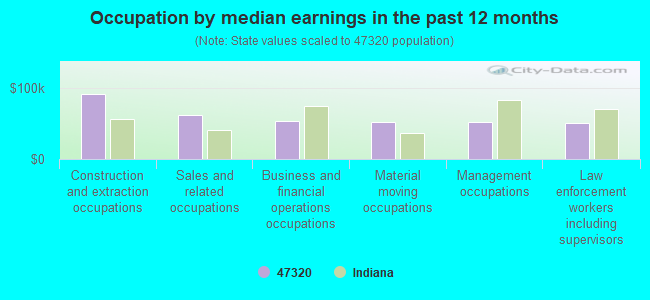
Occupation by median earnings in the past 12 months ($)
92,131Construction and extraction occupations
62,283Sales and related occupations
53,989Business and financial operations occupations
52,194Material moving occupations
51,841Management occupations
50,932Law enforcement workers including supervisors
Companies with federal contracts located in this zip code:
S D P MANUFACTURING INC (537 W WALNUT ST in ALBANY, IN; small business)
$75,062 with Air Force for Miscellaneous Vehicular Components. Signed on 2003-03-28. Completion date: 2003-09-17.
Top industries in this zip code by the number of employees in 2005:
Health Care and Social Assistance: Nursing Care Facilities (100-249 employees: 1 establishment)
Real Estate and Rental and Leasing: Lessors of Nonfinancial Intangible Assets (except Copyrighted Works) (50-99: 1)
Accommodation and Food Services: Full-Service Restaurants (10-19: 3, 5-9: 1)
Accommodation and Food Services: Limited-Service Restaurants (20-49: 1)
Accommodation and Food Services: Snack and Nonalcoholic Beverage Bars (20-49: 1)
Wholesale Trade: Women's, Children's, and Infants' Clothing and Accessories Merchant Wholesalers (20-49: 1)
People in group quarters in 2010:
82 people in nursing facilities/skilled-nursing facilities
People in group quarters in 2000:
76 people in nursing homes
Fatal accident statistics in 2013:
Fatal accident count: 1
Vehicles involved in fatal accidents: 3
Fatal accidents caused by drunken drivers: 0
Fatalities: 1
Persons involved in fatal accidents: 4
Pedestrians involved in fatal accidents: 0
Fatal accident statistics in 2011:
Fatal accident count: 1
Vehicles involved in fatal accidents: 1
Fatal accidents caused by drunken drivers: 1
Fatalities: 2
Persons involved in fatal accidents: 3
Pedestrians involved in fatal accidents: 0
Home Mortgage Disclosure Act Aggregated Statistics For Year 2009 (Based on 2 partial tracts)
A) FHA, FSA/RHS & VA Home Purchase Loans
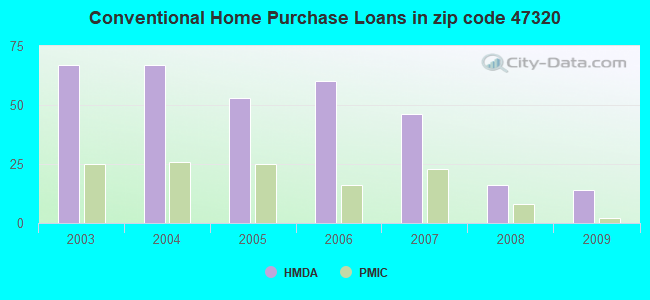
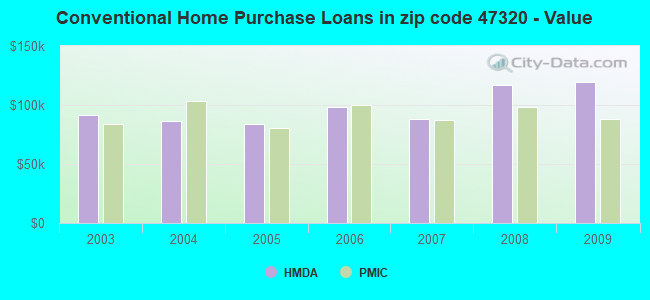
B) Conventional Home Purchase Loans
C) Refinancings
D) Home Improvement Loans
F) Non-occupant Loans on < 5 Family Dwellings (A B C & D)
G) Loans On Manufactured Home Dwelling (A B C & D)
Number
Average Value
Number
Average Value
Number
Average Value
Number
Average Value
Number
Average Value
Number
Average Value
LOANS ORIGINATED
22
$86,453
14
$119,128
107
$109,087
5
$87,952
4
$72,560
2
$100,045
APPLICATIONS APPROVED, NOT ACCEPTED
1
$75,860
3
$67,797
4
$101,420
0
$0
2
$97,295
0
$0
APPLICATIONS DENIED
2
$74,760
7
$83,397
29
$134,430
3
$17,957
3
$128,997
3
$77,323
APPLICATIONS WITHDRAWN
2
$121,485
1
$36,280
25
$121,990
1
$25,290
0
$0
0
$0
FILES CLOSED FOR INCOMPLETENESS
0
$0
0
$0
3
$115,437
1
$193,490
0
$0
0
$0
Aggregated Statistics For Year 2008 (Based on 2 partial tracts)
A) FHA, FSA/RHS & VA Home Purchase Loans
B) Conventional Home Purchase Loans
C) Refinancings
D) Home Improvement Loans
F) Non-occupant Loans on < 5 Family Dwellings (A B C & D)
G) Loans On Manufactured Home Dwelling (A B C & D)
Number
Average Value
Number
Average Value
Number
Average Value
Number
Average Value
Number
Average Value
Number
Average Value
LOANS ORIGINATED
16
$96,679
16
$116,880
59
$105,114
14
$30,548
5
$104,004
1
$67,060
APPLICATIONS APPROVED, NOT ACCEPTED
1
$96,750
1
$65,960
10
$129,729
3
$23,453
0
$0
2
$112,690
APPLICATIONS DENIED
4
$66,788
3
$119,100
44
$109,290
8
$80,944
0
$0
0
$0
APPLICATIONS WITHDRAWN
3
$81,357
1
$142,920
15
$130,389
1
$196,790
0
$0
1
$94,550
FILES CLOSED FOR INCOMPLETENESS
0
$0
0
$0
4
$125,608
0
$0
0
$0
0
$0
Aggregated Statistics For Year 2007 (Based on 2 partial tracts)
A) FHA, FSA/RHS & VA Home Purchase Loans
B) Conventional Home Purchase Loans
C) Refinancings
D) Home Improvement Loans
F) Non-occupant Loans on < 5 Family Dwellings (A B C & D)
G) Loans On Manufactured Home Dwelling (A B C & D)
Number
Average Value
Number
Average Value
Number
Average Value
Number
Average Value
Number
Average Value
Number
Average Value
LOANS ORIGINATED
9
$69,507
46
$88,119
73
$79,774
10
$37,599
7
$59,839
2
$60,465
APPLICATIONS APPROVED, NOT ACCEPTED
1
$128,630
5
$79,596
10
$87,182
1
$54,970
0
$0
1
$131,930
APPLICATIONS DENIED
3
$74,027
12
$105,176
52
$100,489
11
$31,383
8
$65,414
0
$0
APPLICATIONS WITHDRAWN
0
$0
9
$108,719
31
$86,108
0
$0
0
$0
1
$180,300
FILES CLOSED FOR INCOMPLETENESS
0
$0
1
$236,370
3
$111,407
2
$31,885
0
$0
0
$0
Aggregated Statistics For Year 2006 (Based on 2 partial tracts)
A) FHA, FSA/RHS & VA Home Purchase Loans
B) Conventional Home Purchase Loans
C) Refinancings
D) Home Improvement Loans
E) Loans on Dwellings For 5+ Families
F) Non-occupant Loans on < 5 Family Dwellings (A B C & D)
G) Loans On Manufactured Home Dwelling (A B C & D)
Number
Average Value
Number
Average Value
Number
Average Value
Number
Average Value
Number
Average Value
Number
Average Value
Number
Average Value
LOANS ORIGINATED
5
$98,946
60
$98,286
79
$88,230
19
$35,586
1
$54,970
9
$41,533
5
$109,720
APPLICATIONS APPROVED, NOT ACCEPTED
1
$102,240
10
$94,768
24
$102,519
1
$45,080
0
$0
4
$75,858
0
$0
APPLICATIONS DENIED
2
$79,155
23
$95,983
71
$100,169
15
$44,709
0
$0
3
$43,977
4
$43,975
APPLICATIONS WITHDRAWN
0
$0
5
$108,180
58
$97,259
3
$57,170
0
$0
2
$58,820
1
$84,650
FILES CLOSED FOR INCOMPLETENESS
0
$0
3
$94,913
11
$98,746
0
$0
0
$0
2
$111,040
0
$0
Aggregated Statistics For Year 2005 (Based on 2 partial tracts)
A) FHA, FSA/RHS & VA Home Purchase Loans
B) Conventional Home Purchase Loans
C) Refinancings
D) Home Improvement Loans
F) Non-occupant Loans on < 5 Family Dwellings (A B C & D)
G) Loans On Manufactured Home Dwelling (A B C & D)
Number
Average Value
Number
Average Value
Number
Average Value
Number
Average Value
Number
Average Value
Number
Average Value
LOANS ORIGINATED
7
$81,041
53
$84,239
114
$98,570
12
$38,754
14
$70,911
3
$84,653
APPLICATIONS APPROVED, NOT ACCEPTED
1
$95,650
7
$71,933
26
$118,777
1
$4,400
0
$0
1
$43,980
APPLICATIONS DENIED
2
$69,810
7
$47,117
95
$92,604
20
$44,086
3
$67,430
4
$86,302
APPLICATIONS WITHDRAWN
0
$0
9
$85,998
42
$91,250
15
$161,612
2
$69,810
2
$96,745
FILES CLOSED FOR INCOMPLETENESS
1
$56,070
5
$76,958
18
$114,154
0
$0
0
$0
0
$0
Aggregated Statistics For Year 2004 (Based on 2 partial tracts)
A) FHA, FSA/RHS & VA Home Purchase Loans
B) Conventional Home Purchase Loans
C) Refinancings
D) Home Improvement Loans
F) Non-occupant Loans on < 5 Family Dwellings (A B C & D)
G) Loans On Manufactured Home Dwelling (A B C & D)
Number
Average Value
Number
Average Value
Number
Average Value
Number
Average Value
Number
Average Value
Number
Average Value
LOANS ORIGINATED
7
$80,727
67
$86,114
142
$87,441
24
$32,203
8
$45,212
8
$75,721
APPLICATIONS APPROVED, NOT ACCEPTED
1
$78,060
12
$52,038
25
$78,145
3
$34,080
2
$48,925
3
$63,767
APPLICATIONS DENIED
2
$80,255
14
$69,655
81
$74,040
10
$11,983
2
$75,860
1
$73,660
APPLICATIONS WITHDRAWN
1
$73,660
7
$79,157
45
$91,568
2
$20,890
1
$114,340
1
$43,980
FILES CLOSED FOR INCOMPLETENESS
0
$0
0
$0
21
$112,243
0
$0
0
$0
0
$0
Aggregated Statistics For Year 2003 (Based on 2 partial tracts)
A) FHA, FSA/RHS & VA Home Purchase Loans
B) Conventional Home Purchase Loans
C) Refinancings
D) Home Improvement Loans
F) Non-occupant Loans on < 5 Family Dwellings (A B C & D)
Detailed PMIC statistics for the following Tracts:0027.00
2004 - 2018 National Fire Incident Reporting System (NFIRS) incidents
According to the data from the years 2004 - 2018 the average number of fire incidents per year is 21. The highest number of fire incidents - 35 took place in 2012, and the least - 5 in 2015. The data has a dropping trend.
When looking into fire subcategories, the most incidents belonged to: Outside Fires (47.9%), and Structure Fires (42.1%).
Fire incident types reported to NFIRS in Zip Code 47320
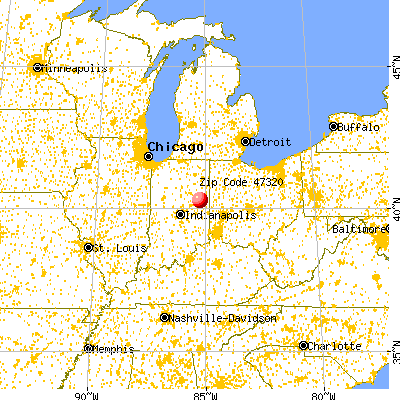


 Nearest zip codes: 47338, 47303, 47368, 47373, 47383, 47336.


 According to the data from the years 2004 - 2018 the average number of fire incidents per year is 21. The highest number of fire incidents - 35 took place in 2012, and the least - 5 in 2015. The data has a dropping trend.
 When looking into fire subcategories, the most incidents belonged to: Outside Fires (47.9%), and Structure Fires (42.1%).